What is a Mother & Child HealthCare Finance & Cost Management Dashboard?
A Mother and Child Care Center financial health and cost management dashboard helps hospitals and clinics monitor revenue, costs, and economic performance across services like OPD, ANC, Delivery, Lab Tests, and NICU. It consolidates all data in one view to track revenue streams, patient volumes, and program efficiency. It also supports monitoring healthcare program costs versus budget and wastage for MCH centers, ensuring optimal fund utilization and transparency. This dashboard is essential for monitoring net surplus, deficit, and overall operational efficiency in mother-and-child care centers.
How to Create Mother & Child HealthCare Finance & Cost Management Dashboard
You don’t need to build your report from scratch-just start with a ready-to-use Mother & Child HealthCare Finance & Cost Management Dashboard template from Mokkup. Add your data and export it as needed. Here’s how to do it:
1. Create or Log in to Your Mokkup Account
Start by signing up on Mokkup.ai using your email. If you already have an account, simply log in, and you’ll be all set.
2. Choose and Customize Your Dashboard Template
Find the Mother & Child Healthcare Finance & Cost Management Dashboard template in the Templates section. Use the drag-and-drop editor to adjust KPIs, edit filters, or add elements based on your data.
3. Export to Your BI Tool
Once your dashboard wireframe is ready, use the BI Tool Export feature to send it directly to Power BI or Tableau for further analysis and enhancements. You can also download the dashboard as a PDF, PNG, or JPEG, embed it on a platform, or invite your team to collaborate.
Note: This is a Pro template. You’ll need a Pro subscription on Mokkup to use and customize this dashboard wireframe. Upgrade anytime to unlock full access.
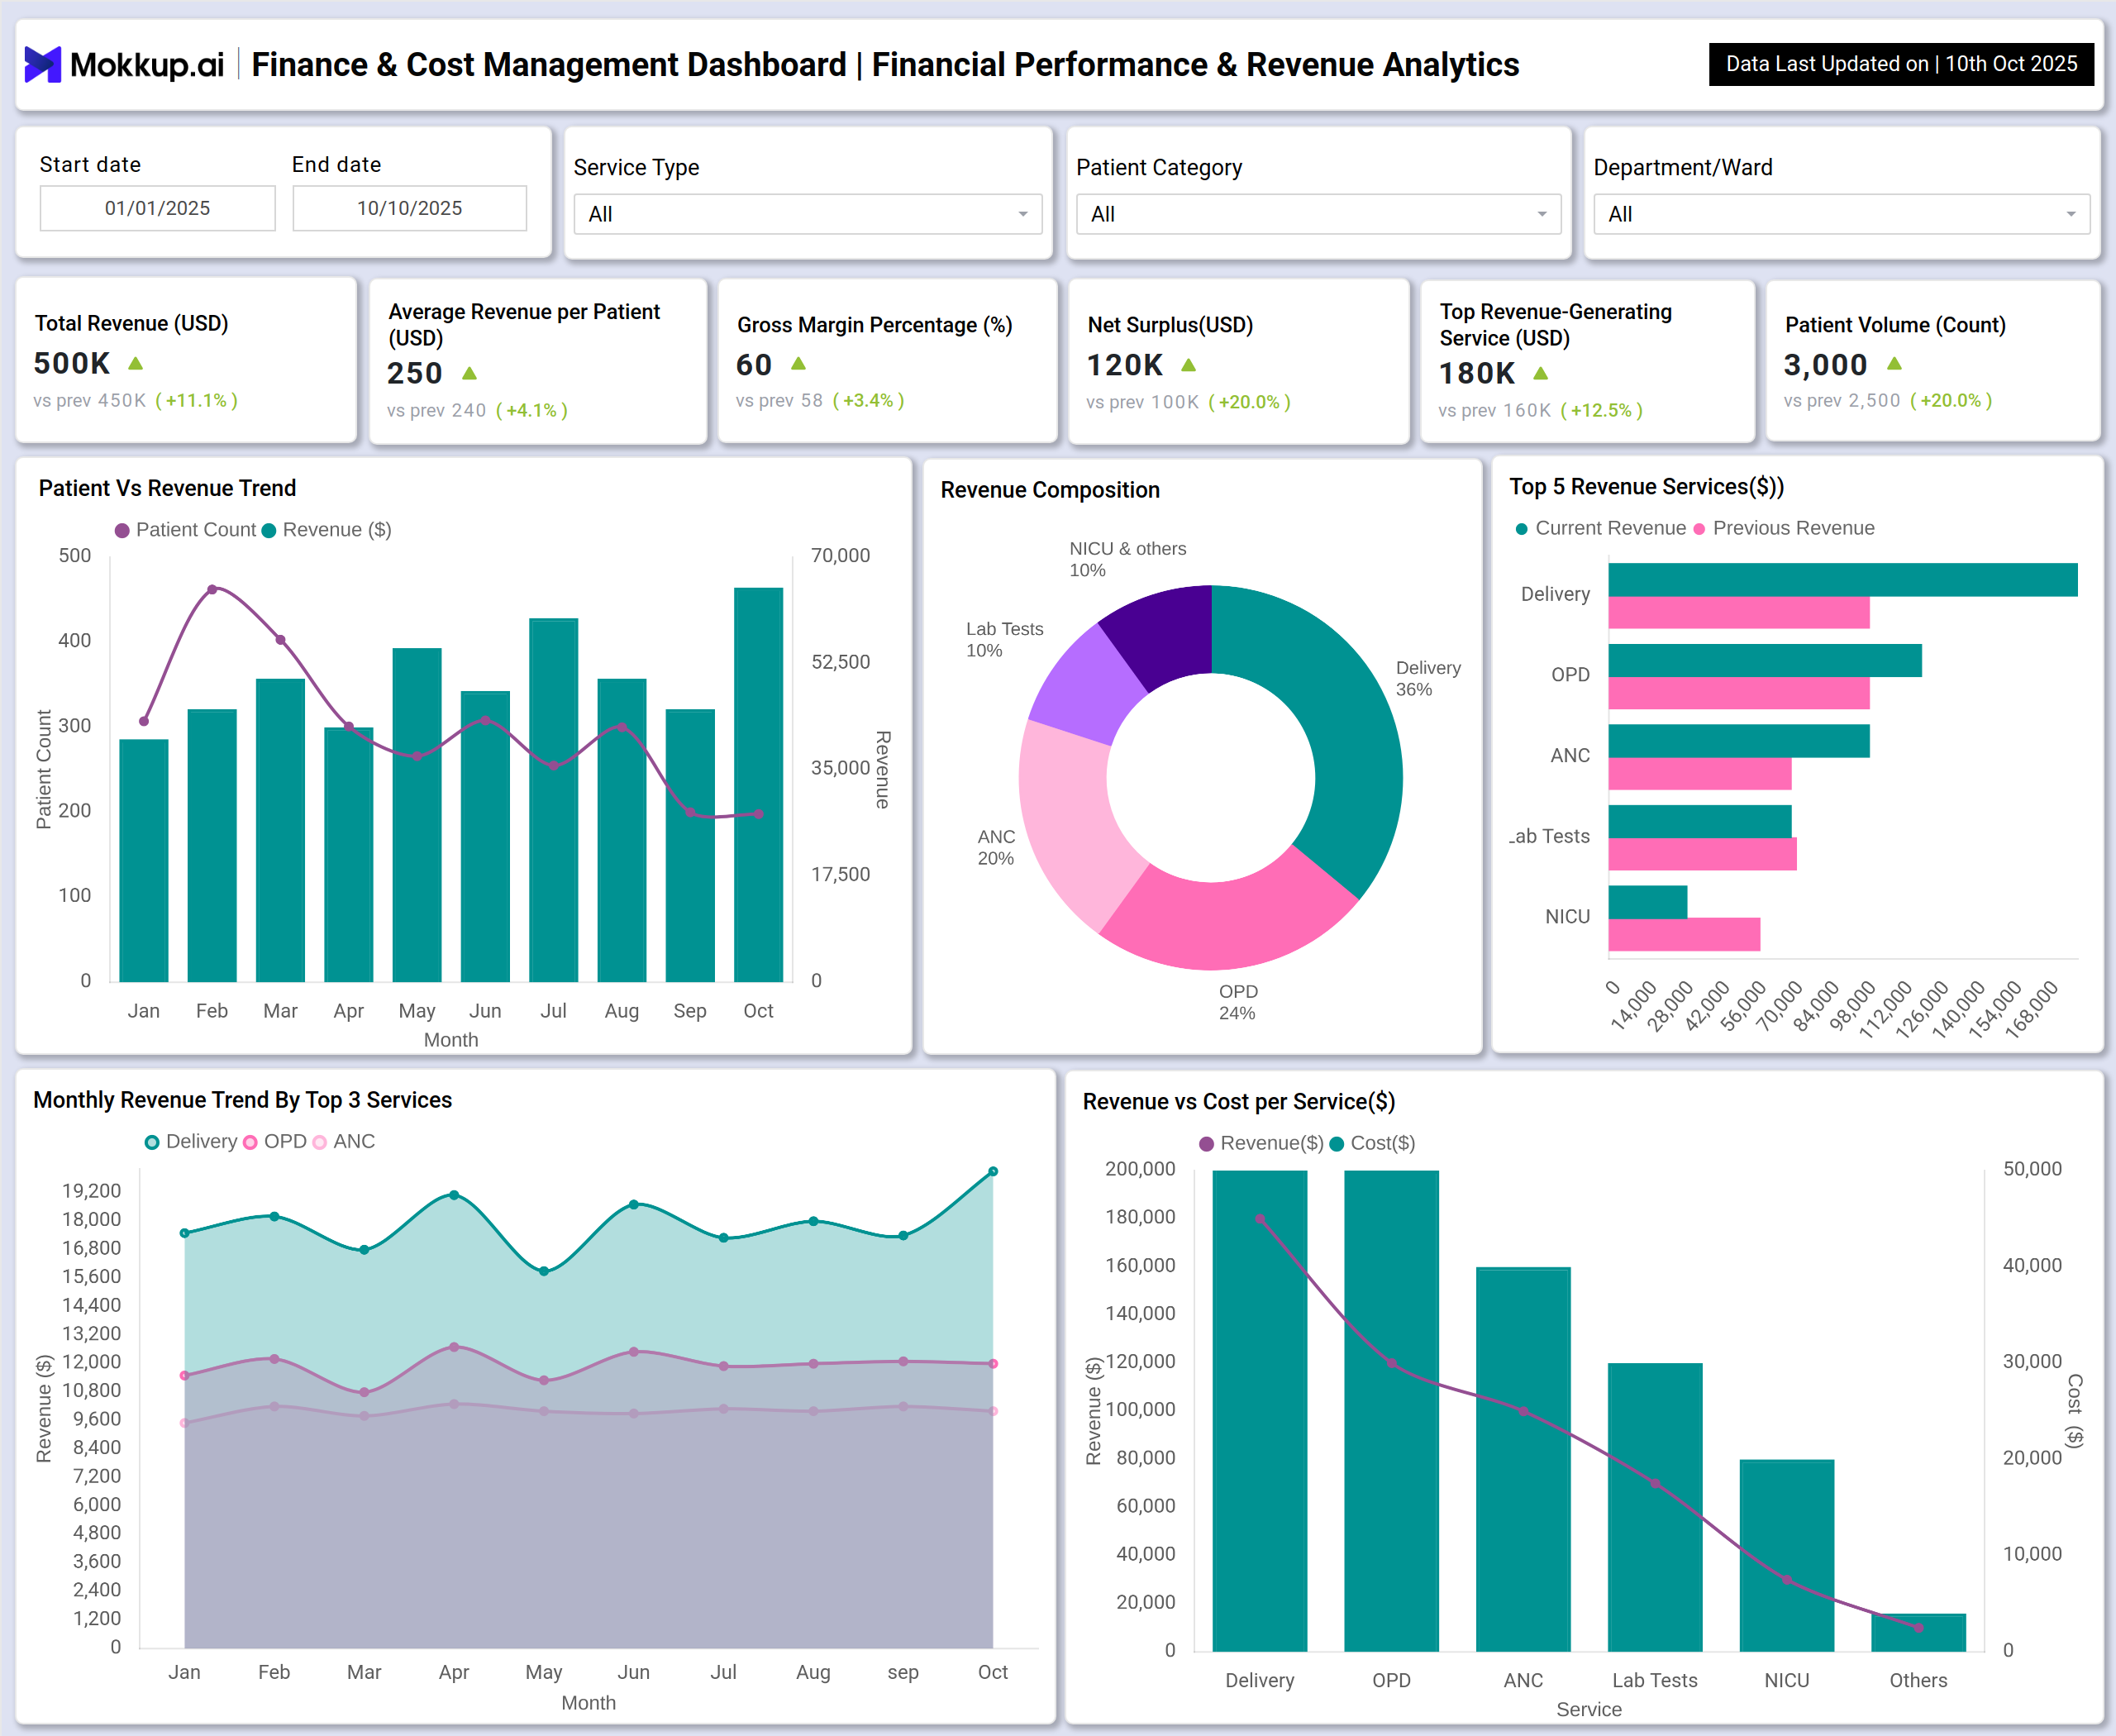
Mother & Child HealthCare Finance & Cost Management Dashboard Example
This dashboard enables analysis of revenue per service and cost per patient for mother and child care, helping to monitor profitability and patient volumes.
Key KPIs include Total Revenue, Average Revenue per Patient, Gross Margin %, Net Surplus/Deficit, and Top Revenue-Generating Service, with interactive visuals for trends and service comparison.
This dashboard supports the tracking of healthcare program costs versus budget and wastage for MCH centers, helping to optimize program spending and efficiency.
Key KPIs include Total Expenditure, Cost per Patient, Program Cost vs. Budget %, Donation/Grant Utilization %, Wastage/Losses %, and Cost Recovery Ratio %, accompanied by visuals for cost breakdowns and trends.
How to Analyze Data in a Mother & Child HealthCare Finance & Cost Management Dashboard
A well-designed MCH dashboard combines real-time data, historical trends, and predictive insights:
- Start with KPIs: Track total revenue, revenue per service, gross margin, and net surplus/deficit to understand overall financial health.
- Assess Service & Program Performance: Identify high-value services and underperforming programs.
- Spot Financial Hotspots: Use filters by service, department, or program to locate cost-intensive areas.
- Track Fund Utilization: Evaluate donations and grants to ensure transparency and practical usage.
- Monitor Cost Efficiency: Utilize cost per patient, waste trends, and cost recovery ratios to optimize operations.
- Identify Trends: Line, bar, and area charts help visualize revenue growth, cost reduction, and operational improvements over time.
Benefits of a Mother & Child HealthCare Finance & Cost Management Dashboard
Here are the benefits of using this healthcare finance dashboard:
- Real-time visibility into revenue, costs, and operational efficiency.
- Improved decision-making with actionable insights.
- Optimized allocation of resources and program budgeting.
- Transparent donation and grant tracking to reduce fund leakage.
- Identification of wastage or inefficiencies to achieve cost reduction.
- Strengthened trust among executives, staff, and donors through transparent reporting.
KPIs to Track in Mother & Child HealthCare Finance & Cost Management Dashboard
- Total Revenue & Revenue per Service -Enables revenue per service and cost per patient analysis for mother and child care, highlighting top-earning services.
- Cost per Patient & Program Cost vs. Budget -Supports healthcare program cost versus budget and wastage tracking for MCH centers to evaluate financial efficiency.
- Donation & Grant Utilization -Facilitates donation and grant utilization reporting in maternal and child healthcare finance to ensure funds are used effectively.
- Net Surplus / Deficit -Tracks the center’s overall financial health and sustainability.
- Wastage / Losses % -Helps identify and reduce operational inefficiencies, linked to program cost and budget tracking.
- Cost Recovery Ratio % -Measures whether programs generate enough revenue to cover costs and maintain sustainability.
Frequently Asked Questions
1. Who should use this dashboard?
Hospital administrators, finance teams, operational managers, and healthcare program coordinators can use this dashboard to monitor expenses, revenue streams, and cost allocation across maternity and pediatric services.
2. Can the dashboard help in cost optimization?
Yes. By analyzing cost patterns, resource utilization, and departmental expenditures, hospitals can identify inefficiencies, reduce wastage, and make strategic financial decisions.