
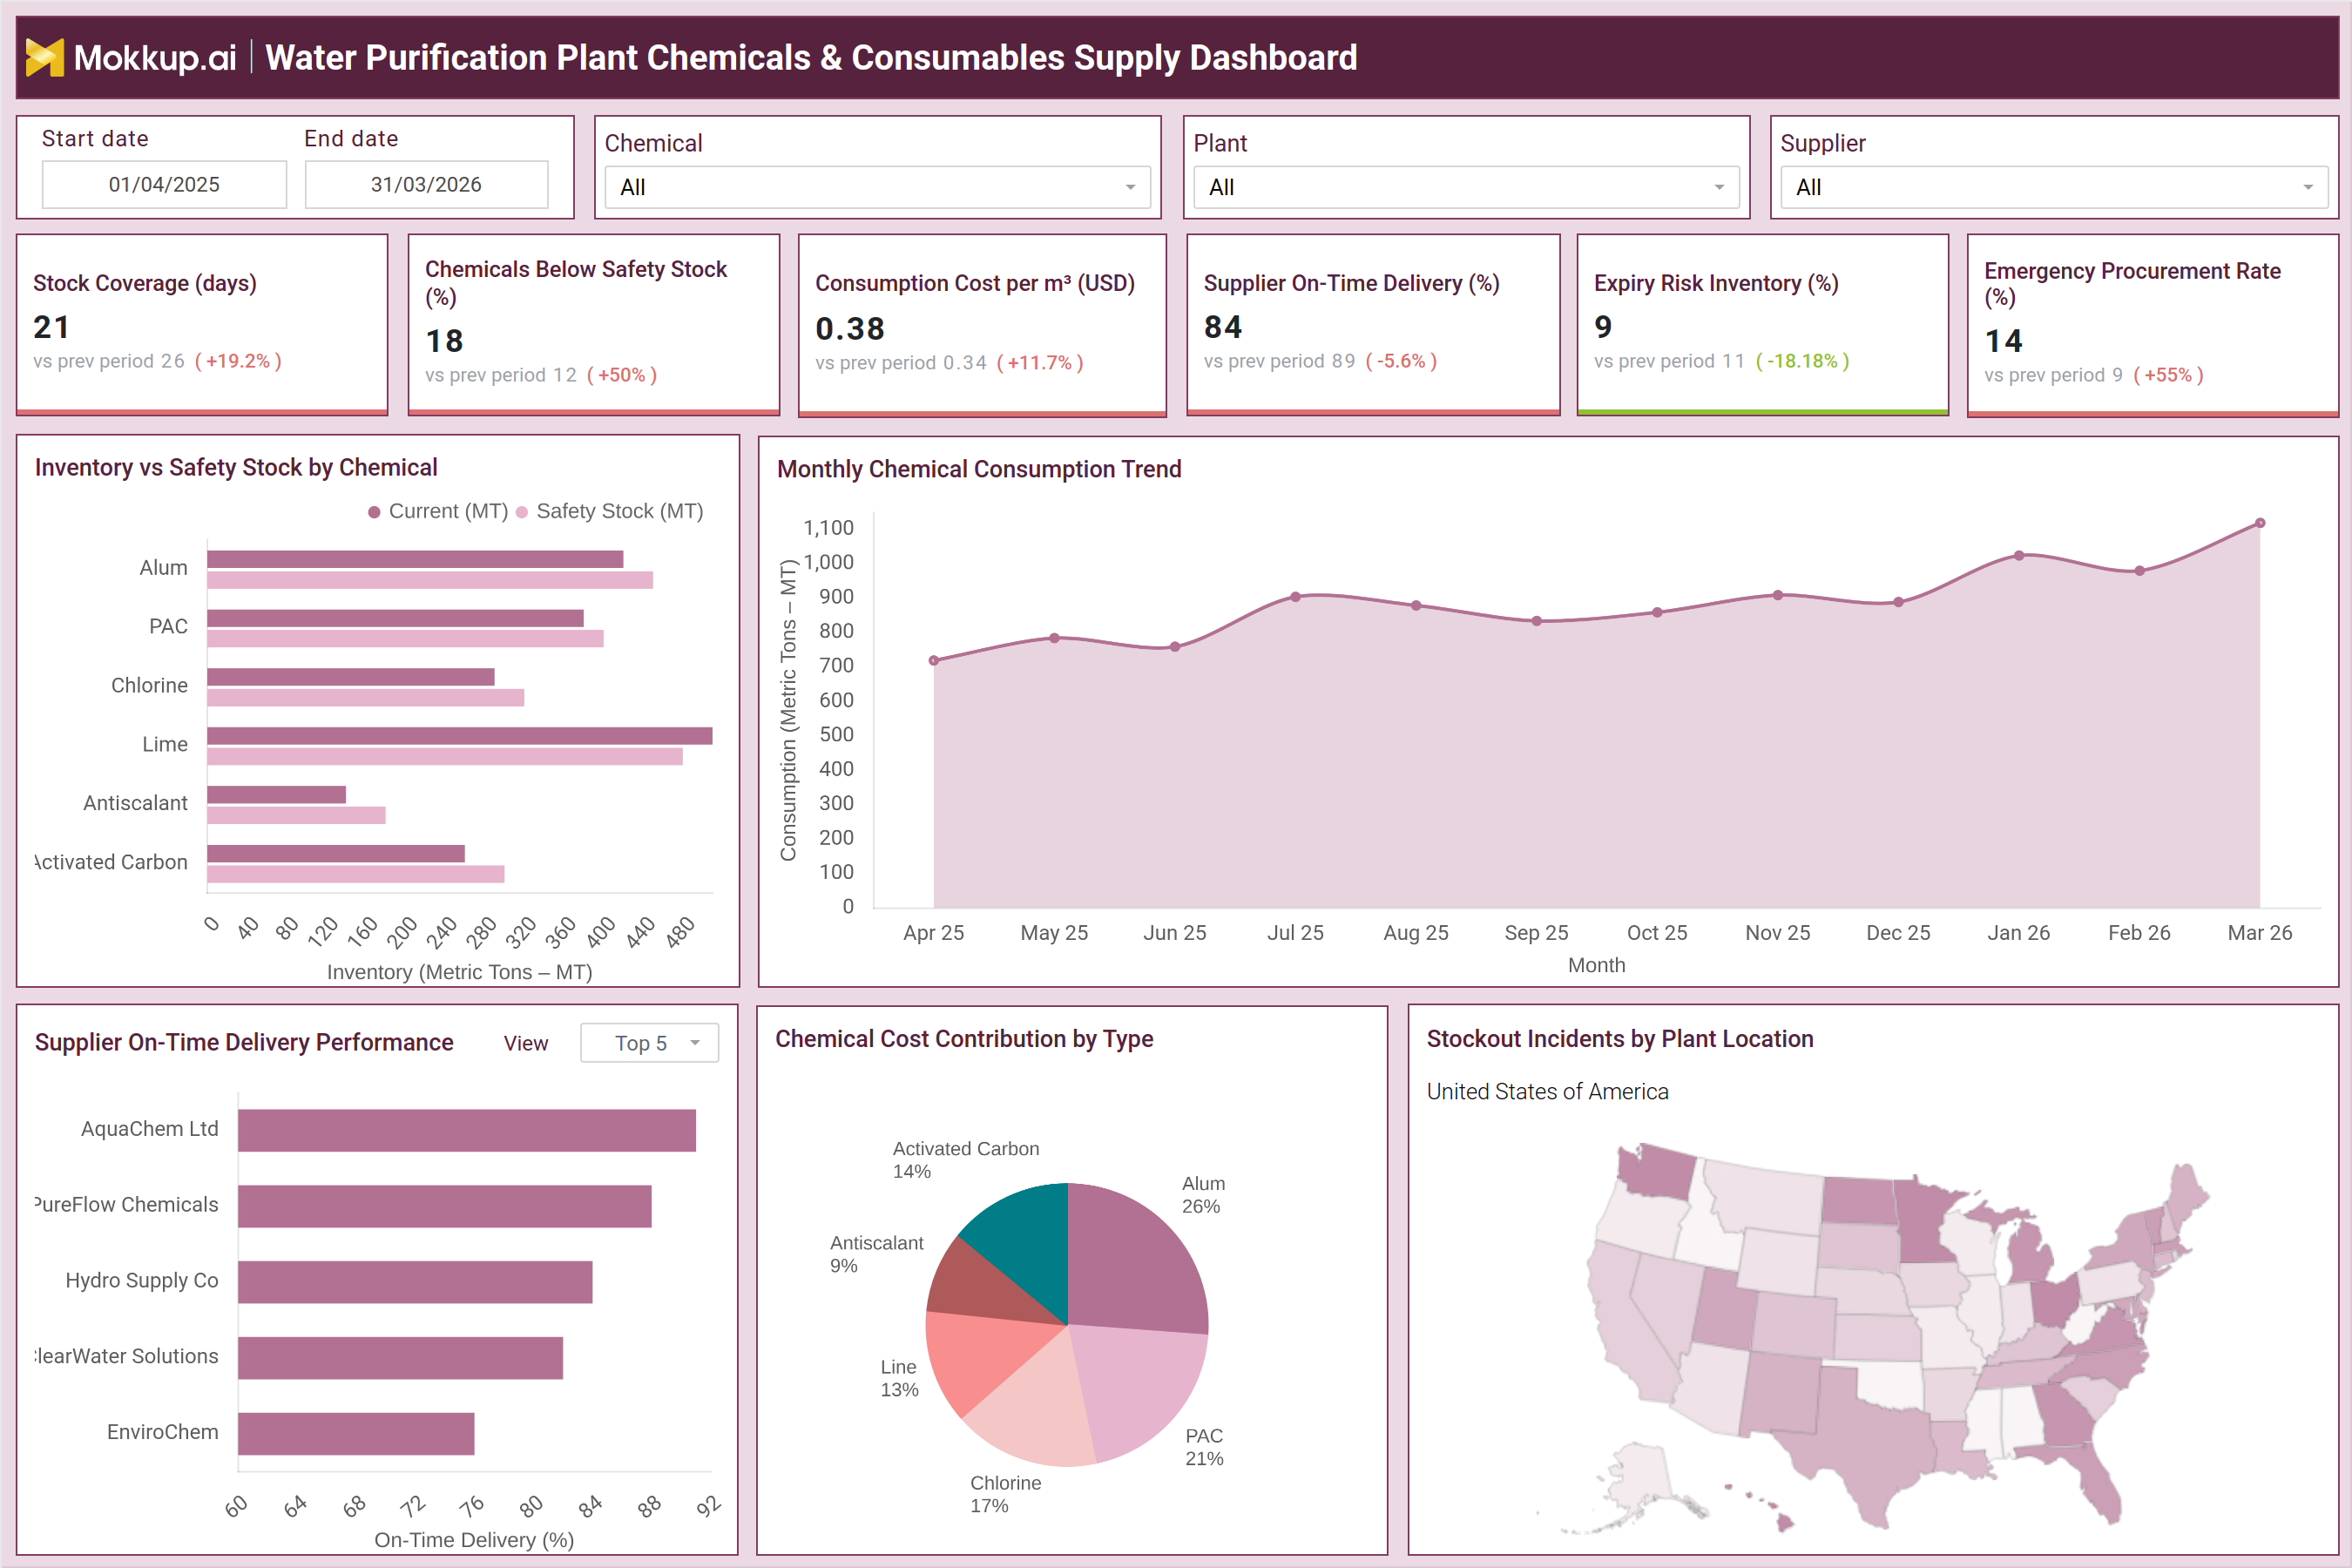
What is a Water Purification Plant Chemicals & Consumables Supply Dashboard?
A water purification plant chemicals supply dashboard is an operational analytics tool used to monitor chemical inventory, consumption patterns, supplier performance, and stock risks in water treatment plants. It provides a structured view of how critical consumables such as alum, chlorine, PAC, and activated carbon are managed across facilities. This water treatment chemicals inventory management dashboard helps ensure uninterrupted treatment operations by tracking stock coverage, safety stock levels, and replenishment cycles. The dashboard integrates procurement, inventory, and usage data to support efficient decision-making. It enables utilities to monitor cost per unit of treatment, detect stockout risks, and evaluate supplier reliability. As a water purification chemical usage and supply analytics dashboard, it supports both operational continuity and financial optimization by aligning chemical consumption with demand and supply planning.
How to Create a Water Purification Plant Chemicals & Consumables Supply Dashboard
You don’t need to build your report from scratch, just start with a ready-to-use dashboard template from Mokkup. Add in your data and export it however you like. Here’s how to do it:
1. Create or Log in to Your Mokkup Account
Start by signing up on Mokkup.ai using your email. If you already have an account, just log in, and you’ll be good to go.
2. Choose and Customize Your Dashboard Template
Find the Water Purification Plant Chemicals & Consumables Supply Dashboard template in the Templates section. Use the drag-and-drop editor to adjust KPIs, edit filters, or add elements based on your data.
3. Export to Your BI Tool
Once your dashboard wireframe is ready, use the BI Tool Export feature to send it directly to Power BI or Tableau for further analysis and enhancements. You can also download the dashboard as a PDF, PNG, or JPEG, embed it on a platform, or invite your team to collaborate.
Note: This is a Pro template. You’ll need a Pro subscription on Mokkup to use and customize this dashboard wireframe. Upgrade anytime to unlock full access.
Water Purification Plant Chemicals & Consumables Supply Dashboard Example
A typical water treatment plant consumables supply performance dashboard provides a combination of KPI indicators and visual analytics to track chemical supply health. For example, stock coverage may be at 21 days, indicating how long current inventory can sustain operations. At the same time, 18% of chemicals may be below safety stock, signaling potential supply risks. The dashboard also shows consumption cost per cubic meter, which helps track treatment cost efficiency. Supplier on-time delivery performance, such as 84%, highlights procurement reliability, while expiry risk inventory indicates how much stock is nearing expiration.
Visuals such as inventory vs safety stock by chemical help identify which materials are understocked or overstocked. Monthly consumption trends reveal demand fluctuations, while supplier performance charts show reliability differences across vendors. Cost contribution charts break down which chemicals drive the highest cost. Additionally, geographic views of stockout incidents highlight regional supply issues. This makes the water treatment chemical stock and replenishment monitoring dashboard highly actionable for operations and procurement teams.
How to Analyze Data in Water Purification Plant Chemicals & Consumables Supply Dashboard
Here is how you can analyze data from this dashboard:
- Start with stock coverage to assess how long inventory can support operations
- Check chemicals below safety stock to identify immediate replenishment needs
- Review consumption cost per cubic meter to evaluate cost efficiency
- Analyze supplier on-time delivery to assess procurement reliability
- Monitor expiry risk inventory to reduce wastage and optimize stock rotation
- Compare inventory vs safety stock across chemicals to detect shortages or excess
- Evaluate monthly consumption trends to understand demand patterns
- Review supplier performance rankings to identify reliable vendors
- Analyze chemical cost contribution to identify high-cost consumables
- Track stockout incidents by location to identify supply chain gaps
Benefits of Water Purification Plant Chemicals & Consumables Supply Dashboard
The following are the benefits of using this dashboard:
- Ensures continuous plant operations by preventing chemical stockouts
- Improves inventory planning through stock visibility
- Reduces chemical wastage by tracking expiry and overstock conditions
- Enhances supplier performance monitoring and vendor selection
- Supports cost optimization by tracking consumption efficiency
- Enables proactive replenishment planning based on demand trends
- Improves procurement decision-making with data-driven insights
- Aligns operations and supply chain teams on inventory strategy
- Reduces emergency procurement and associated costs
- Strengthens overall supply chain resilience in water treatment operations
KPIs to Track in Water Purification Plant Chemicals & Consumables Supply Dashboard
The following key KPIs can be tracked by using this dashboard:
- Stock Coverage (days): Measures how long current inventory can sustain operations
- Chemicals Below Safety Stock (%): Tracks the percentage of chemicals below minimum required levels
- Consumption Cost per m³ (USD): Indicates cost efficiency of chemical usage in treatment
- Supplier On-Time Delivery (%): Measures reliability of suppliers in meeting delivery timelines
- Expiry Risk Inventory (%): Tracks inventory nearing expiration to reduce wastage
- Emergency Procurement Rate (%): Indicates dependency on urgent, unplanned purchases
- Inventory vs Safety Stock: Compares current stock levels against required thresholds
- Monthly Chemical Consumption: Tracks usage trends across time
- Supplier Performance Score: Evaluates vendor reliability and consistency
- Chemical Cost Contribution (%): Identifies high-cost chemicals impacting overall expenses
- Stockout Incidents by Location: Tracks frequency and distribution of stock shortages
Frequently Asked Questions
1. Why is a chemicals supply dashboard important in water treatment plants?
It ensures continuous operations by monitoring inventory levels, supplier performance, and consumption trends.
2. Who uses this dashboard?
Plant managers, procurement teams, supply chain managers, and operations teams use it for inventory and supply planning.
3. How does it help reduce costs?
This Water purification plant chemical consumption tracking dashboard tracks consumption efficiency and identifies high-cost chemicals, supporting better procurement and usage decisions.