What is a Pediatric Cost & Revenue Performance Dashboard?
A Pediatric Cost & Revenue Performance Dashboard is a centralized platform designed to monitor profitability, treatment cost efficiency, payer behavior, cash flow stability, and operational margin across pediatric hospitals. It enables CFOs, finance managers, revenue cycle teams, and operations leaders to track financial outcomes and resource utilization in real time.
By combining clinical and financial data, this Healthcare finance analytics dashboard supports strategic decision-making, identifies high-cost service areas, optimizes payer mix, and strengthens pediatric revenue cycle performance. This financial performance tracking tool for pediatric hospitals improves budget allocation, lowers revenue leakage, and ensures sustainable financial growth.
How to Create a Pediatric Cost & Revenue Performance Dashboard
You don’t need to build your report from scratch-just start with a ready-to-use dashboard template from Mokkup. Add in your data and export it however you like. Here’s how to do it:
1. Create or Log in to Your Mokkup Account
Start by signing up on Mokkup.ai using your email. If you already have an account, just log in, and you’ll be good to go.
2. Choose and Customize Your Dashboard Template
Find the Cost & Revenue Performance Dashboard Template in the Templates section. Use the drag-and-drop editor to adjust KPIs, edit filters, or add elements based on your data.
3. Export to Your BI Tool
Once your dashboard wireframe is ready, use the BI Tool Export feature to send it directly to Power BI or Tableau for further analysis and enhancements. You can also download the dashboard as a PDF, PNG, or JPEG, embed it on a platform, or invite your team to collaborate.
Note: This is a Pro template. You’ll need a Pro subscription on Mokkup to use and customize this dashboard wireframe. Upgrade anytime to unlock full access.
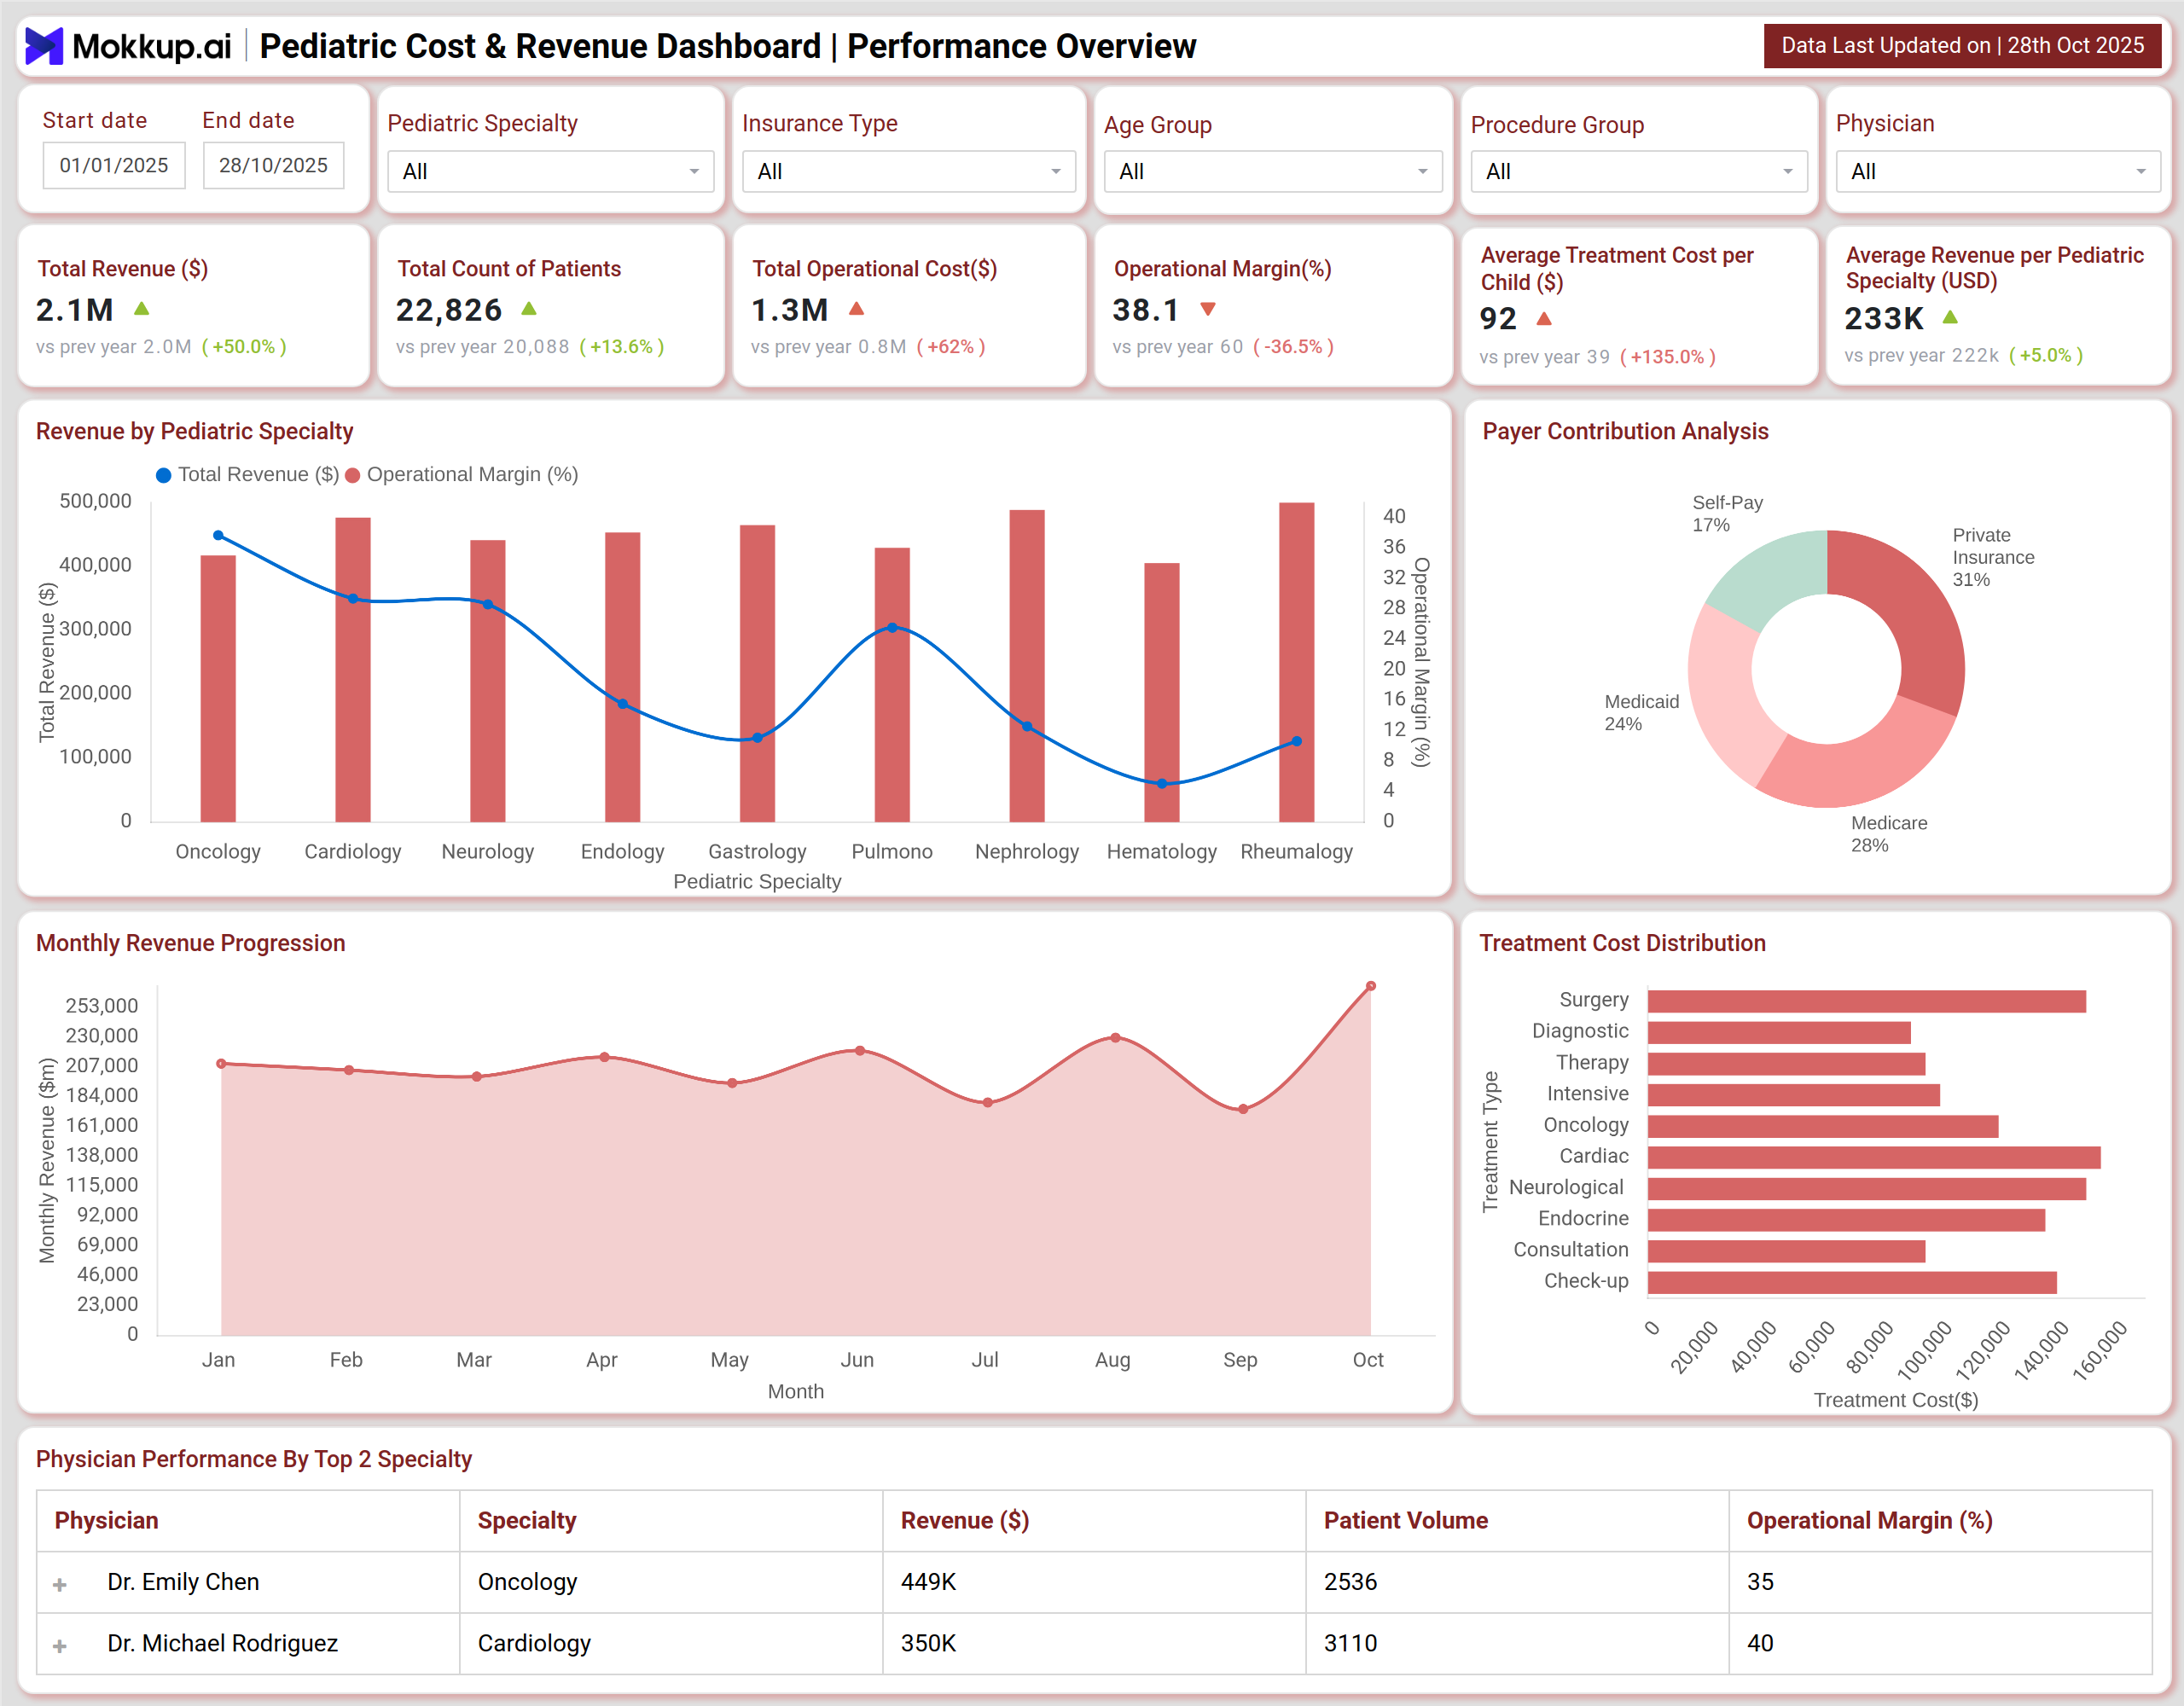
Pediatric Cost & Revenue Performance Dashboard Example
Pediatric Cost & Revenue Performance Dashboard tracks revenue outcomes, margin trends, treatment cost efficiency, operational margin, pediatric hospital goals, and specialty-wise contribution. It highlights profitable pediatric specialties and areas needing improvement to enhance financial outcomes. This dashboard template monitors billing delays, AR aging, claim denials, cash collection effectiveness, and write-off trends. It works like a Healthcare revenue cycle dashboard, identifying slow payers and high-risk departments for a stronger cash flow and lower revenue leakage.
How to Analyse Data in Pediatric Cost & Revenue Dashboard
Here’s how healthcare professionals can leverage the Pediatric Cost & Revenue Dashboard:
- Start with KPIs: Track Total Revenue (YTD), Avg Cost per Child, Operational Margin %, Payer Mix, Collection Efficiency %, Unbilled Revenue, and AR Aging. These metrics help evaluate Pediatric financial performance analytics and support accurate benchmarking.
- Assess Operational Efficiency: Compare revenue and margin % across specialties, physicians, and case volumes for better accountability.
- Track Cost & Revenue Mix Trends: Review payer mix analysis for pediatrics and self-pay ratios to maintain affordability and optimize margins.
- Analyze Provider & Service Insights: Visual techniques-heatmaps, line charts, bar charts-help detect high-loss services and improve outcome-based decisioning.
- Detect Patterns & High-Risk Segments: Filter by specialty, age group, insurance type, and procedures to reduce liquidity exposure.
Benefits of a Pediatric Cost & Revenue Performance Dashboard
A Pediatric Cost & Revenue Performance offers several benefits:
- Real-time visibility into financial trends and cost optimization
- Improved operational margin of pediatric hospital measures across services
- Reduces AR aging & revenue leakage through billing analytics
- Strengthens collection effectiveness and proactive risk management
- Enhances Healthcare revenue cycle dashboard governance for CFOs
- Supports resource allocation and long-term pediatric service sustainability
KPIs to Track in Pediatric Cost & Revenue Performance Dashboard
It helps you track multiple KPIs as follows:
- Total Revenue: Measures overall financial contribution for the year.
- Avg Treatment Cost per Child: Compares per-case cost vs benchmarks for cost control.
- Operational Margin (%): Indicates profitability after deducting operational expenses.
- Insurance Coverage %: Displays reliance on insurance reimbursement vs OOP.
- Accounts Receivable Days (DSO): Measures liquidity and cash conversion efficiency.
- Billing Cycle Time: Time taken from service delivery to bill clearance.
- Bad Debt %: Identifies unrecoverable revenue impacting financial sustainability.
Frequently Asked Questions
Q1. How does monitoring revenue by specialty improve pediatric financial planning?
Specialty-level revenue and margin analysis reveal high-cost services and profit drivers. This supports workload balancing, investment allocation, and operational finance improvement in pediatric hospitals.
Q2. How does physician-level revenue & case volume monitoring reduce losses?
Linking physician performance to margin % and case outcomes enhances accountability, identifies bottlenecks, and facilitates financial performance tracking for pediatric hospitals.
Q3. Why is an AR aging review and payer mix assessment essential?
AR buckets and payer mix analysis for pediatrics reveal dependency on slow payers and cash flow risks, highlighting the need for timely action.