- Consolidated Financial Visibility: Enhances transparency by combining revenue, cost, and efficiency metrics in one platform.
- Improved Revenue Recovery: Strengthens tariff recovery monitoring by comparing approved and actual collections.
- Operational Cost Reduction: Reduces costs through data-driven maintenance optimization and energy loss analysis.
- Regulatory Compliance Support: Supports compliance by tracking asset base growth and financial performance indicators.
- Optimized Capital Allocation: Aligns grid investments with revenue stability and efficiency objectives.
- Proactive Cost Management: Identifies spending trends and inefficiencies for timely corrective action.
- Stronger Decision Making: Enables informed management decisions using integrated financial and operational insights.
What is an Electric Power Transmission Center Revenue & Cost Efficiency Dashboard?
An Electric Power Transmission Center Revenue & Cost Efficiency Dashboard template is a specialized analytics tool designed for Transmission System Operators (TSOs) to monitor financial performance, cost efficiency, and revenue optimization. It consolidates key financial metrics, operational expenses, and regulatory compliance data into a single interface, enabling utilities to track tariff recovery rates, maintenance costs, energy losses, and asset growth.
This power grid transmission financial efficiency reporting tool helps TSOs identify cost-saving opportunities, improve tariff recovery efficiency, and ensure regulatory compliance by providing actionable insights into grid maintenance expenses, unaccounted energy losses, and revenue trends. By analyzing approved tariff revenue, cost efficiency ratios, and regulatory asset growth, utilities can make data-driven decisions to enhance financial sustainability while maintaining grid reliability.
How to Create an Electric Power Transmission Center Revenue & Cost Efficiency Dashboard
You don’t need to build your report from scratch; just start with a ready-to-use Electric Power Transmission Center Revenue & Cost Efficiency dashboard template from Mokkup. Add in your data and export it however you like. Here’s how to do it:
1. Create or Log in to Your Mokkup Account
Start by signing up on Mokkup.ai using your email. If you already have an account, just log in, and you’ll be good to go.
2. Choose and Customize Your Dashboard Template
Find the Electric Power Transmission Center Revenue & Cost Efficiency Dashboard template in the Templates section. Use the drag-and-drop editor to adjust KPIs, edit filters, or add elements based on your data.
3. Export to Your BI Tool
Once your dashboard wireframe is ready, use the BI Tool Export feature to send it directly to Power BI or Tableau for further analysis and enhancements. You can also download the dashboard as a PDF, PNG, or JPEG, embed it on a platform, or invite your team to collaborate.
Note: This is a Pro template. You’ll need a Pro subscription on Mokkup to use and customize this dashboard wireframe. Upgrade anytime to unlock full access.
Electric Power Transmission Center Revenue & Cost Efficiency Dashboard Example
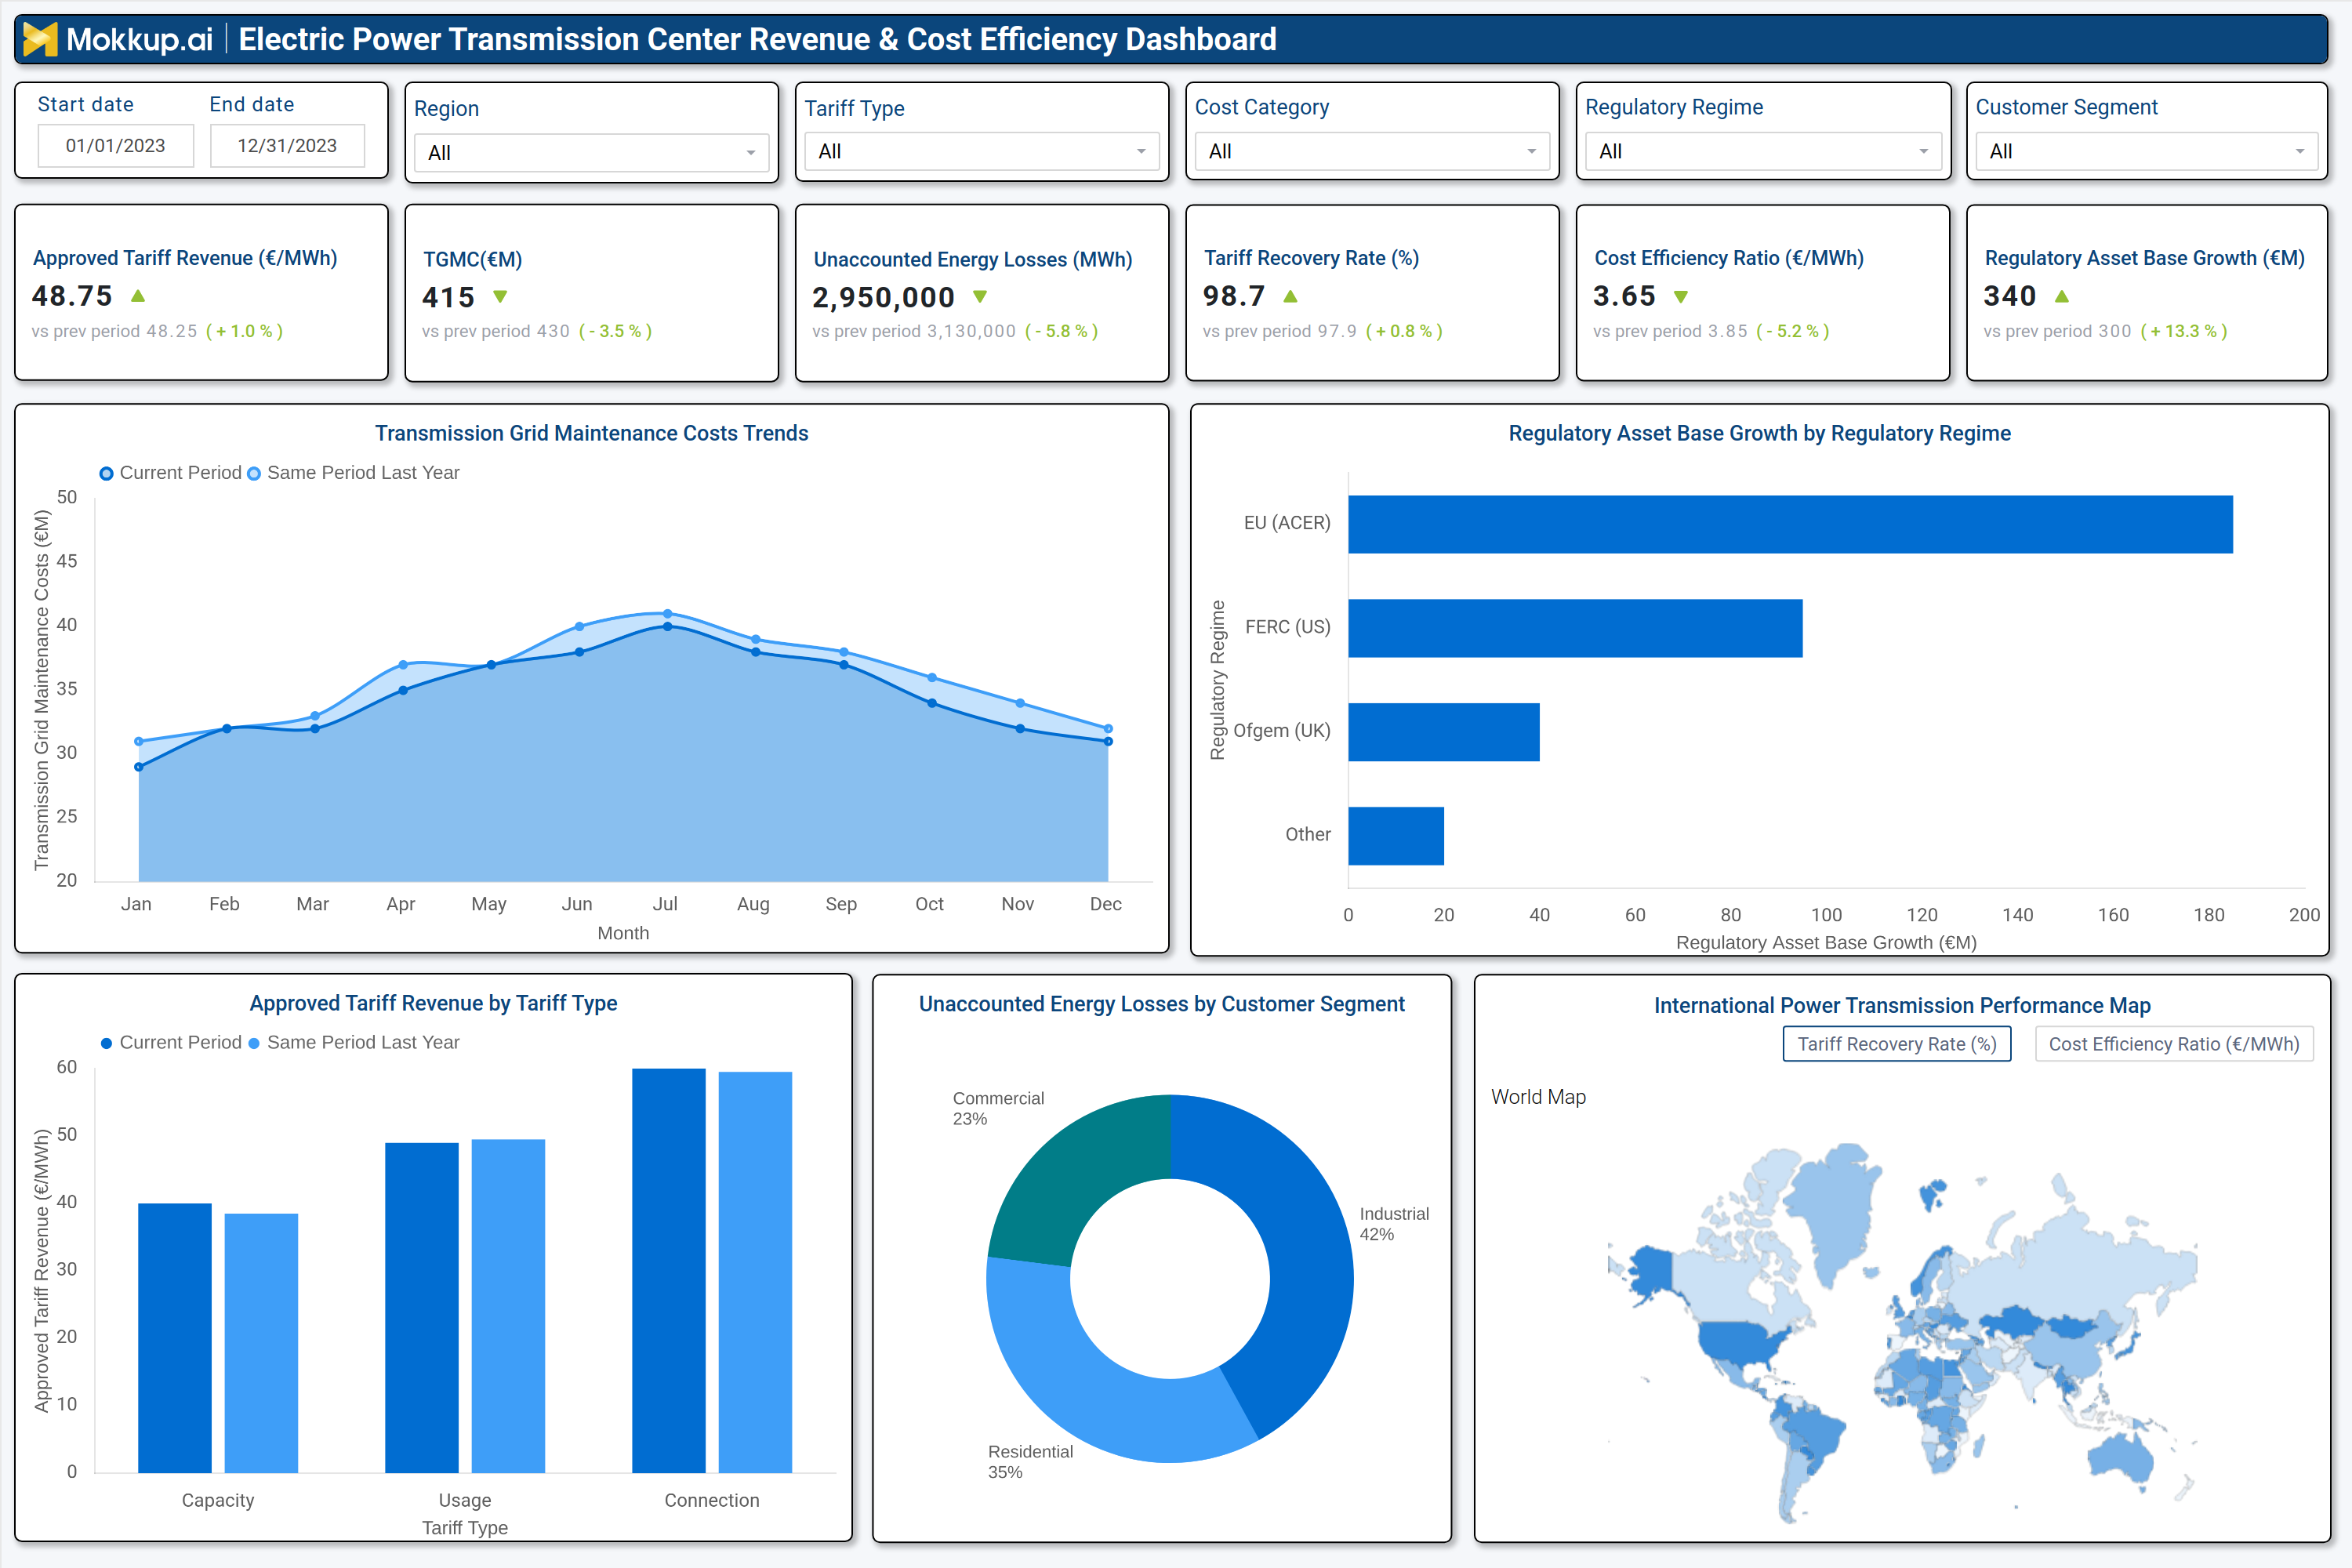
A well-designed energy transmission center expense management solution includes interactive filters for date ranges, regions, tariff types, cost categories, and regulatory regimes. Key performance tiles display approved tariff revenue per MWh, transmission grid maintenance costs, unaccounted energy losses, tariff recovery rates, cost efficiency ratios, and regulatory asset base growth. Trend charts compare current period performance against historical data, helping utilities assess cost fluctuations and revenue stability.
A regulatory asset growth breakdown by regime (e.g., EU ACER, FERC, Ofgem) highlights compliance and investment trends. Additionally, energy loss analysis by customer segment (residential, commercial, industrial) and geographic loss mapping helps pinpoint inefficiencies in transmission operations. Together, these components form a comprehensive financial monitoring system that enables TSOs to optimize revenue, control costs, and improve grid efficiency.
How to Analyze Data in an Electric Power Transmission Center Revenue & Cost Efficiency Dashboard
Here is how you can analyze data from this dashboard:
- Tariff Revenue Performance: Monitor approved tariff revenue per MWh to assess pricing effectiveness and revenue stability.
- Maintenance Cost Control: Track transmission grid maintenance costs to identify cost-saving opportunities in grid upkeep.
- Energy Loss Monitoring: Analyze unaccounted energy losses to detect inefficiencies in transmission and distribution.
- Tariff Recovery Efficiency: Evaluate tariff recovery rates to ensure revenue collection aligns with approved tariffs.
- Cost Efficiency Benchmarking: Assess cost efficiency ratios (€/MWh) to benchmark operational spending against industry standards.
- Regulatory Asset Tracking: Review regulatory asset base growth to monitor infrastructure investments and compliance alignment.
- Trend & Anomaly Detection: Compare current performance with historical data to identify financial trends and unusual deviations.
- Geographic & Segment Analysis: Use geographic and customer segment breakdowns to pinpoint high-loss zones and optimize grid performance.
Benefits of an Electric Power Transmission Center Revenue & Cost Efficiency Dashboard
The following are the benefits of using this dashboard:
KPIs to Track in an Electric Power Transmission Center Revenue & Cost Efficiency Dashboard
The following key KPIs can be tracked by using this electric power transmission operational cost analysis dashboard:
- Approved Tariff Revenue (€/MWh): Measures revenue generated from approved transmission tariffs.
- Transmission Grid Maintenance Costs (€M): Tracks expenses related to grid upkeep and repairs.
- Unaccounted Energy Losses (MWh): Quantifies energy lost during transmission due to inefficiencies.
- Tariff Recovery Rate (%): Indicates the percentage of approved tariffs successfully collected.
- Cost Efficiency Ratio (€/MWh): Benchmarks operational spending against energy transmission volume.
- Regulatory Asset Base Growth (€M): Monitors infrastructure investments under regulatory frameworks.
Frequently Asked Questions
Q1. What is the purpose of an electric power transmission center cost efficiency dashboard?
It helps Transmission System Operators (TSOs) track financial performance, optimize costs, and improve tariff recovery efficiency.
Q2. Who should use this transmission system operator (TSO) revenue monitoring dashboard?
Utility finance teams, grid operators, regulatory compliance officers, and executive leadership.
Q3. How does this grid transmission utility financial performance dashboard improve cost efficiency?
By identifying high-cost areas, energy losses, and revenue leaks, enabling data-driven cost optimization.