
What is a Water Purification Plant Asset Health Dashboard?
A water purification plant asset health dashboard is a centralized analytics tool used to monitor the condition, reliability, and performance of critical equipment in water treatment facilities. It provides visibility into asset health metrics such as failure rates, maintenance compliance, downtime, and operational efficiency. This water treatment plant asset performance dashboard helps utilities track the lifecycle and performance of key assets, including pumps, motors, valves, filters, and electrical systems. It enables proactive maintenance by identifying assets in critical condition and predicting potential failures. Using a water purification asset health monitoring dashboard, operators can optimize maintenance strategies, reduce downtime, and extend asset lifespan. It also serves as a water treatment equipment performance analytics dashboard, supporting data-driven decisions to improve reliability and cost efficiency across plant operations.
How to Create a Water Purification Plant Asset Health Dashboard
You don’t need to build your report from scratch; just start with a ready-to-use dashboard template from Mokkup. Add in your data and export it however you like. Here’s how to do it:
1. Create or Log in to Your Mokkup Account
Start by signing up on Mokkup.ai using your email. If you already have an account, just log in, and you’ll be good to go.
2. Choose and Customize Your Dashboard Template
Find the Water Purification Plant Asset Health Dashboard template in the Templates section. Use the drag-and-drop editor to adjust KPIs, edit filters, or add elements based on your data.
3. Export to Your BI Tool
Once your dashboard wireframe is ready, use the BI Tool Export feature to send it directly to Power BI or Tableau for further analysis and enhancements. You can also download the dashboard as a PDF, PNG, or JPEG, embed it on a platform, or invite your team to collaborate.
Note: This is a Pro template. You’ll need a Pro subscription on Mokkup to use and customize this dashboard wireframe. Upgrade anytime to unlock full access.
Water Purification Plant Asset Health Dashboard Example
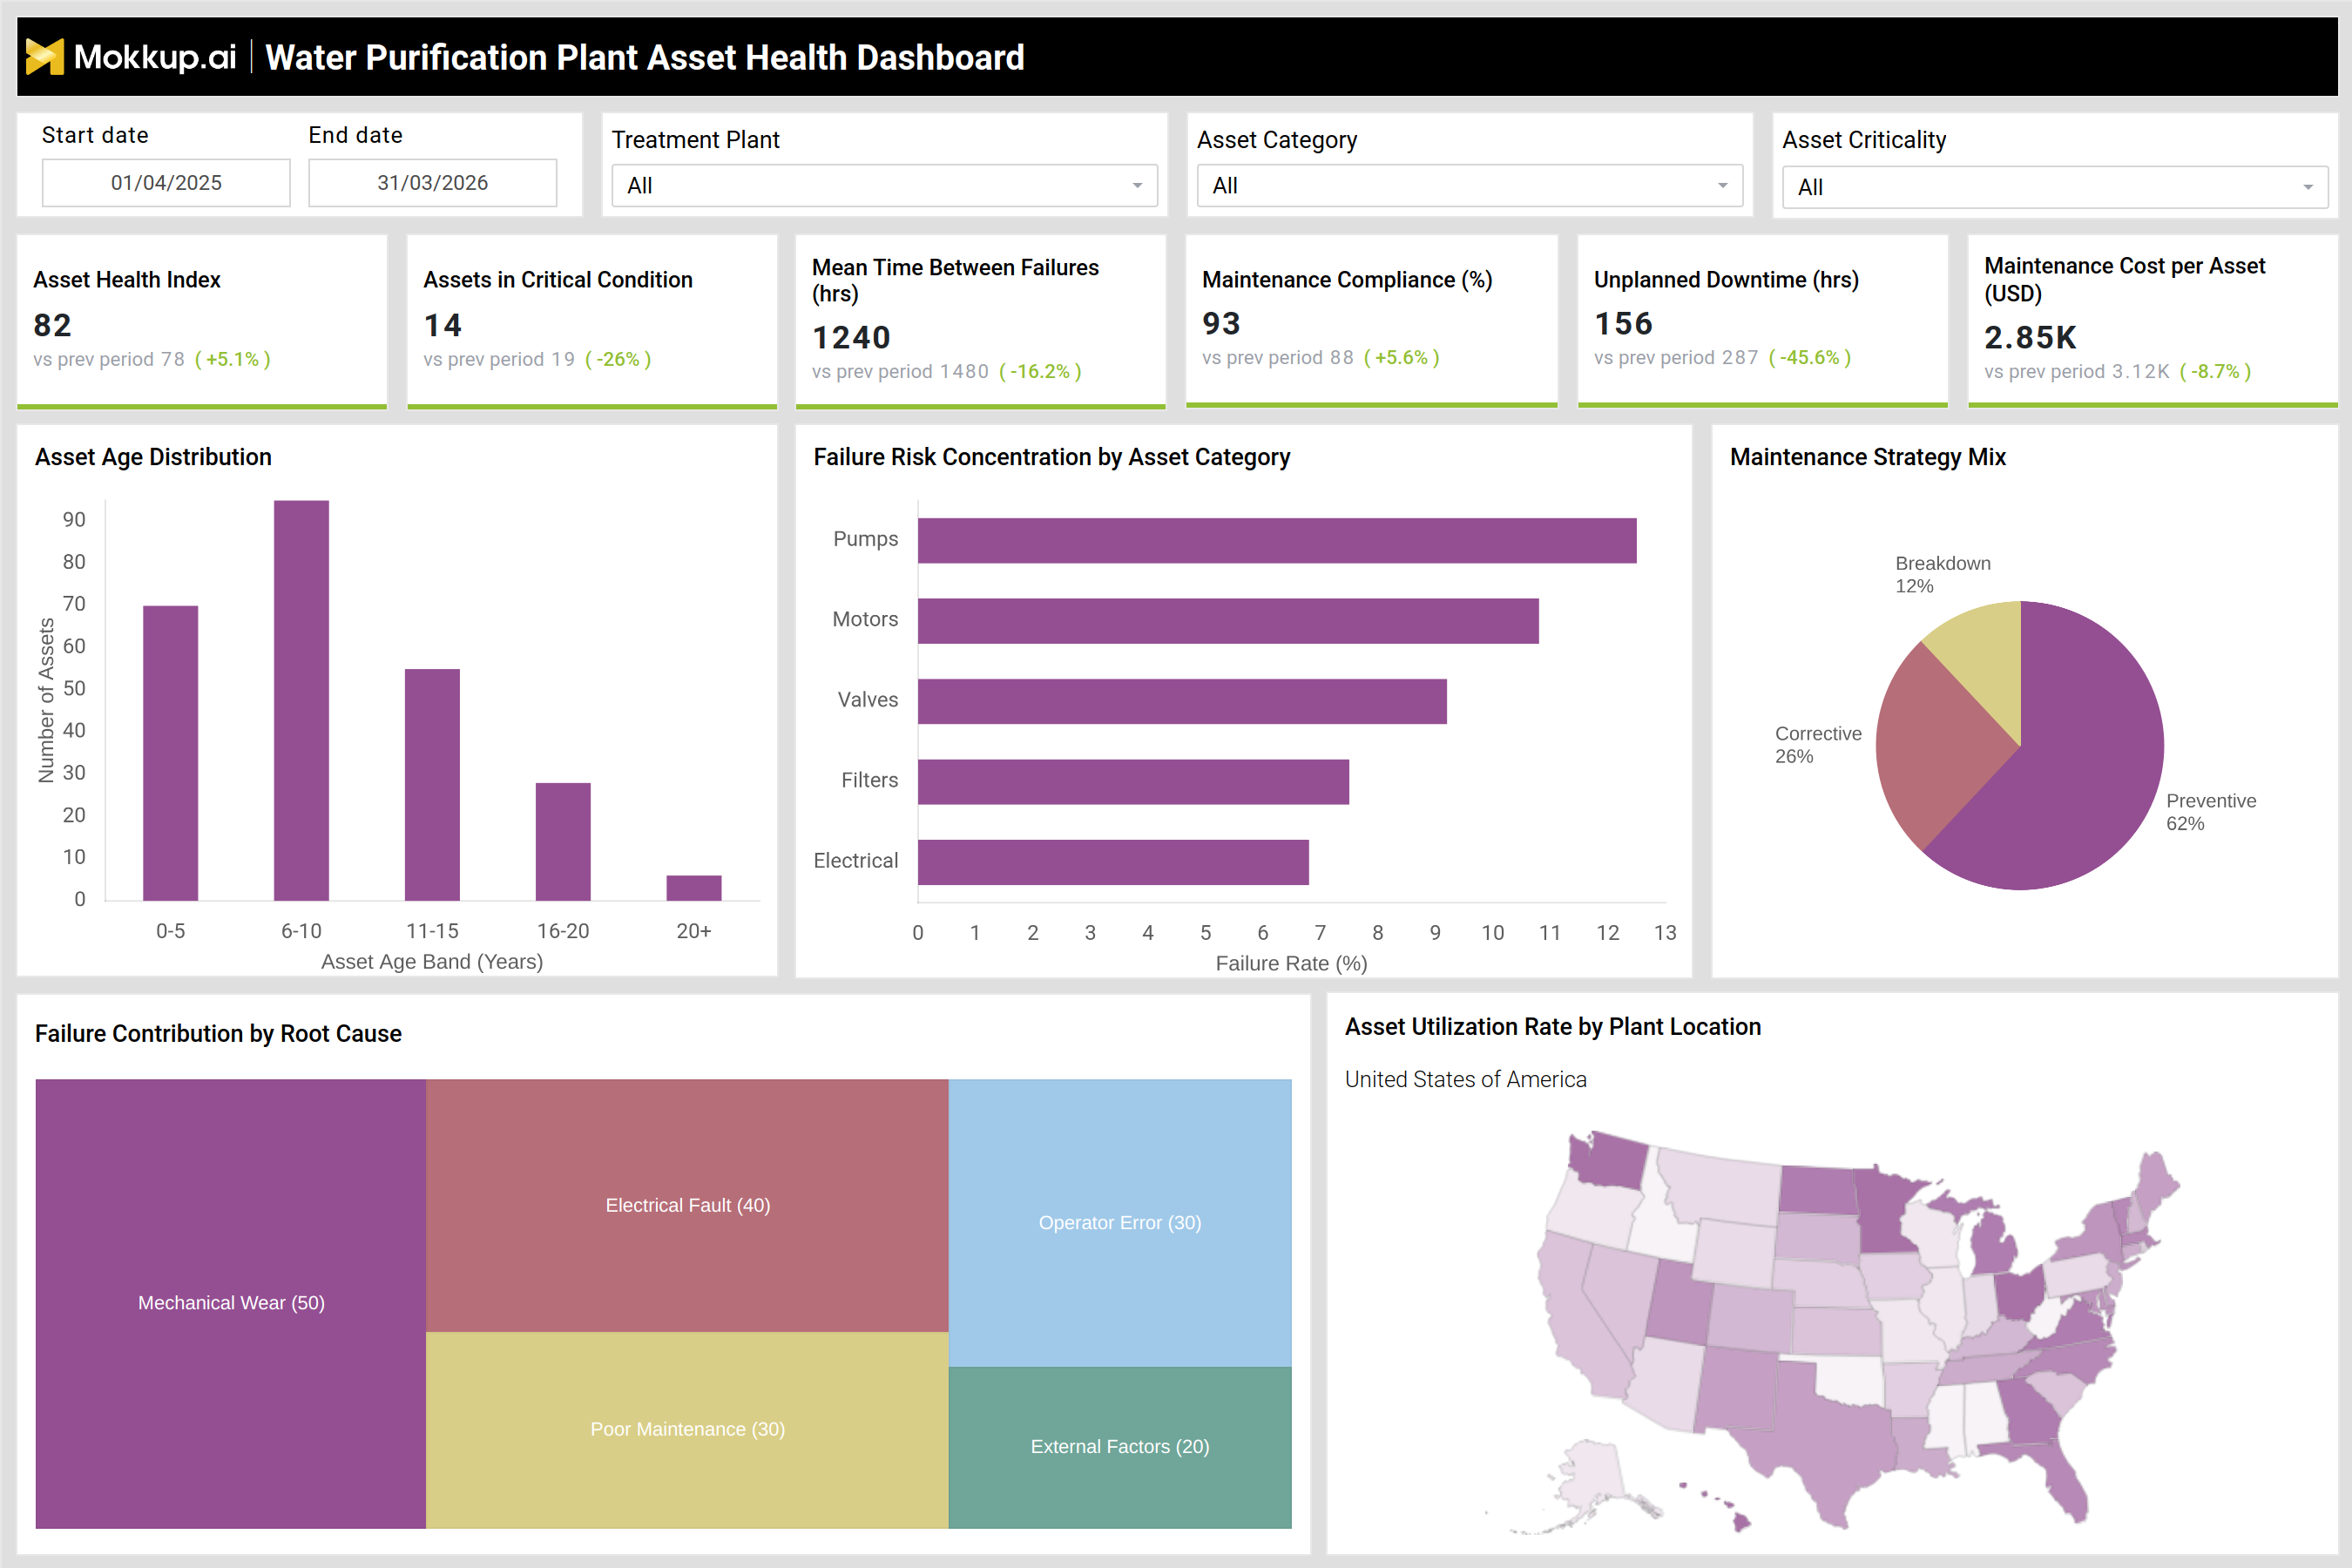
A typical water purification plant maintenance analytics dashboard provides a comprehensive view of asset condition, failure risk, and maintenance performance. For example, the dashboard shows an asset health index of 82, indicating an overall stable equipment condition. Assets in critical condition are reduced to 14, reflecting improved maintenance effectiveness. Mean time between failures is recorded at 1,240 hours, showing increased reliability compared to previous periods. Maintenance compliance is at 93%, indicating that most scheduled maintenance activities are completed on time. Unplanned downtime is reduced to 156 hours, highlighting improved operational control. Maintenance cost per asset stands at 2.85K USD, showing cost efficiency improvements.
Asset age distribution highlights a large portion of assets in the 6–10 year range, indicating potential future maintenance demand. Failure risk concentration shows pumps and motors as the highest risk categories, requiring focused monitoring. The maintenance strategy mix reveals a higher share of preventive maintenance (62%), followed by corrective (26%) and breakdown maintenance (12%), indicating a proactive approach. Failure contribution analysis shows mechanical wear and electrical faults as major causes of failures. Asset utilization by plant location highlights variations across regions, helping identify underutilized or overburdened assets. This example demonstrates how the water treatment asset reliability monitoring dashboard helps improve asset performance and operational efficiency.
How to Analyze Data in a Water Purification Plant Asset Health Dashboard
Here is how you can analyze data from this dashboard:
- Monitor the asset health index to assess overall equipment condition
- Track assets in critical condition to prioritize maintenance actions
- Analyze mean time between failures (hrs) to evaluate asset reliability
- Evaluate maintenance compliance (%) to ensure scheduled maintenance execution
- Monitor unplanned downtime (hrs) to identify operational disruptions
- Track maintenance cost per asset (USD) to control maintenance expenses
- Analyze asset age distribution to plan asset replacement strategies
- Review failure risk by asset category to identify high-risk equipment
- Evaluate maintenance strategy mix to balance preventive and corrective actions
- Analyze failure contribution by root cause to address underlying issues
- Monitor asset utilization by plant location to optimize resource allocation
Benefits of Water Purification Plant Asset Health Dashboard
The following are the benefits of using this dashboard:
- Improves visibility into asset condition and performance
- Reduces unplanned downtime through proactive maintenance
- Enhances asset reliability and operational efficiency
- Optimizes maintenance costs and resource allocation
- Identifies high-risk assets and failure-prone equipment
- Supports preventive maintenance strategies
- Extends asset lifecycle and reduces replacement costs
- Enables data-driven maintenance planning
- Improves plant reliability and service continuity
- Supports efficient asset utilization across locations
KPIs to Track in Water Purification Plant Asset Health Dashboard
The following key KPIs can be tracked by using this dashboard:
- Asset Health Index – Measures overall condition of plant assets
- Assets in Critical Condition – Tracks number of high-risk assets requiring attention
- Mean Time Between Failures (hrs) – Indicates reliability of equipment
- Maintenance Compliance (%) – Measures completion of scheduled maintenance
- Unplanned Downtime (hrs) – Tracks unexpected operational interruptions
- Maintenance Cost per Asset (USD) – Measures cost efficiency of maintenance activities
Frequently Asked Questions
1. What is the purpose of an asset health dashboard in water treatment plants?
It provides visibility into equipment condition, helping utilities maintain reliability and reduce downtime.
2. How does this dashboard improve asset reliability?
The water purification asset health monitoring dashboard identifies high-risk assets and failure patterns, enabling preventive maintenance actions.
3. Why is the mean time between failures important?
It measures how frequently equipment fails, helping assess reliability and maintenance effectiveness.