
What is a Water Treatment and Purification Capacity Modernization Dashboard?
The Water Treatment and Purification Capacity Modernization Dashboard is a purpose-built analytics tool designed to support utility managers, infrastructure programme directors, and capital planning teams leading water treatment capacity modernization programmes across multiple facilities. It tracks key financial and operational metrics, including CapEx approvals, milestone completion rates, SCADA system upgrades, and regulatory compliance scores, giving stakeholders a unified picture of programme health.
By centralizing water purification cost performance alongside progress and compliance indicators, the dashboard helps teams identify budget deviations, capacity bottlenecks, and regulatory risks before they escalate. Municipal water authorities, regional utility boards, and infrastructure investment teams use it to maintain oversight across all phases of a modernization initiative.
How to Create a Water Treatment and Purification Capacity Modernization Dashboard
You don’t need to build your report from scratch—just start with a ready-to-use Water Treatment and Purification Capacity Modernization dashboard template from Mokkup. Add in your data and export it however you like. Here’s how to do it:
1. Create or Log in to Your Mokkup Account
Start by signing up on Mokkup.ai using your email. If you already have an account, just log in, and you'll be good to go.
2. Choose and Customize Your Dashboard Template
Find the Water Treatment and Purification Capacity Modernization Dashboard template in the Templates section. Use the drag-and-drop editor to adjust KPIs, edit filters, or add elements based on your data.
3. Export to Your BI Tool
Once your dashboard wireframe is ready, use the BI Tool Export feature to send it directly to Power BI or Tableau for further analysis and enhancements. You can also download the dashboard as a PDF, PNG, or JPEG, embed it on a platform, or invite your team to collaborate.
Note: This is a Pro template. You'll need a Pro subscription on Mokkup to use and customize this dashboard wireframe. Upgrade anytime to unlock full access.
Water Treatment and Purification Capacity Modernization Dashboard Example
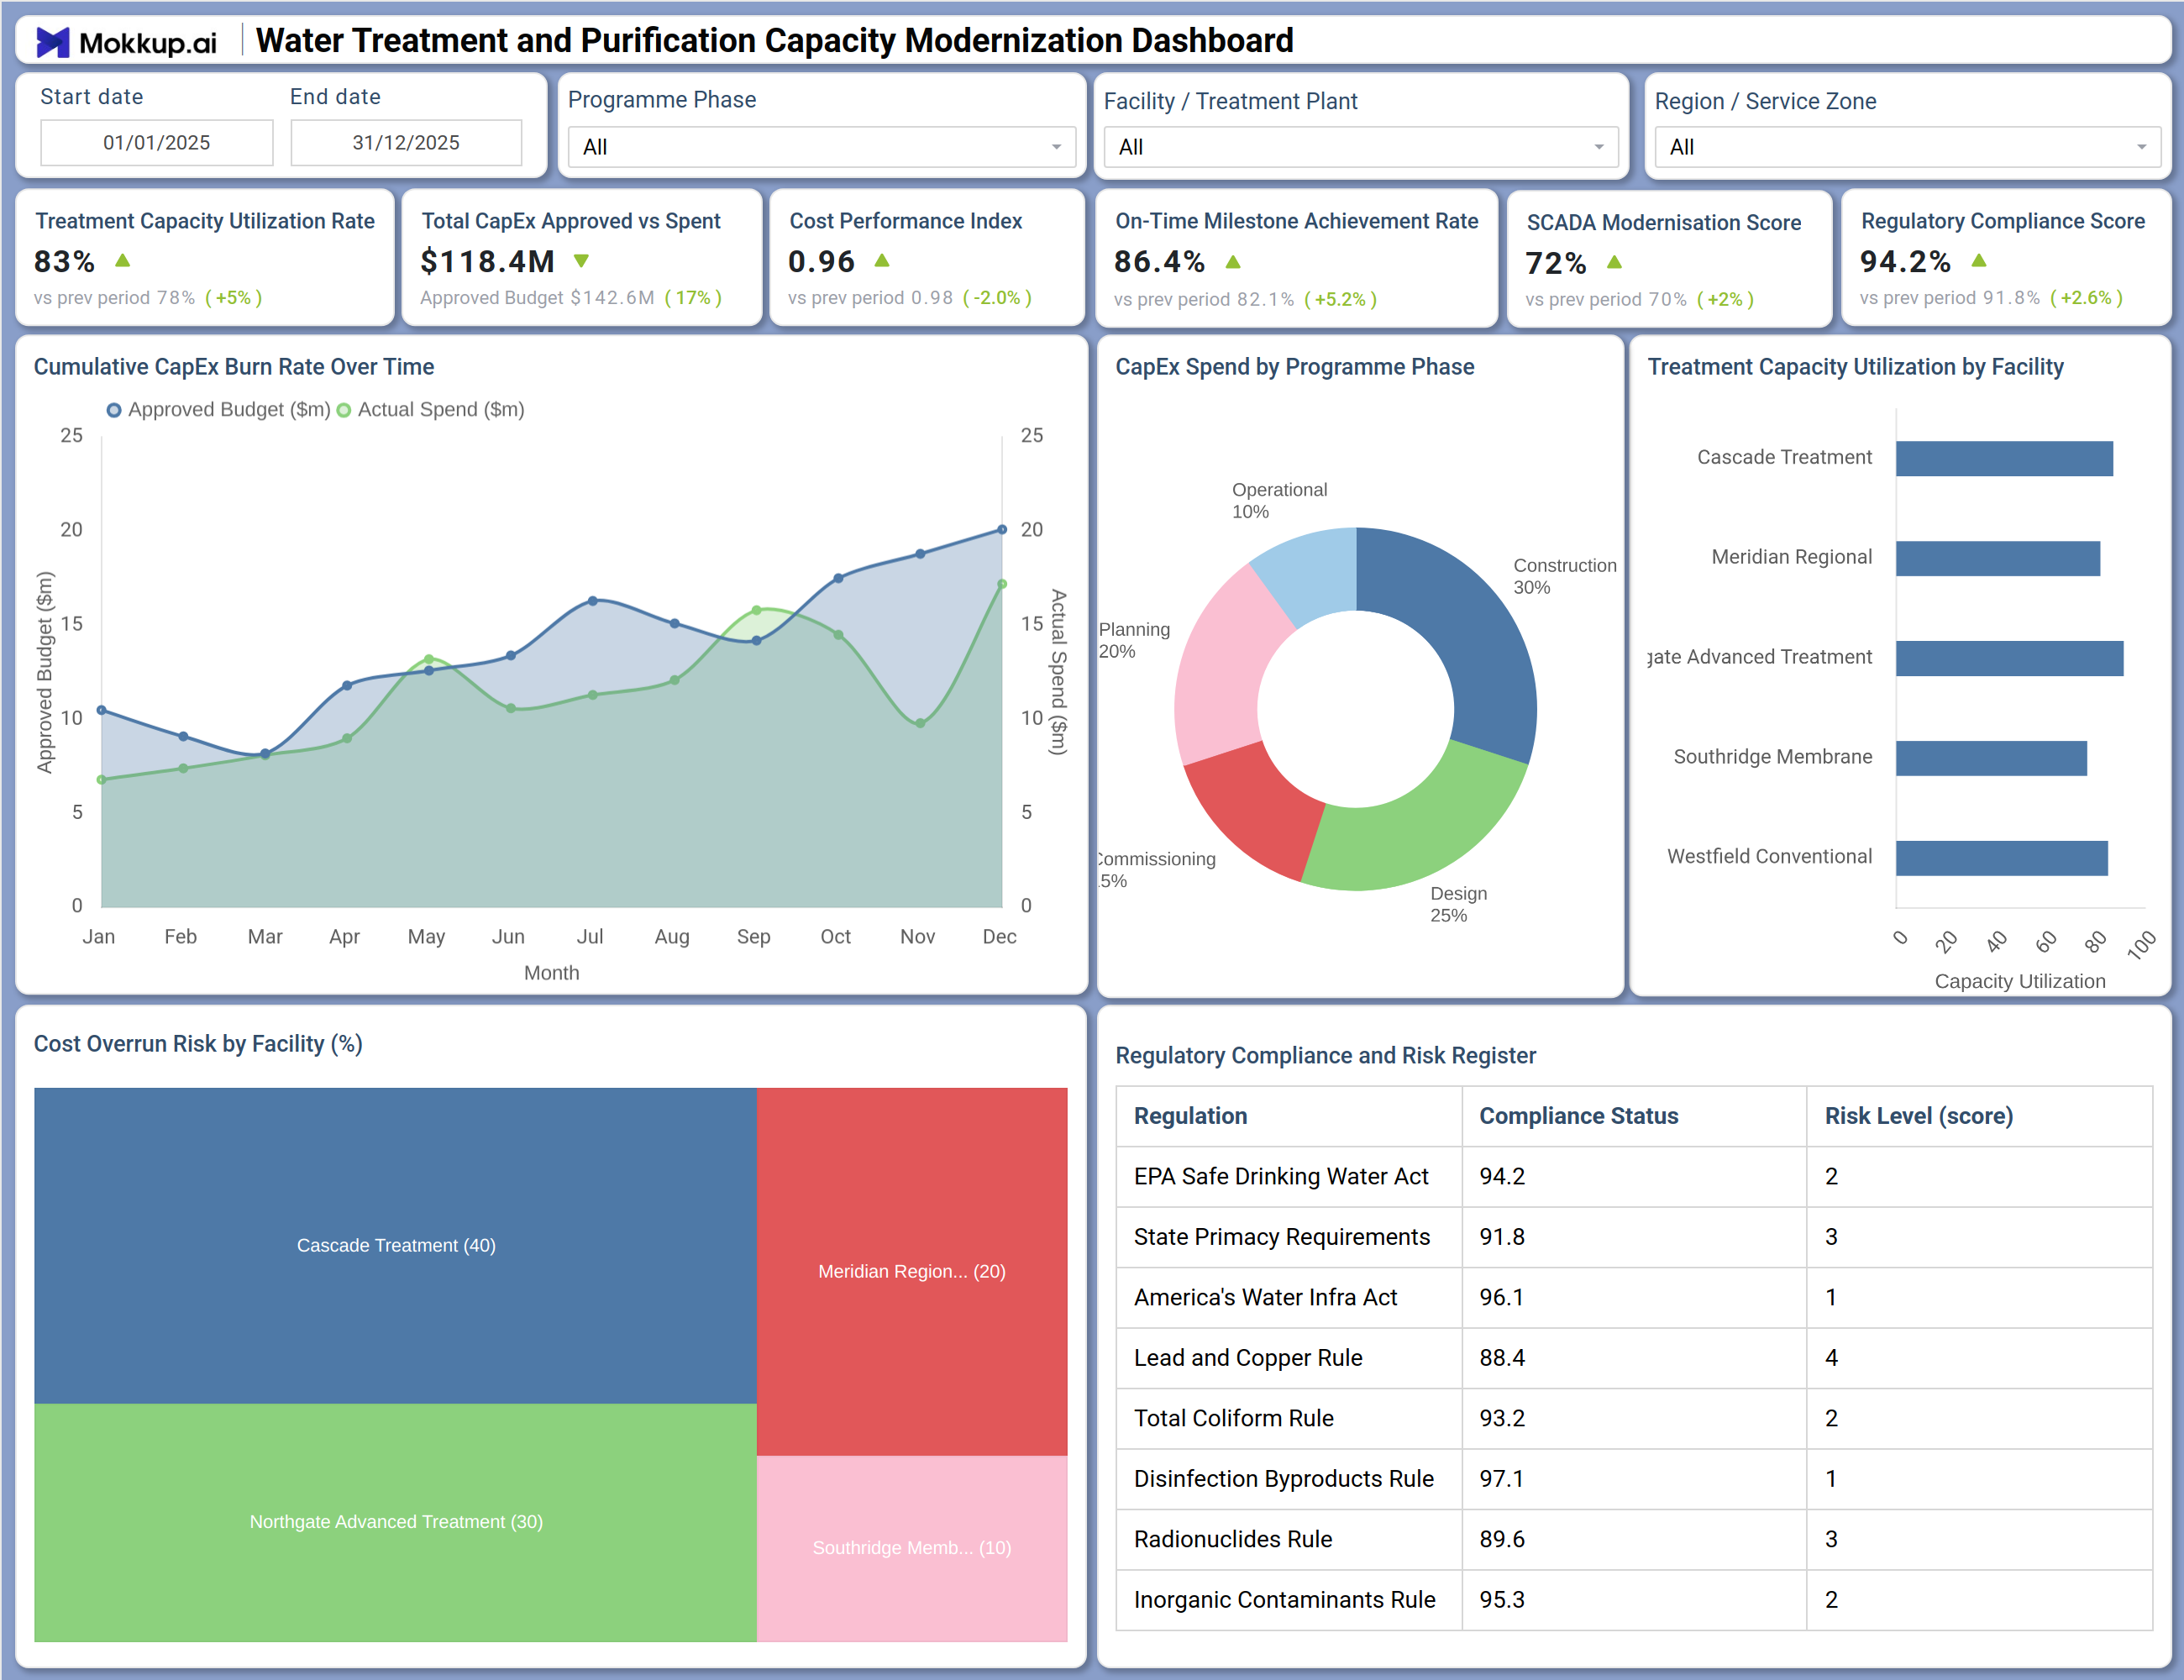
The dashboard opens with six KPI tiles benchmarked against prior-period values: Treatment Capacity Utilization Rate (83%), Total CapEx Approved vs Spent ($118.4M against a $142.6M approved budget), Cost Performance Index (0.96), On-Time Milestone Achievement Rate (86.4%), SCADA Modernisation Score (72%), and Regulatory Compliance Score (94.2%). Below the KPI row, the Cumulative CapEx Burn Rate Over Time line chart tracks Approved Budget ($m) against Actual Spend ($m) month by month across the full year. The CapEx Spend by Programme Phase donut chart visualizes capex spend programme phase allocations — Planning (20%), Design (25%), Construction (30%), Commissioning (5%), and Operational (10%) — while the Treatment Capacity Utilization by Facility horizontal bar chart ranks utilization across Cascade Treatment, Meridian Regional, Jate Advanced Treatment, Southridge Membrane, and Westfield Conventional.
The lower section includes a Cost Overrun Risk by Facility treemap highlighting exposure at Cascade Treatment (40%), Meridian Regional (20%), Northgate Advanced Treatment (30%), and Southridge Membrane (10%), alongside a Regulatory Compliance and Risk Register table that covers eight key regulations with compliance scores and risk level ratings.
How to Analyze Data in a Water Treatment and Purification Capacity Modernization Dashboard
Here is how you can analyze data from this dashboard:
- Phase-Based Analysis: Use the Programme Phase filter to isolate CapEx activity, milestone performance, and spend burn across Planning, Design, Construction, Commissioning, and Operational stages.
- CapEx Burn Monitoring: Monitor the Cumulative CapEx Burn Rate Over Time to detect early signs of budget overruns.
- Spend Allocation Review: Review CapEx Spend by Programme Phase to ensure balanced allocation aligned with project milestones.
- Capacity Utilization Analysis: Analyze Treatment Capacity Utilization by Facility to identify plants nearing or exceeding operational limits.
- Cost Overrun Risk Identification: Examine Cost Overrun Risk by Facility to prioritize sites with the highest financial exposure.
- Regulatory Risk Tracking: Use the Regulatory Compliance and Risk Register to flag high-risk regulations requiring immediate attention.
- Facility-Level Drilldown: Filter by Facility or Treatment Plant to focus on specific operational performance and compliance metrics.
- Digital Modernization Tracking: Track SCADA Modernization Score over time to measure progress in automation and infrastructure upgrades.
Benefits of a Water Treatment and Purification Capacity Modernization Dashboard
The following are the benefits of using this dashboard:
- Centralized Programme Visibility: Consolidates CapEx, milestone tracking, and facility utilization into a single view.
- Phase-Wise Monitoring: Supports tracking across all programme phases simultaneously.
- Reduced Manual Reporting: Minimizes effort with pre-built KPI tracking and visualization templates.
- Digital Upgrade Insights: Enables facility-level analysis of SCADA modernization progress.
- Cost Risk Management: Identifies and prioritizes facilities with high cost overrun risk.
- Regulatory Compliance Tracking: Supports monitoring across multiple regulatory frameworks.
- Improved Decision-Making: Provides a unified view for planners, managers, and stakeholders.
KPIs to Track in a Water Treatment and Purification Capacity Modernization Dashboard
The following key KPIs can be tracked by using this dashboard:
- Treatment Capacity Utilization Rate (%): This treatment capacity utilization rate metric measures how effectively each facility's rated capacity is being used relative to current demand — essential for detecting infrastructure strain and planning expansion timelines.
- Total CapEx Approved vs Spent ($M): Tracks budget allocation against actual expenditure — currently $118.4M spent against an approved budget of $142.6M — providing immediate financial oversight across all programme phases.
- Cost Performance Index: Quantifies budget efficiency at 0.96, supporting water purification cost performance controls by flagging when actual spending deviates unfavorably from the planned cost baseline.
- On-Time Milestone Achievement Rate (%): Measures the percentage of programme milestones completed on schedule — key to monitoring SCADA modernization water facility rollout timelines and construction phase progress.
- SCADA Modernisation Score (%): Evaluates digital systems upgrade progress against modernization targets — tracking automation adoption at 72% across all programme phases and treatment facilities.
- Regulatory Compliance Score (%): Tracks overall regulatory standing across frameworks including EPA Safe Drinking Water Act, Lead and Copper Rule, Radionuclides Rule, and Disinfection Byproducts Rule.
Frequently Asked Questions
Q1. What teams use a Water Treatment and Purification Capacity Modernization Dashboard?
Municipal water utility managers, infrastructure programme directors, regulatory affairs teams, and capital planning departments use this dashboard to oversee treatment capacity upgrades, CapEx burn rates, SCADA progress, and compliance standing across facilities.
Q2. How does this dashboard improve infrastructure investment decisions?
By combining the Cumulative CapEx Burn Rate Over Time chart, the Cost Overrun Risk by Facility treemap, and the Treatment Capacity Utilization by Facility bar chart, investment teams get a multi-dimensional view of where funds are effectively deployed and where overruns are developing — enabling proactive reallocation decisions.
Q3. Can this dashboard track regulatory compliance across multiple frameworks simultaneously?
Yes. The Regulatory Compliance and Risk Register table monitors eight regulations — including EPA Safe Drinking Water Act, State Primacy Requirements, Lead and Copper Rule, and Disinfection Byproducts Rule — with individual compliance scores and risk level ratings so teams can prioritize remediation efforts.
Q4. How does the CapEx Spend by Programme Phase chart work?
This donut chart breaks total CapEx expenditure into five programme phases: Planning (20%), Design (25%), Construction (30%), Commissioning (5%), and Operational (10%). It helps programme managers quickly see which phase is consuming the most capital and whether allocations align with the overall project plan.
Q5. What does the SCADA Modernisation Score measure?
The SCADA Modernisation Score is a percentage metric tracking progress in upgrading Supervisory Control and Data Acquisition systems across treatment facilities. It matters because a higher treatment capacity utilization rate is closely tied to the reliability and automation level of SCADA infrastructure — making this score a leading indicator of long-term operational efficiency.