What is a Water Purification Offtake & Revenue Performance Dashboard?
A water purification revenue tracking dashboard gives utility managers and contract administrators a consolidated view of how bulk water contracts are performing against commercial targets. It monitors key metrics, including bulk water revenue, active contract counts, volume fulfillment, and contract fulfillment rate by zone all in one structured view.
Revenue efficiency indicators such as revenue per megalitre sit alongside non-revenue water volume loss, enabling teams to assess both pricing performance and operational waste simultaneously. Municipal utilities, industrial water buyers, and agricultural irrigation operators use this template to make informed decisions about contract management, geographic performance gaps, and water source strategy.
How to Create a Water Purification Offtake & Revenue Performance Dashboard
You don’t need to build your report from scratch, just start with a ready-to-use Water Purification Offtake & Revenue Performance dashboard template from Mokkup. Add in your data and export it however you like. Here’s how to do it:
1. Create or Log in to Your Mokkup Account
Start by signing up on Mokkup.ai using your email. If you already have an account, just log in, and you'll be good to go.
2. Choose and Customize Your Dashboard Template
Find the Water Purification Offtake & Revenue Performance Dashboard template in the Templates section. Use the drag and drop editor to adjust KPIs, edit filters, or add elements based on your data.
3. Export to Your BI Tool
Once your dashboard wireframe is ready, use the BI Tool Export feature to send it directly to Power BI or Tableau for further analysis and enhancements. You can also download the dashboard as a PDF, PNG, or JPEG, embed it on a platform, or invite your team to collaborate.
Note: This is a Pro template. You'll need a Pro subscription on Mokkup to use and customize this dashboard wireframe. Upgrade anytime to unlock full access.
Water Purification Offtake & Revenue Performance Dashboard Example
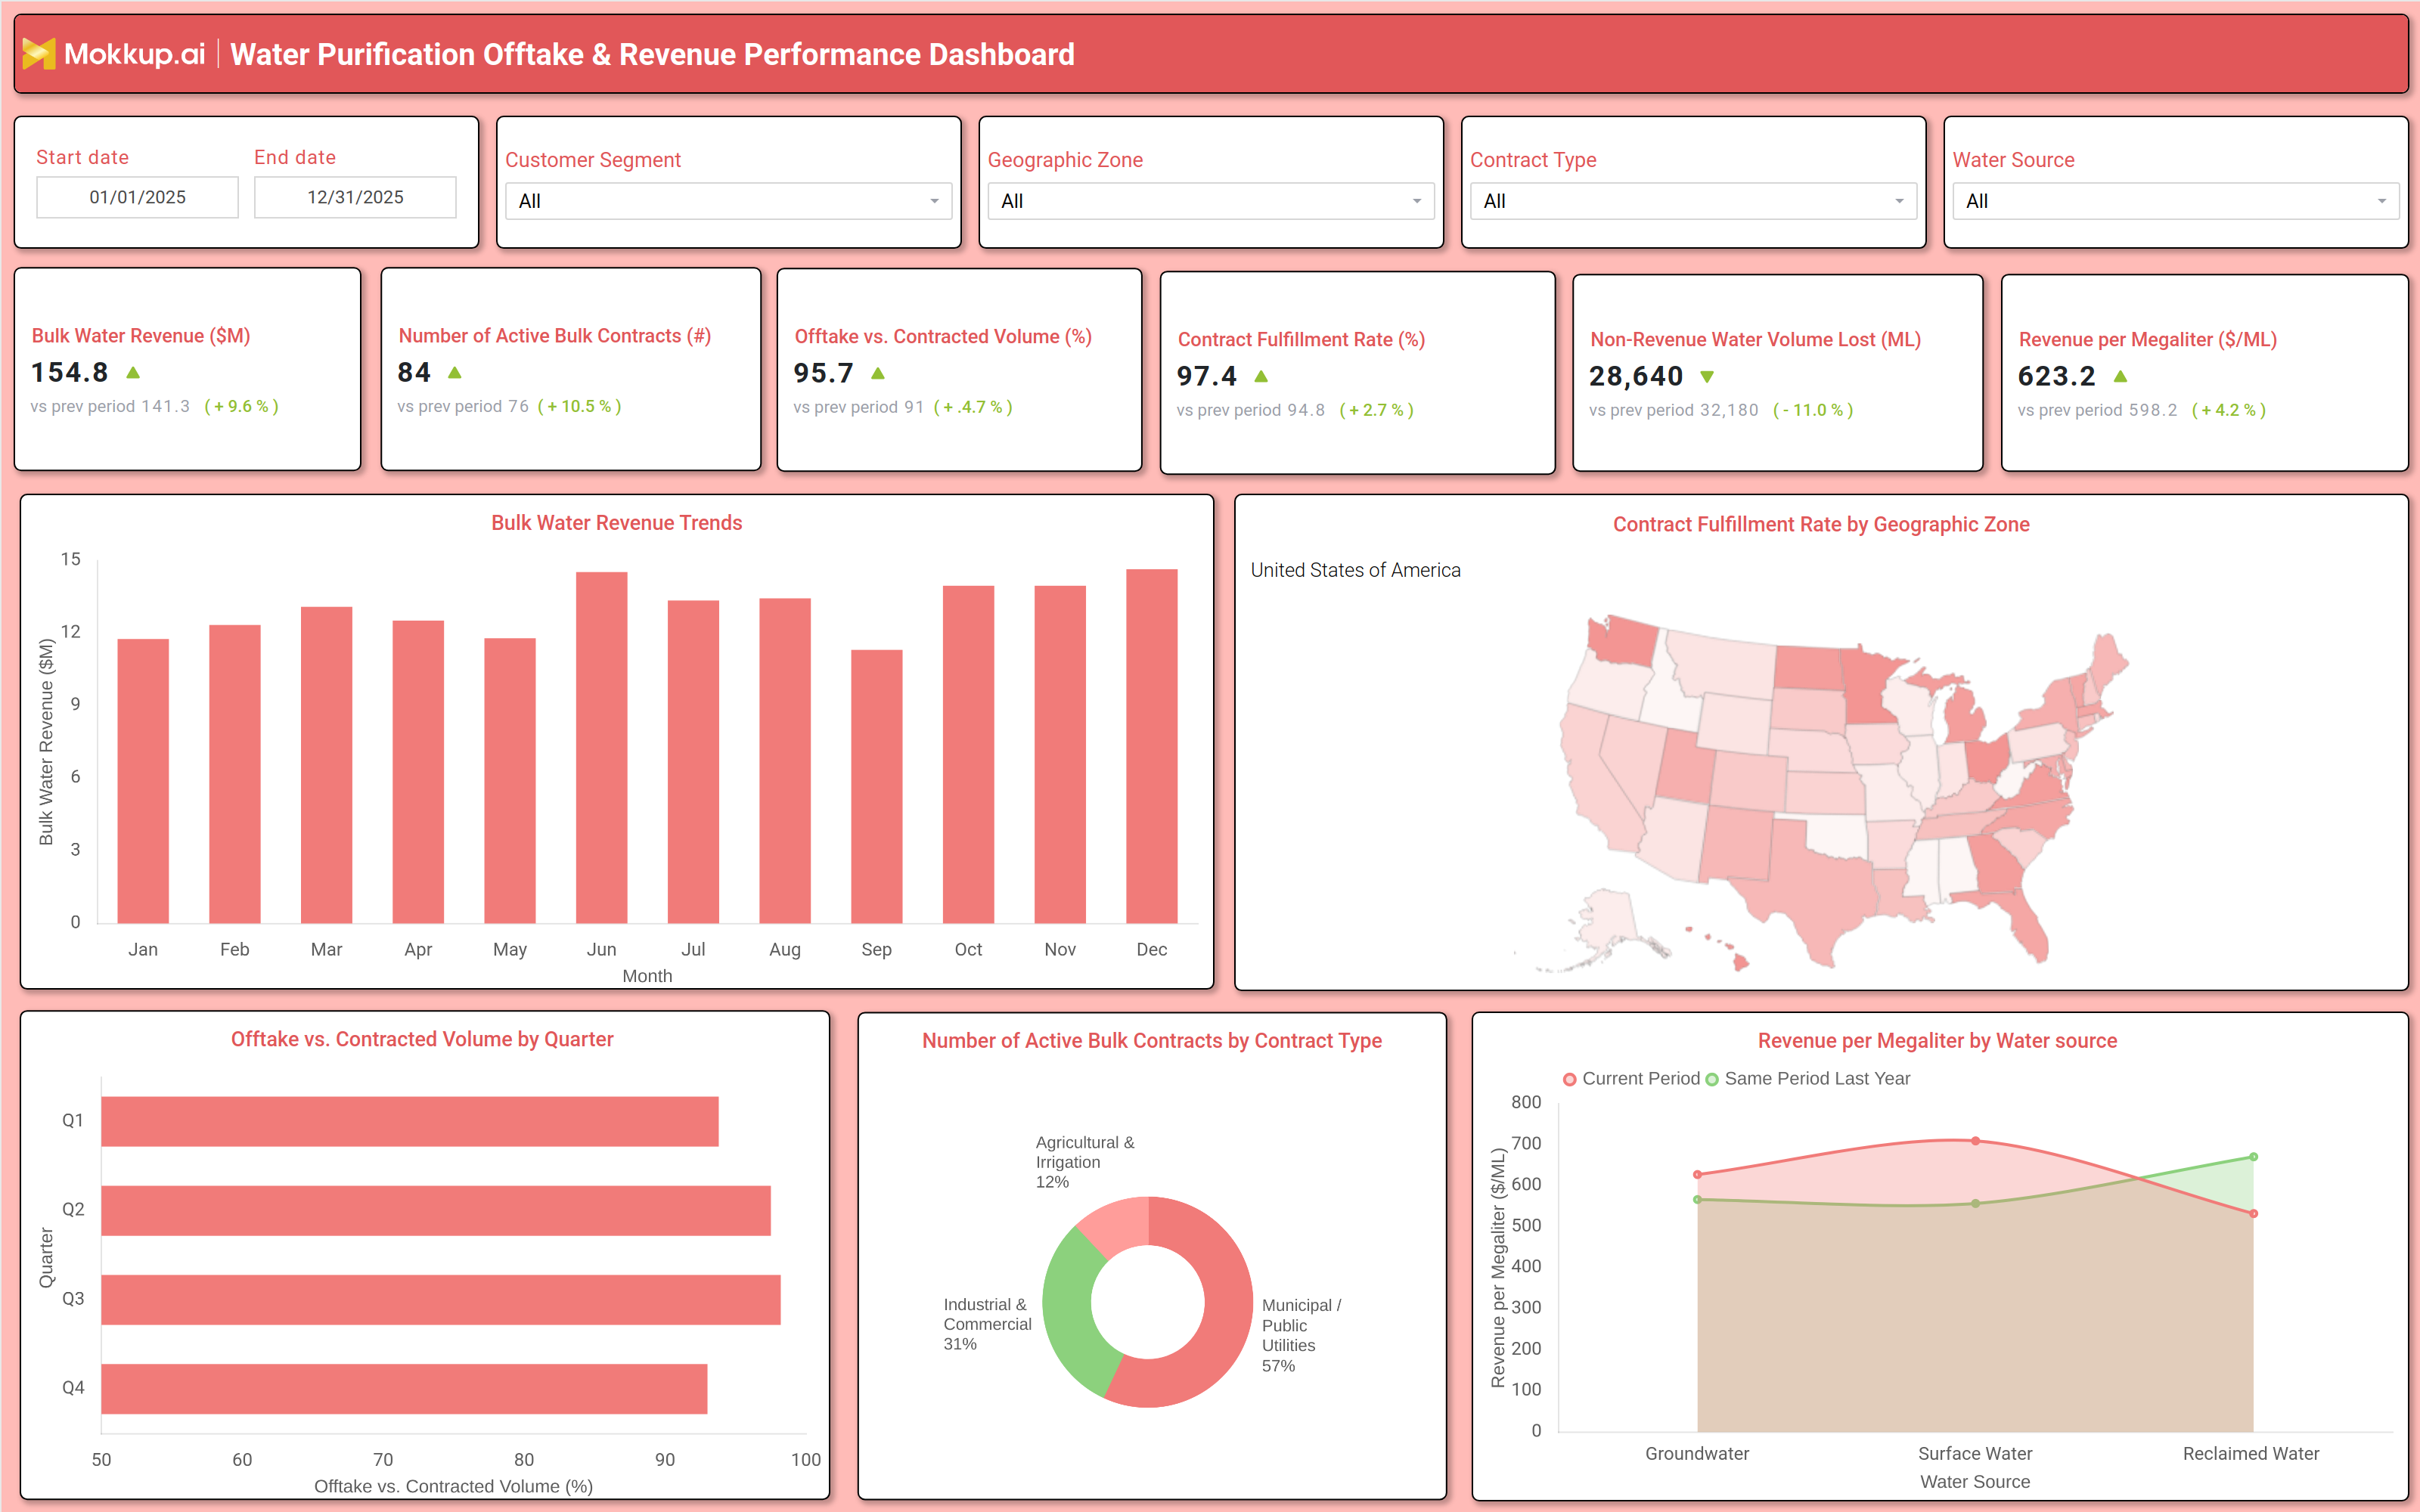
A utility revenue team typically opens this dashboard at the start of each reporting cycle to assess whether bulk water contract performance monitoring goals are being achieved across the full portfolio. The six KPI tiles at the top provide an immediate commercial snapshot of whether revenue is growing period over period, whether contracts are being honored at target fulfillment rates, and whether volume losses are being brought under control. When any of these indicators signals a concern, managers can apply the Customer Segment or Geographic Zone filters to narrow the view and isolate which part of the business is dragging performance. Moving deeper into the analysis, planners use the quarterly chart to conduct offtake vs contracted volume analysis examining whether actual water deliveries are consistently meeting contractual commitments quarter by quarter or if specific periods are falling short.
This view is often where renegotiation conversations begin. At the same time, the contract type donut chart helps leadership assess portfolio concentration, checking whether exposure to municipal, industrial, or agricultural segments aligns with the organization's risk appetite and growth strategy. Finally, the revenue per megaliter comparison across water source types gives pricing teams a grounded basis for evaluating whether groundwater, surface water, and reclaimed water are each generating returns proportionate to their treatment and delivery costs. Combined with the geographic fulfillment map, teams can build a complete picture of where the business is performing well and where targeted intervention, operational, commercial, or infrastructural, will have the greatest impact.
How to Analyze Data in a Water Purification Offtake & Revenue Performance Dashboard
Here is how you can analyze data from this dashboard:
- Filter by Customer Segment: Analyze performance for municipal, industrial, or agricultural buyers separately.
- Track Revenue Trends: Review bulk water revenue trends to identify dips and investigate causes.
- Monitor Fulfillment Rates: Use the KPI tile to detect declining contract fulfillment early.
- Compare Offtake vs Contracted Volume: Identify quarters with recurring delivery shortfalls.
- Assess Regional Performance: Use the geographic map to find regions with weaker fulfillment rates.
- Review Contract Mix: Analyze active contracts by type to identify portfolio concentration risks.
- Evaluate Revenue by Water Source: Filter by source type to compare revenue efficiency and cost alignment.
- Track Water Loss: Monitor non-revenue water volume trends to support maintenance planning.
Benefits of a Water Purification Offtake & Revenue Performance Dashboard
The following are the benefits of using this dashboard:
- Centralized Revenue Visibility: Combines revenue, fulfillment, and offtake metrics in one dashboard.
- Comprehensive Contract Monitoring: Tracks performance across regions, contract types, and water sources.
- Reduced Reporting Effort: Prebuilt KPIs and charts simplify quarterly contract reviews.
- Infrastructure Planning Insights: Supports regional analysis of non-revenue water loss.
- Operational Efficiency Tracking: Highlights quarterly fulfillment performance across contracts.
- Improved Compliance Management: Helps teams stay aligned with contract obligations.
- Shared Commercial Visibility: Gives operations and commercial teams a unified view of delivery and revenue performance.
KPIs to Track in a Water Purification Offtake & Revenue Performance Dashboard
The following key KPIs can be tracked by using this dashboard:
- Bulk Water Revenue ($M): At the core of any water purification revenue tracking dashboard measures total invoiced revenue from contracted bulk water deliveries and tracks period over period commercial growth.
- Number of Active Bulk Contracts (#): Tracks the total count of active customer contracts across all segments key to understanding portfolio growth, churn, and concentration risk.
- Offtake vs. Contracted Volume (%): Quantifies how closely actual water volume delivered matches contractual commitments, the primary metric for offtake vs contracted volume analysis and compliance review.
- Contract Fulfillment Rate (%): Measures the percentage of contracts meeting their delivery obligations central to contract fulfillment rate by zone evaluations and regulatory reporting.
- Non-Revenue Water Volume Lost (ML): Evaluates treated water volume lost before billing due to leakage, metering errors, or unauthorized use the leading indicator for non-revenue water loss reduction programs.
- Revenue per Megaliter ($/ML): Tracks water utility revenue per megaliter across groundwater, surface water, and reclaimed water sources enabling source level pricing efficiency benchmarking period over period.
Frequently Asked Questions
Q1. What teams use a Water Purification Offtake & Revenue Performance Dashboard?
This dashboard is used by utility revenue managers, bulk water contract administrators, network operations and loss control teams, and executive leadership overseeing commercial water performance.
Q2. How does this dashboard improve contract compliance and revenue recovery?
By surfacing the Contract Fulfillment Rate and Offtake vs. Contracted Volume metrics at a glance, teams can identify fulfillment gaps early and act before shortfalls compound into contractual breaches or revenue losses.
Q3. Can this dashboard track performance differences by water source type?
Yes, the Revenue per Megaliter by Water Source chart compares current period and prior period revenue efficiency across groundwater, surface water, and reclaimed water, enabling source level pricing and cost analysis.