
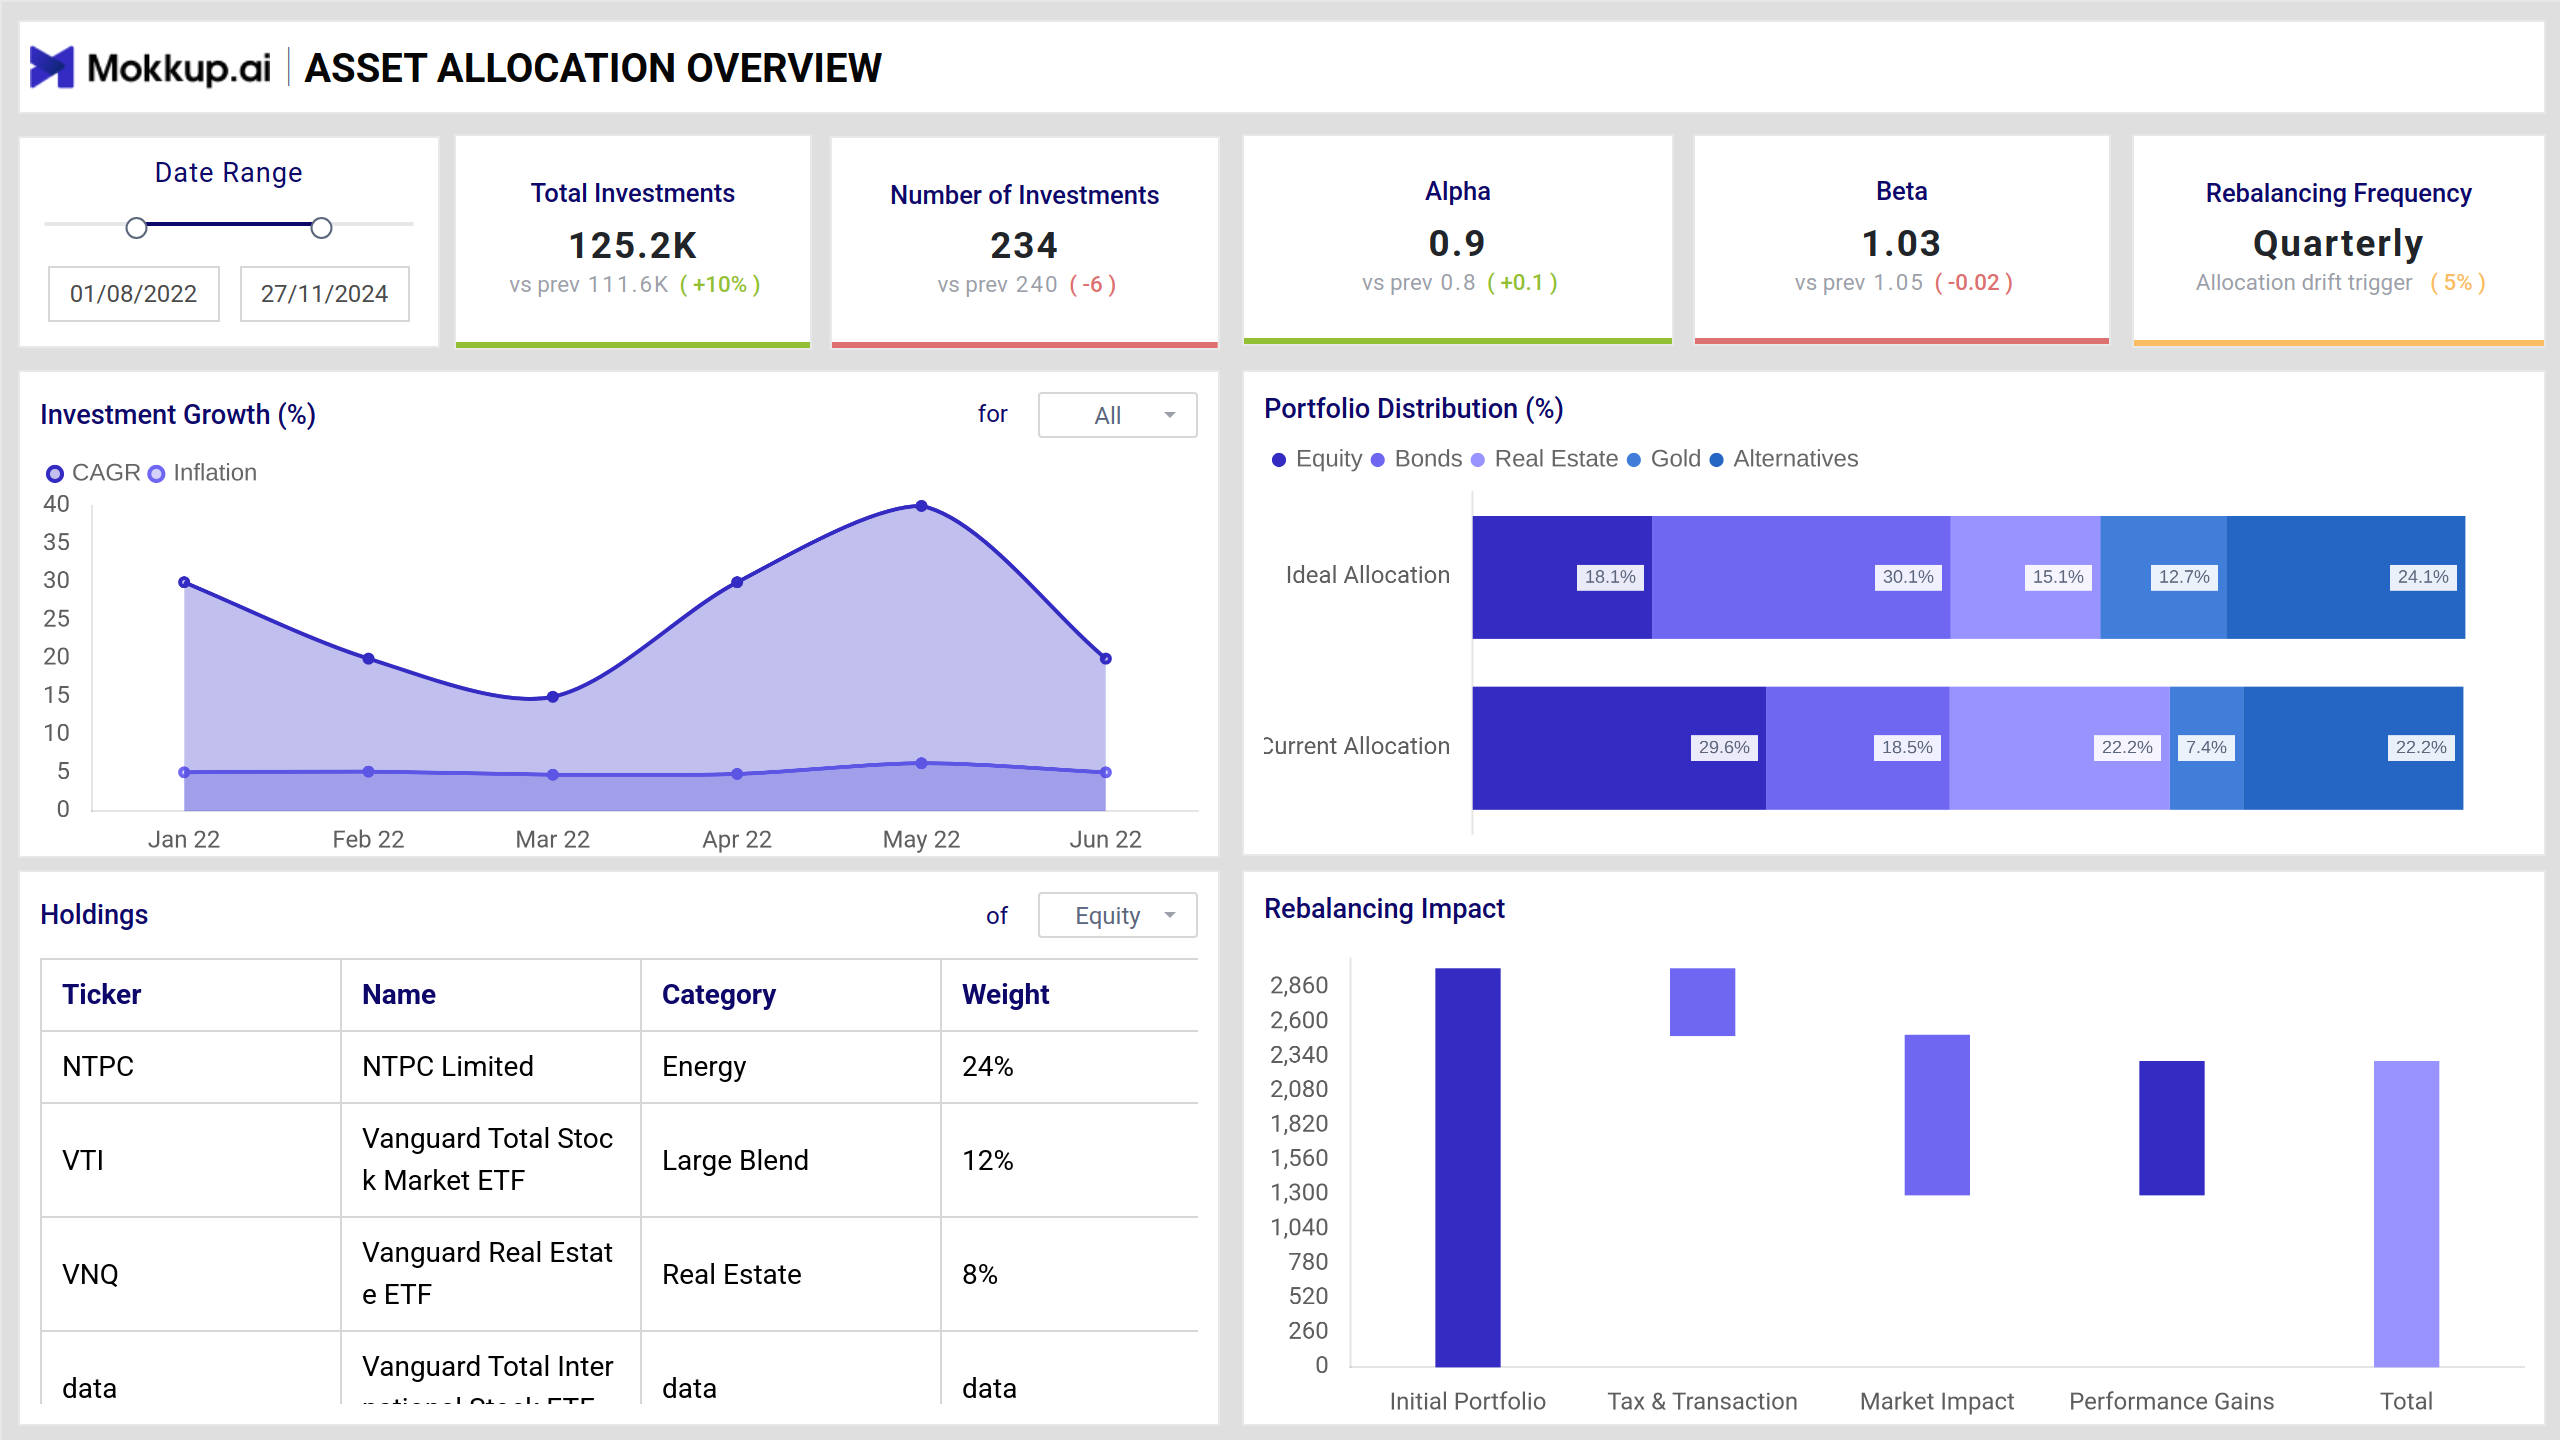
The portfolio management dashboard gives investors a bird’s eye view of financial performance through the visibility of investments. The tool allows you to measure, optimize, and track the performance trends and current ROI for making crucial strategic decisions instantaneously. With this customizable dashboard wireframe, you can jot down critical information professionally without having to sift through complex reports. You can get up-to-date insights into how your assets are performing and identify the risk by comparing it with market trends.
Asset Allocation Overview
This is an asset allocation dashboard that provides an understanding of investment distribution across multiple assets, allowing one to analyze the rate of return and investment growth over a period of time. All you need to do is filter the data range, and you will see the diversification of assets or holdings along with the category and weight. With a bar chart for rebalancing assets, you can step towards portfolio optimization by balancing risky investments with safer investments.
Key Terms to Know:
- Alpha & Beta: These are metrics used by project managers or investors to analyze how well a fund is performing in relation to market conditions.
- Rebalancing Frequency: The frequency at which you attempt to rebalance your portfolio, including your risk tolerance and volatility.
- Asset Class: It involves grouping assets or investments with similar features or belonging to the same category, and laws and regulations must be applicable.
- Investment Growth: This is the increase in the value of your portfolio over time.
- Portfolio Distribution: It refers to allocating assets to different asset classes or sectors for balancing risks and returns.
- Rebalancing Impact: It is adjusting asset allocation to target proportions to minimize risks by buying or selling investments.
Equity Asset Allocation
This wireframe dashboard template covers all essential metrics, including PE ratio, Sharpe ratio, and average position size, for measuring equity investments. Consider it a vital portfolio analysis tool to examine risks and ensure mindful diversification of all assets.
Key Terms to Know
- Portfolio Volatility: Also known as standard deviation, portfolio volatility is the measure of riskiness of the investments.
- Sharpe Ratio: A metric investors use to identify the return on investment against the risk involved in the project.
- Average PE Ratio: The average price-to-earning ratio is the prediction of a company's future performance.
- Average P/B Ratio: This is the average price-to-book ratio, which measures the company's market value in relation to its book value.
- Average Dividend Yield: This financial metric indicates the average annual dividend income an investor can expect from a stock group.
Bond Asset Allocation
This wealth management dashboard template involves key indicators for optimizing and managing the brand portfolio. It is an interactive and visual representation of different investments on bonds and assets. The dashboard shows the breakdown of the allocation by industry and geography to identify the total return, historical performance, and income generated.
Key Terms to Know:
- Average Credit Rating Score: This score defines the creditworthiness of the brand portfolio based on the ratings provided by credit rating agencies.
- Weighted Average Duration: This metric is used in the portfolio analysis tools for assessing the average time period that a company portfolio would take to repay its debts.
- Average Bond Allocation: This means the average proportion of investment funds allocated to bonds depending upon risk tolerance and time horizon.
- Average Yield-to-Maturity: This is a key metric used for comparing bonds, in which the average return on bonds is analyzed when they reach maturity.
- Average Price-to-Par Ratio: APP ratio measures the relationship between the current market price and the par value of a bond.
- Average Coupon Yield: It assesses the overall yield of the brand portfolio after considering the different coupon rates and sizes.
Dashboard Insights
- It is a Portfolio Performance Tracking dashboard that allows investors to monitor market movements in relation to a company's performance and make informed decisions.
- With easy access to key KPIs, you can spot areas of improvement and ensure optimized returns.
- When the bonds and stock assets are diversified into categories like regions, industries, or sectors, it signifies the importance of giving less priority to over-concentrated areas.
- You can customize this template to focus on specific assets or time periods to get a tailored view of the company's financial performance.
- This template allows you to collaborate with multiple stakeholders so that they can share the updates on the same dashboard.
Conclusion
This Investment Portfolio Management dashboard gives you the opportunity to dive deeper into investment performance so that you can better plan your finances. Depending on your short-term or long-term financial goals, you can adjust your strategy by rebalancing it to align with investment objectives.