
What is a Water Purification Energy & Carbon Performance Dashboard?
A water purification energy consumption dashboard gives sustainability managers, plant operators, and environmental compliance teams a consolidated view of how energy use, carbon output, and chemical consumption are trending across treatment facilities. It tracks KPIs including total energy consumption, scope 1 CO₂ emissions, energy intensity, and carbon intensity giving leadership a clear picture of the water treatment plant carbon footprint across their entire operations.
Chemical usage volumes and treated water throughput sit alongside these environmental metrics, enabling teams to assess efficiency gains in the context of growing production volumes. Municipal utilities, regional treatment authorities, and industrial water processors use this template to manage sustainability performance, demonstrate regulatory compliance, and identify where operational improvements will have the greatest environmental impact.
How to Create a Water Purification Energy & Carbon Performance Dashboard
You don’t need to build your report from scratch—just start with a ready-to-use Water Purification Energy & Carbon Performance dashboard template from Mokkup. Add in your data and export it however you like. Here’s how to do it:
1. Create or Log in to Your Mokkup Account
Start by signing up on Mokkup.ai using your email. If you already have an account, just log in, and you'll be good to go.
2. Choose and Customize Your Dashboard Template
Find the Water Purification Energy & Carbon Performance Dashboard template in the Templates section. Use the drag and drop editor to adjust KPIs, edit filters, or add elements based on your data.
3. Export to Your BI Tool
Once your dashboard wireframe is ready, use the BI Tool Export feature to send it directly to Power BI or Tableau for further analysis and enhancements. You can also download the dashboard as a PDF, PNG, or JPEG, embed it on a platform, or invite your team to collaborate.
Note: This is a Pro template. You'll need a Pro subscription on Mokkup to use and customize this dashboard wireframe. Upgrade anytime to unlock full access.
Water Purification Energy & Carbon Performance Dashboard Example
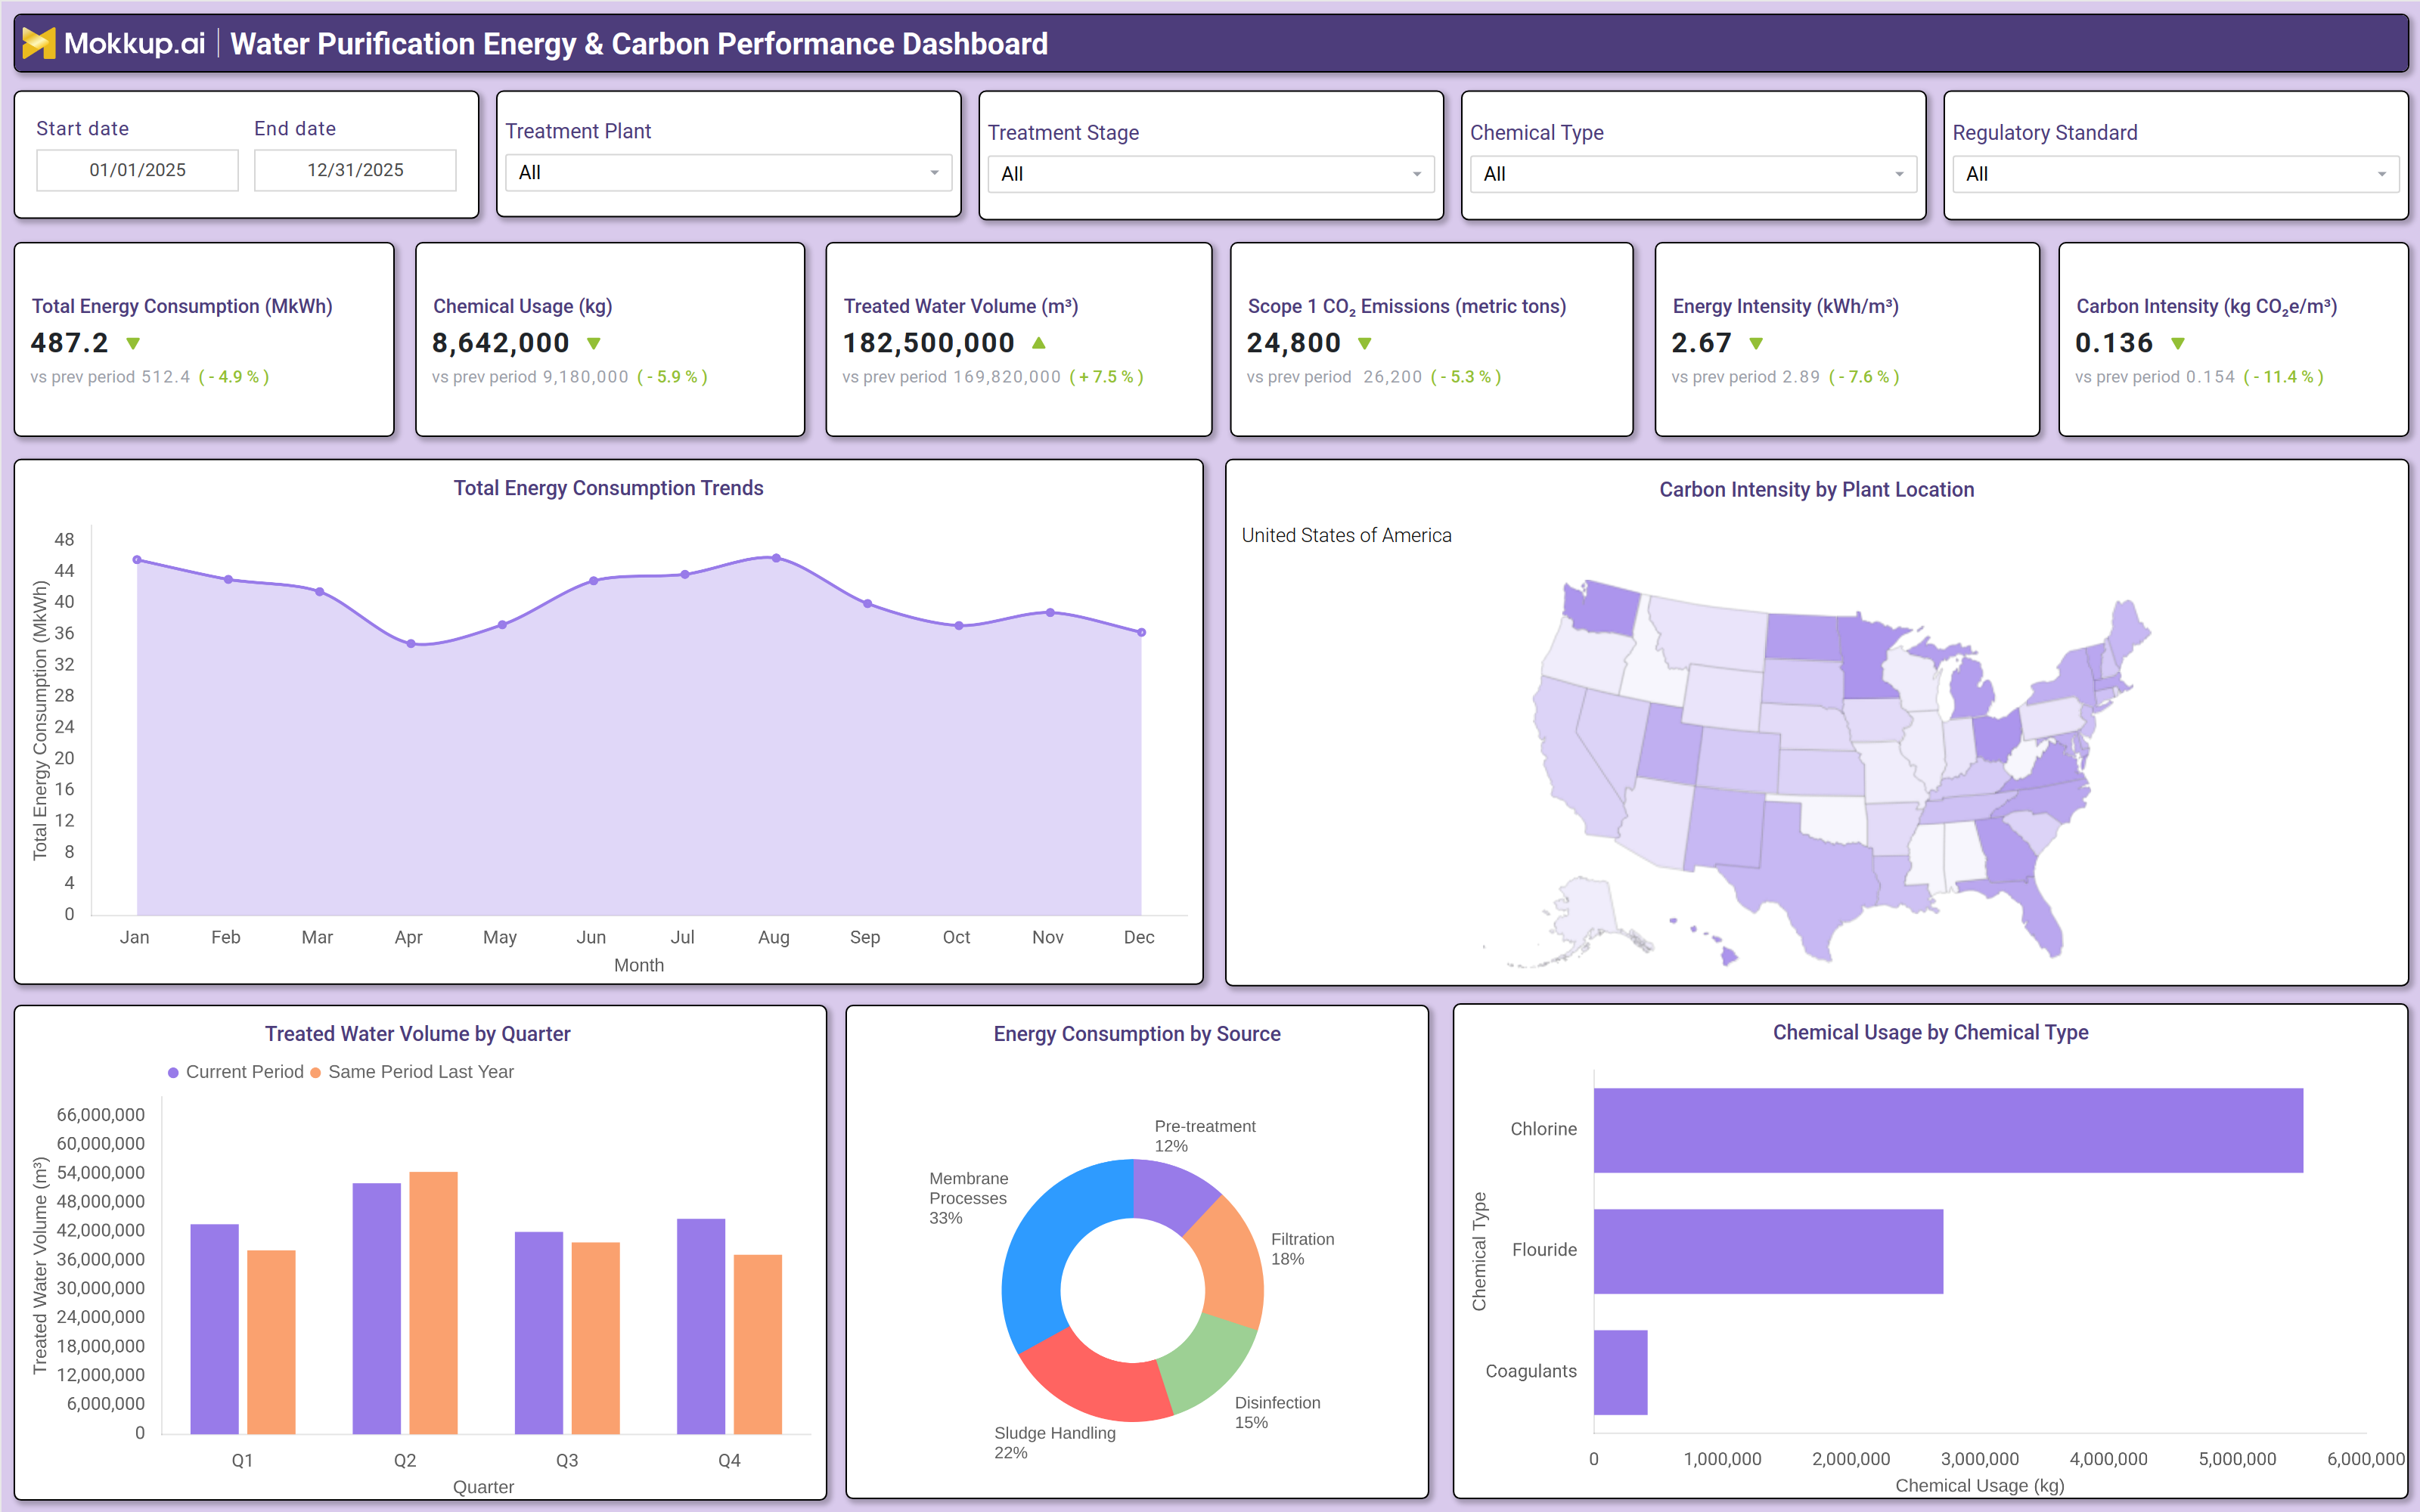
A sustainability manager at a regional water utility opens this dashboard at the start of each reporting period to assess whether carbon intensity water treatment monitoring targets are trending in the right direction. The KPI tiles at the top give an immediate read on energy and emissions performance, whether total energy consumption is decreasing relative to the prior period, whether scope 1 emissions are tracking below baseline, and whether energy and carbon intensity per unit of water treated are improving. When a KPI signals concern, the Treatment Plant and Treatment Stage filters allow the manager to isolate which facility or process step is driving the variance before escalating to operations teams. Plant engineers and process managers use the bottom half of the dashboard to analyze where energy is being consumed and how chemical inputs are distributed. The energy source breakdown by treatment stage reveals whether high consumption processes, such as membrane filtration or sludge handling are operating as expected or drawing disproportionate power relative to throughput.
For energy intensity per cubic meter tracking, managers cross-reference the Energy Intensity KPI with the quarterly treated water volume trend to determine whether improvements are driven by genuine efficiency gains or by a temporary increase in throughput diluting the ratio. Energy and environmental leads review the geographic map to understand which plant locations are generating the highest carbon intensity, enabling regional prioritization of decarbonization investments. The chemical usage breakdown helps procurement and operations teams assess whether specific chemical categories chlorine, fluoride, or coagulants are being consumed at rates aligned with treatment volumes, supporting chemical usage optimization, water treatment programs and overall cost compliance across the facility portfolio.
How to Analyze Data in a Water Purification Energy & Carbon Performance Dashboard
Here is how you can analyze data from this dashboard:
- Filter by Treatment Plant: Compare energy and carbon performance across facilities.
- Track Energy Consumption Trends: Identify months with unusual energy spikes and investigate causes.
- Monitor Energy Intensity: Review energy use per cubic meter to measure efficiency improvements.
- Compare Water Throughput: Analyze treated water volume trends against prior-year performance.
- Assess Carbon Intensity: Use the plant location map to identify high-emission facilities.
- Review Energy by Process: Analyze energy consumption by treatment stage to find optimization opportunities.
- Track Chemical Usage: Filter by chemical type to align usage trends with production growth.
- Measure Emissions Progress: Monitor Scope 1 CO₂ emissions against sustainability targets.
Benefits of a Water Purification Energy & Carbon Performance Dashboard
The following are the benefits of using this dashboard:
- Centralized Sustainability View: Combines energy, emissions, and chemical usage metrics in one dashboard.
- Comprehensive Carbon Monitoring: Tracks carbon intensity across plants and treatment stages.
- Reduced Reporting Effort: Prebuilt KPIs and charts simplify sustainability reporting.
- Plant-Level Performance Insights: Supports emissions reduction and process improvement decisions.
- Operational Efficiency Planning: Highlights energy-intensive treatment stages for optimization.
- Regulatory Alignment: Helps teams meet environmental reporting requirements efficiently.
- Shared Performance Visibility: Aligns engineers, sustainability teams, and leadership around energy and carbon goals.
KPIs to Track in a Water Purification Energy & Carbon Performance Dashboard
The following key KPIs can be tracked by using this dashboard:
- Total Energy Consumption (MWh): At the core of any water purification energy consumption dashboard measures the total energy consumed across all treatment plants and processes in the reporting period.
- Chemical Usage (kg): Tracks total chemical inputs consumed across all treatment stages essential for chemical usage optimization, water treatment programs and chemical cost management.
- Treated Water Volume (m³): Quantifies the total volume of water processed and treated the denominator for energy intensity per cubic meter tracking and the benchmark for all efficiency ratios.
- Scope 1 CO₂ Emissions (metric tons): Measures direct greenhouse gas emissions generated by on site combustion and process activity, the primary metric for scope 1 emissions reduction water utility compliance and sustainability reporting.
- Energy Intensity (kWh/m³): Evaluates how much energy is consumed per cubic meter of water treated the key operational efficiency ratio supporting water treatment plant carbon footprint improvement programs.
- Carbon Intensity (kg CO₂e/m³): Tracks greenhouse gas emissions generated per cubic meter of treated water enabling cross facility benchmarking of environmental performance and informing the water treatment plant carbon footprint reduction strategy.
Frequently Asked Questions
Q1. What teams use a Water Purification Energy & Carbon Performance Dashboard?
This dashboard is used by sustainability managers, plant operations teams, environmental compliance officers, and executive leadership responsible for energy efficiency and emissions performance at water treatment facilities.
Q2. How does this dashboard improve energy efficiency and emissions reporting?
By surfacing energy intensity, carbon intensity, and scope 1 emissions KPIs alongside monthly trend charts and plant level maps, teams can identify underperforming facilities, track efficiency improvements, and produce audit ready sustainability reports without manual aggregation.
Q3. Can this dashboard track energy consumption broken down by treatment stage?
Yes, the Energy Consumption by Source donut chart breaks down total energy use across membrane processes, sludge handling, disinfection, filtration, and pretreatment stages, enabling targeted process optimization.