
What is a Natural Gas Retail Sustainability & Environmental Impact Dashboard?
A Natural Gas Retail Sustainability & Environmental Impact Dashboard is a data-driven analytics tool designed to help gas utilities, retailers, and energy providers monitor, measure, and optimize their environmental performance. This dashboard consolidates key sustainability metrics such as methane emissions, renewable natural gas (RNG) adoption, carbon footprint reduction, and leak detection into a single, interactive interface. By tracking these metrics, companies can assess their progress toward sustainability goals, ensure regulatory compliance, and improve operational efficiency.
Unlike traditional reporting methods, this dashboard provides actionable insights through visualizations like trend charts, geographic heatmaps, and comparative analytics. It enables decision-makers to identify high-impact areas for emissions reduction, optimize RNG programs, and enhance leak detection and repair (LDAR) strategies. Whether for internal reporting, stakeholder transparency, or regulatory submissions, this dashboard serves as a centralized sustainability monitoring platform for natural gas retailers.
How to Create a Natural Gas Retail Sustainability & Environmental Impact Dashboard
You don’t need to build your report from scratch; just start with a ready-to-use dashboard template from Mokkup. Add in your data and export it however you like. Here’s how to do it:
1. Create or Log in to Your Mokkup Account
Start by signing up on Mokkup.ai using your email. If you already have an account, just log in, and you’ll be good to go.
2. Choose and Customize Your Dashboard Template
Find the Natural Gas Retail Sustainability & Environmental Impact Dashboard template in the Templates section. Use the drag and drop editor to adjust KPIs, edit filters, or add elements based on your data.
3. Export to Your BI Tool
Once your dashboard wireframe is ready, use the BI Tool Export feature to send it directly to Power BI or Tableau for further analysis and enhancements. You can also download the dashboard as a PDF, PNG, or JPEG, embed it on a platform, or invite your team to collaborate.
Note: This is a Pro template. You’ll need a Pro subscription on Mokkup to use and customize this dashboard wireframe. Upgrade anytime to unlock full access.
Natural Gas Retail Sustainability & Environmental Impact Dashboard Example
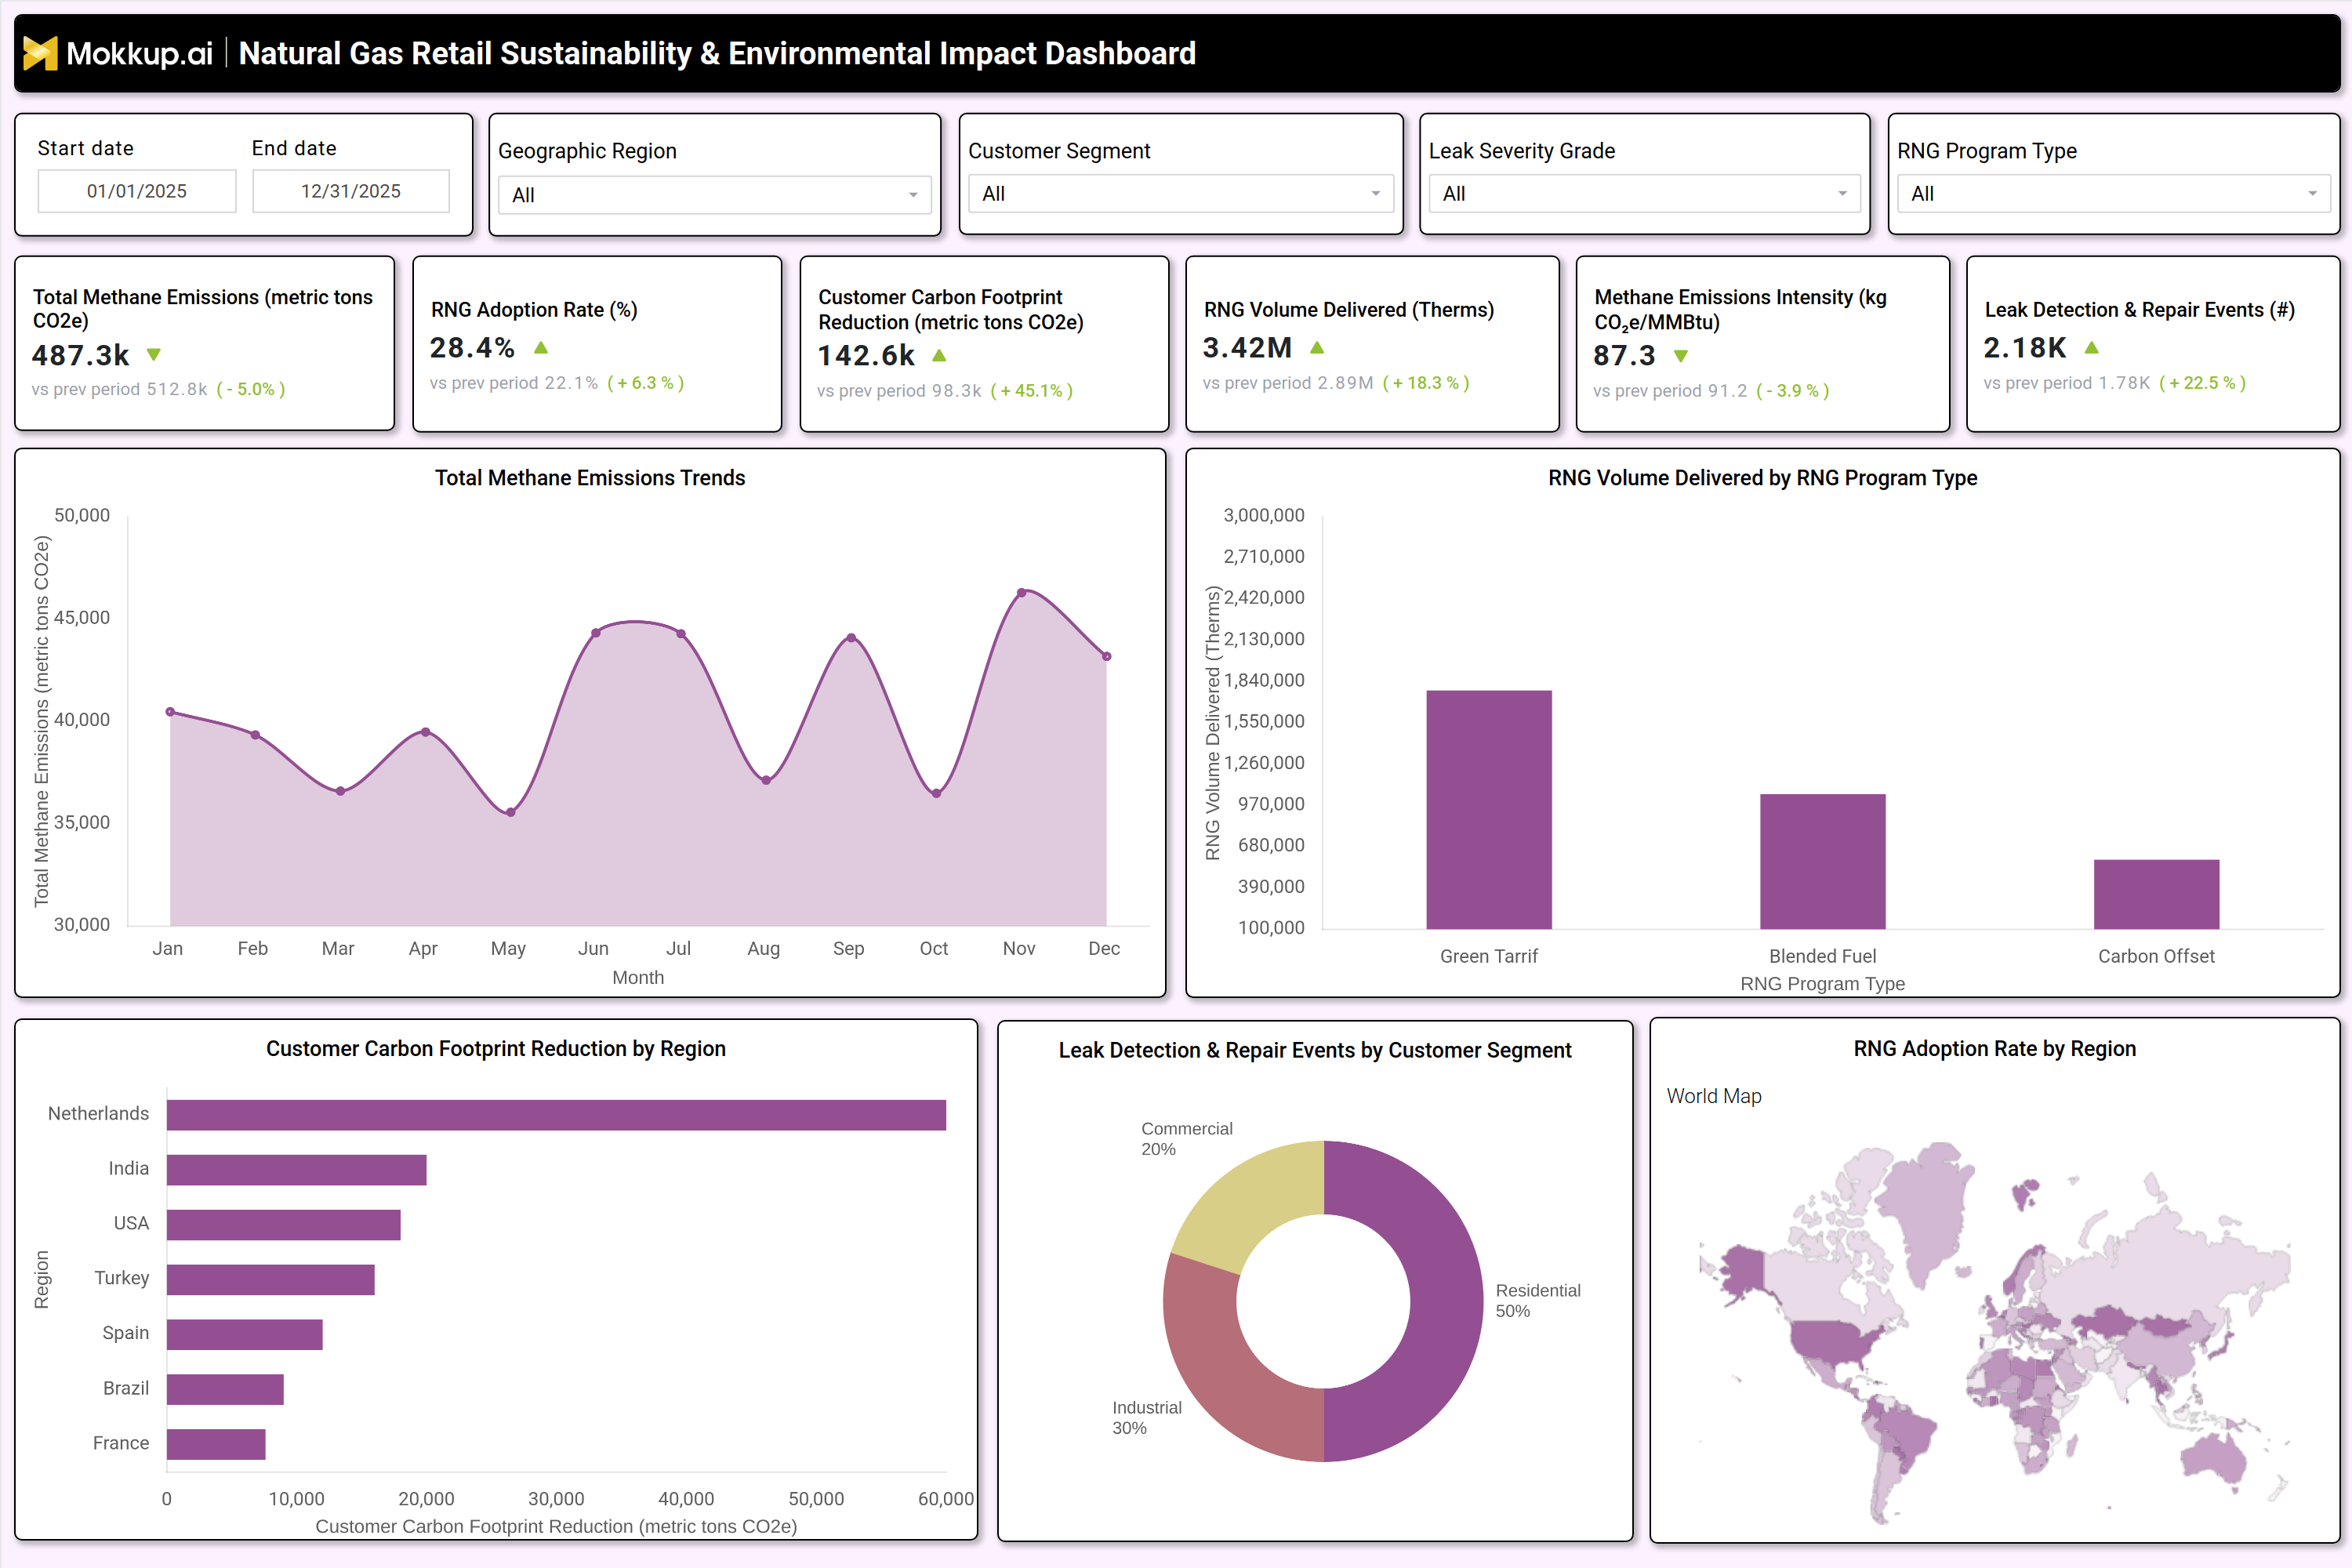
A well-structured Natural Gas Retail Sustainability & Environmental Impact Dashboard includes interactive filters for date ranges, geographic regions, customer segments, leak severity grades, and RNG program types. Key performance tiles display critical metrics such as total methane emissions (metric tons CO₂e), RNG adoption rate (%), customer carbon footprint reduction (metric tons CO₂e), RNG volume delivered (therms), methane emissions intensity (kg CO₂e/MMBtu), and leak detection & repair events (count). Trend charts compare methane emissions over time, highlighting seasonal or operational fluctuations.
A bar chart breaks down RNG volume delivered by program type (e.g., Green Tariff, Blended Fuel, Carbon Offset), while a geographic heatmap visualizes RNG adoption rates by region. A pie chart categorizes leak detection & repair events by customer segment (residential, commercial, industrial), and a horizontal bar chart ranks RNG program effectiveness by region based on carbon footprint reduction. Together, these components provide a comprehensive view of sustainability performance, enabling gas retailers to track progress, identify inefficiencies, and implement data-driven improvements.
How to Analyze Data in a Natural Gas Retail Sustainability & Environmental Impact Dashboard
Here is how you can analyze data from this Sustainability Performance Dashboard:
- Monitor total methane emissions trends to identify seasonal or operational spikes in greenhouse gas output.
- Track RNG adoption rates to assess the effectiveness of renewable energy programs and customer participation.
- Measure customer carbon footprint reduction to evaluate the impact of sustainability initiatives on end users.
- Compare RNG volume delivered by program type to determine which incentives drive the highest adoption.
- Analyze methane emissions intensity to benchmark efficiency against industry standards.
- Review leak detection & repair events to prioritize maintenance efforts and reduce fugitive emissions.
- Assess RNG program effectiveness by region to allocate resources where they yield the highest carbon reductions.
- Segment data by customer type (residential, commercial, industrial) to tailor sustainability strategies for different user groups.
Benefits of a Natural Gas Retail Sustainability & Environmental Impact Dashboard
The following are the benefits of using this Gas Retail Sustainability Dashboard:
- Enhances emissions tracking with real-time and historical data for regulatory compliance.
- Improves RNG program management by identifying high-performing initiatives and underperforming regions.
- Reduces environmental impact through data-driven leak detection and repair strategies.
- Supports ESG reporting with standardized, auditable sustainability metrics.
- Optimizes operational efficiency by pinpointing inefficiencies in methane emissions and energy use.
- Boosts stakeholder transparency with clear, visual reporting on sustainability progress.
- Enables predictive analytics to forecast emissions trends and plan mitigation strategies.
KPIs to Track in a Natural Gas Retail Sustainability & Environmental Impact Dashboard
The following key KPIs can be tracked by using this Carbon Footprint Dashboard:
- Total Methane Emissions (metric tons CO₂e): Measures the overall greenhouse gas output from natural gas operations.
- RNG Adoption Rate (%): Tracks the percentage of customers enrolled in renewable natural gas programs.
- Customer Carbon Footprint Reduction (metric tons CO₂e): Quantifies the environmental impact of sustainability programs on end users.
- RNG Volume Delivered (Therms): Indicates the total volume of renewable natural gas supplied to customers.
- Methane Emissions Intensity (kg CO₂e/MMBtu): Benchmarks emissions efficiency per unit of energy delivered.
- Leak Detection & Repair Events (count): Counts the number of identified and fixed gas leaks to minimize fugitive emissions.
- RNG Program Effectiveness (metric tons CO₂e reduction): Evaluates the carbon savings achieved by different RNG initiatives.
Frequently Asked Questions
1. What is a Gas Network Sustainability Dashboard?
A natural gas retail sustainability tracking dashboard is an analytics tool that monitors methane emissions, RNG adoption, carbon footprint reduction, and leak detection for gas utilities and retailers
2. What data sources feed into a carbon footprint dashboard for gas suppliers?
Data comes from emissions monitoring systems, RNG program records, leak detection logs, and customer energy consumption reports.
3. Can this natural gas retail sustainability tracking dashboard help with ESG reporting?
Yes, it standardizes sustainability metrics for accurate, auditable ESG disclosures.