What is a Water Network Asset Health & Leak Management Dashboard?
The Water Network Asset Health & Leak Management Dashboard is a structured analytics template designed for water utility managers, infrastructure planning teams, and municipal operations teams who need a consolidated view of their distribution network performance. It tracks asset condition, leak activity, and maintenance compliance across the entire water network, bringing together operational data that typically lives in separate systems.
This water network asset health dashboard helps organizations move from reactive incident response to proactive infrastructure management by surfacing where assets are degrading, where leaks are recurring, and where maintenance programs are falling short. Teams managing aging pipe networks and growing service areas use it to prioritize investment, reduce non-revenue water losses, and maintain compliance with regulatory benchmarks — making water leak repair time tracking and asset condition visibility a core part of day-to-day operations.
How to Create a Water Network Asset Health & Leak Management Dashboard
You don’t need to build your report from scratch, just start with a ready-to-use Water Network Asset Health & Leak Management dashboard template from Mokkup. Add in your data and export it however you like. Here’s how to do it:
1. Create or Log in to Your Mokkup Account
Start by signing up on Mokkup.ai using your email. If you already have an account, just log in, and you'll be good to go.
2. Choose and Customize Your Dashboard Template
Find the Water Network Asset Health & Leak Management Dashboard template in the Templates section. Use the drag-and-drop editor to adjust KPIs, edit filters, or add elements based on your data.
3. Export to Your BI Tool
Once your dashboard wireframe is ready, use the BI Tool Export feature to send it directly to Power BI or Tableau for further analysis and enhancements. You can also download the dashboard as a PDF, PNG, or JPEG, embed it on a platform, or invite your team to collaborate.
Note: This is a Pro template. You'll need a Pro subscription on Mokkup to use and customize this dashboard wireframe. Upgrade anytime to unlock full access.
Water Network Asset Health & Leak Management Dashboard Example
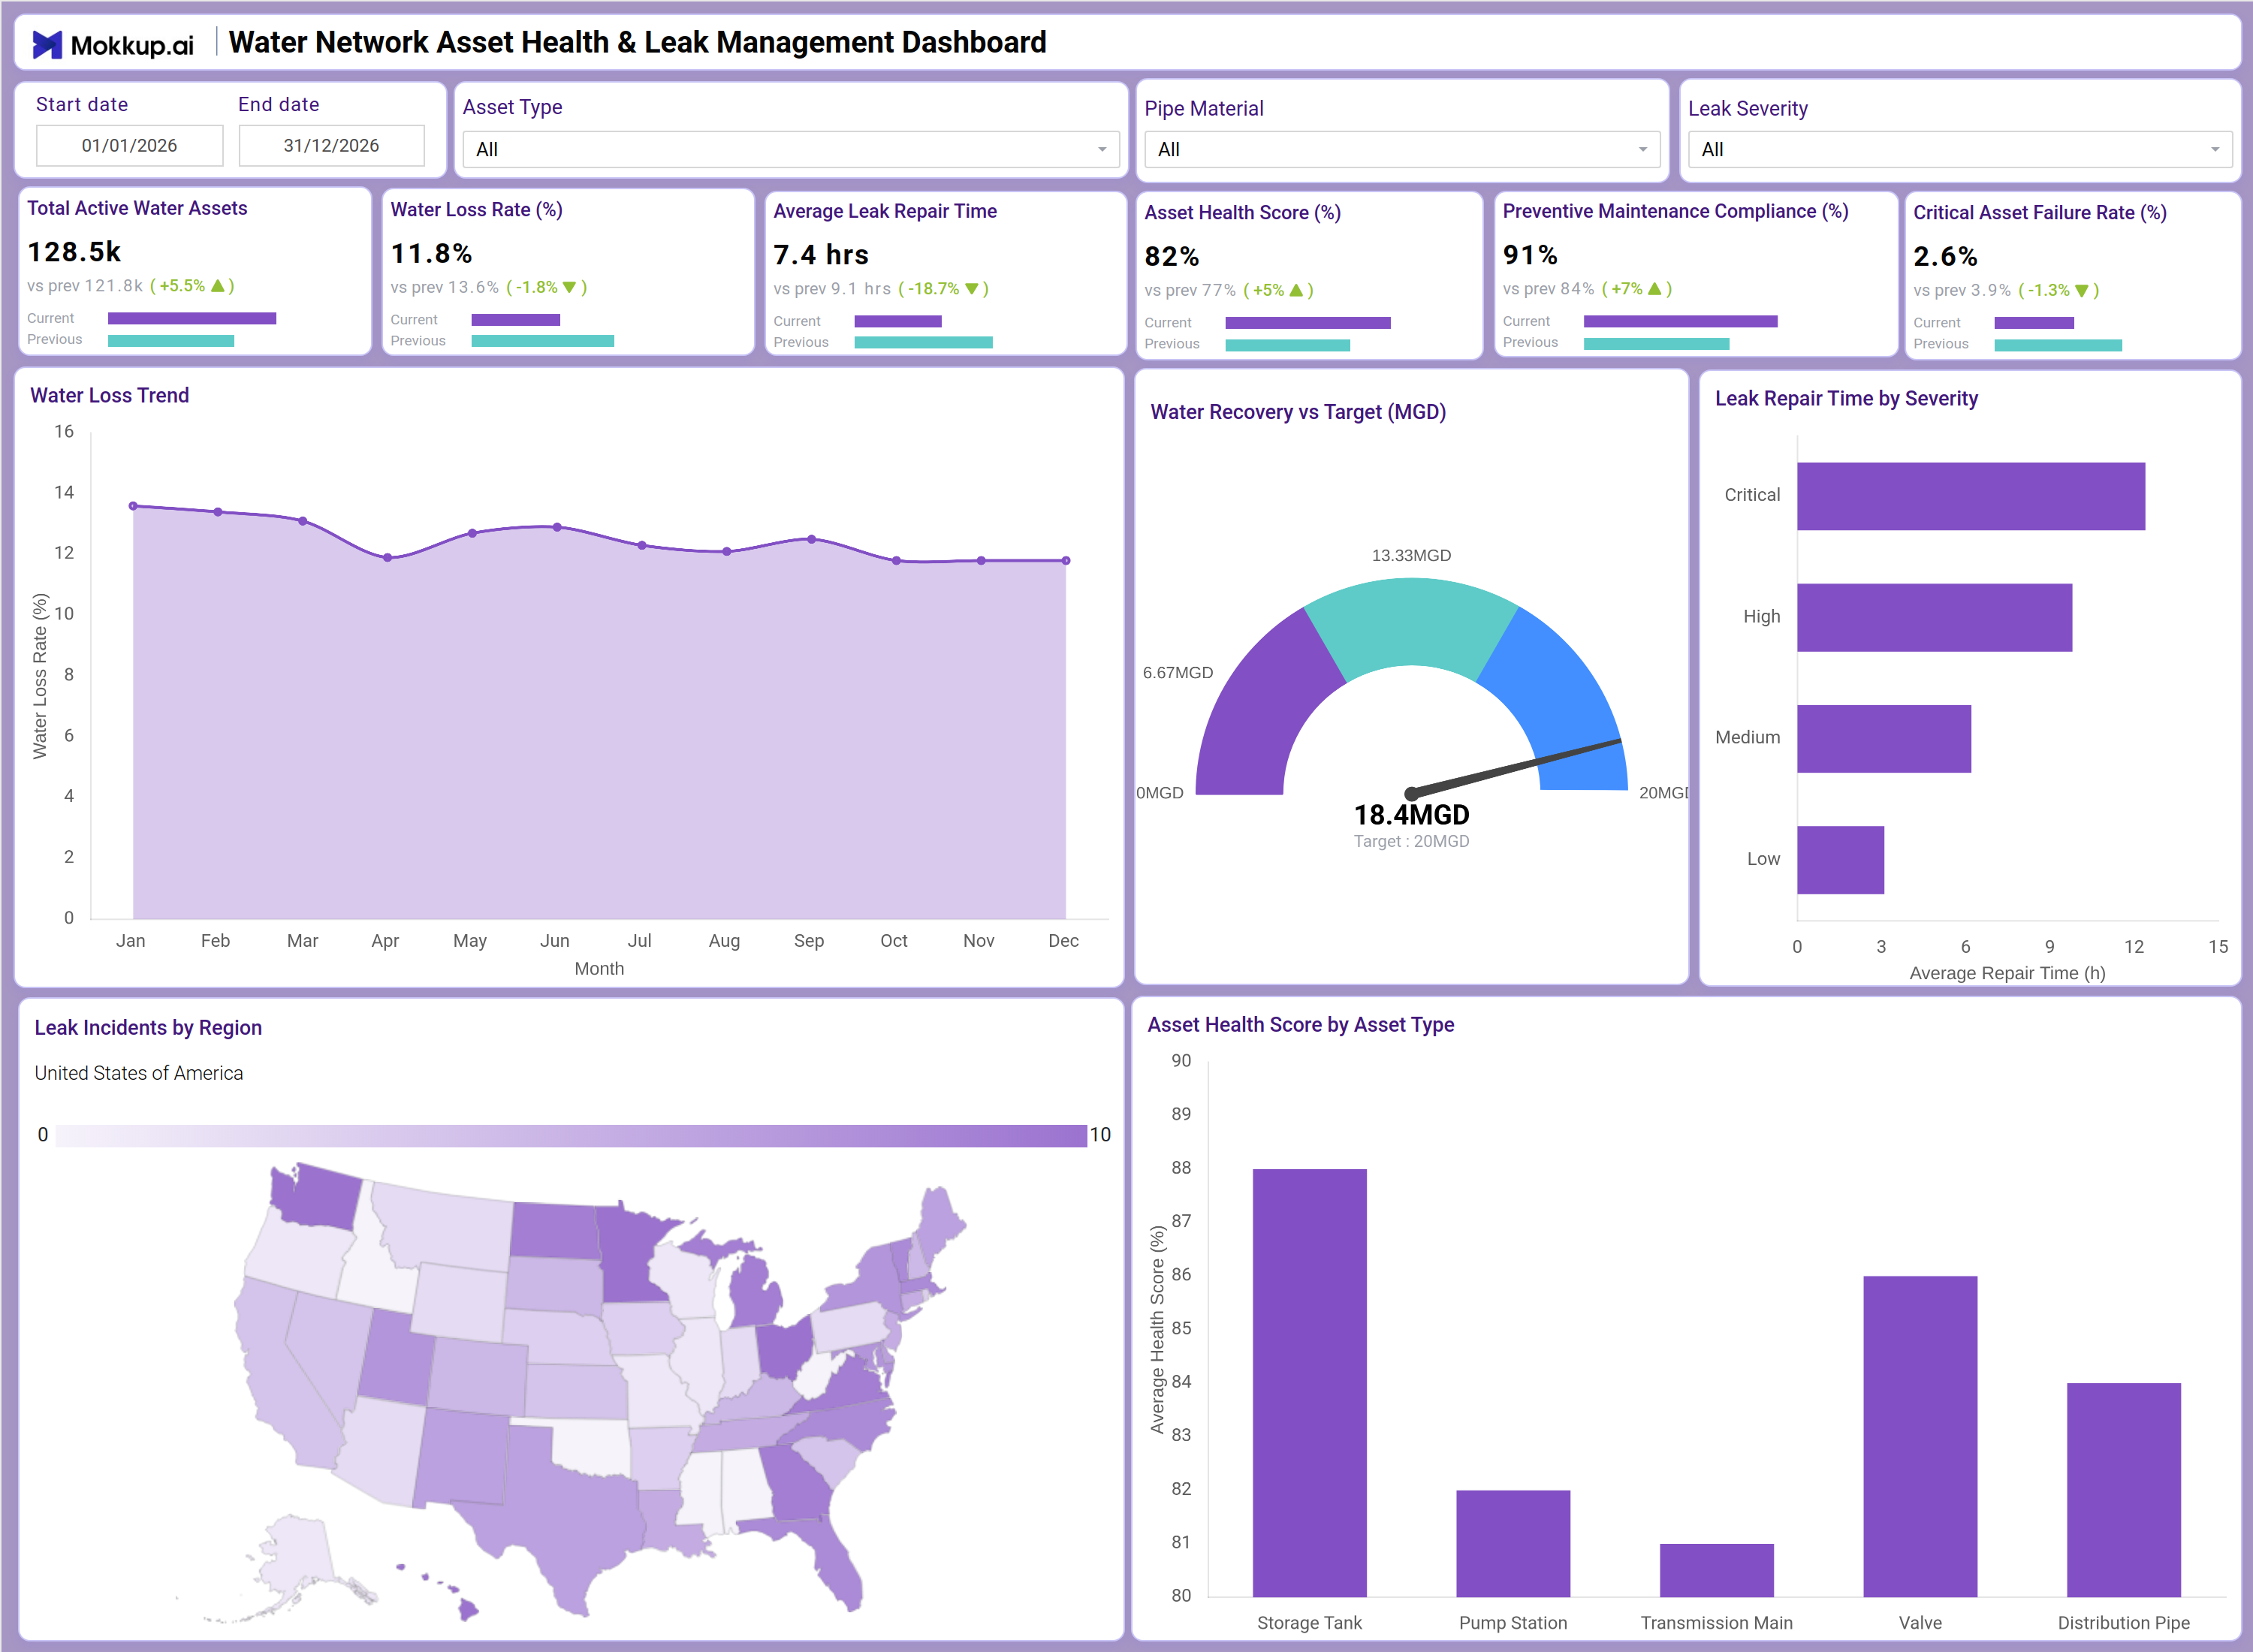
An infrastructure analyst opening this dashboard is typically trying to answer one question: where in the network are we losing water and how fast can we fix it? The top KPI row immediately surfaces where performance stands whether water loss rate is trending upward, how far the asset health score sits from target, and whether the critical asset failure rate water network threshold has been breached. From there, teams can quickly determine if they need to escalate maintenance resources or if performance is holding within acceptable bounds. The Water Loss Trend line chart gives planners a full-year view of how water loss rate has moved month by month, making it straightforward to identify seasonal spikes or deterioration patterns that the water loss rate monitoring dashboard was designed to surface early. Alongside this, the Water Recovery vs Target gauge provides an at-a-glance read of how actual recovery compares to the operational target, helping operations leads flag shortfalls before they translate into compliance issues.
For field coordination teams, the Leak Repair Time by Severity horizontal bar chart is a key prioritization tool. Managers can assess how long critical, high, medium, and low-severity leaks are taking to resolve, and identify whether the water leak repair time tracking process aligns with SLA commitments. The Leak Incidents by Region choropleth map overlays leak activity geographically across the United States, allowing network planners to cluster intervention efforts in the highest-incident zones rather than treating all regions equally. The Asset Health Score by Asset Type bar chart rounds out the picture by showing which infrastructure categories storage tanks, pump stations, transmission mains, valves, and distribution pipes are performing well versus those that need attention. Combined with filters for asset type, pipe material, and leak severity, this leak management dashboard for water utilities gives teams everything they need to move from a network-wide summary down to a targeted operational response.
How to Analyze Data in a Water Network Asset Health & Leak Management Dashboard
Here is how you can analyze data from this dashboard:
- Isolate Metrics by Asset Type: Use the Asset Type filter to isolate health scores and leak metrics for specific infrastructure categories such as valves or pump stations.
- Detect Emerging Leak Clusters Early: Monitor the Water Loss Trend line chart to detect month-over-month increases in water loss rate monitoring dashboard data that may signal emerging leak clusters.
- Flag Recovery Shortfalls Against Targets: Review the Water Recovery vs Target gauge to assess how actual MGD output compares to the operational target and flag recovery shortfalls early.
- Evaluate Leak Repair Timeframes by Severity: Use the Leak Repair Time by Severity chart to identify whether critical or high-severity leaks are being resolved within acceptable timeframes.
- Assess Geographic Concentration of Critical Incidents: Filter by Leak Severity to focus attention on critical incidents and evaluate their geographic concentration using the Leak Incidents by Region map.
- Identify Infrastructure Types Dragging Down Health Scores: Analyze the Asset Health Score by Asset Type chart to determine which infrastructure types are driving down the overall network health score.
- Link Pipe Material to Failure Rates and Repair Cycles: Filter by Pipe Material to understand whether specific pipe compositions are associated with higher failure rates or longer repair cycles.
- Measure Maintenance Execution Consistency Over Time: Track Preventive Maintenance Compliance over time to measure how consistently scheduled maintenance is being executed across asset categories.
Benefits of a Water Network Asset Health & Leak Management Dashboard
The following are the benefits of using this dashboard:
- Centralizes All Critical Network Data in One Place: Centralizes water loss rate, asset health scores, and leak incident data across the full distribution network in one structured template.
- Supports Multi-Asset, Multi-Severity Monitoring: Supports leak management dashboard for water utilities teams monitoring multiple asset types and severity levels simultaneously.
- Eliminates Manual Data Compilation for Infrastructure Reports: Reduces manual data compilation for infrastructure reporting with pre-built KPI tiles and chart layouts for six key operational metrics.
- Guides Field Resource Allocation with Region-Level Insights: Enables region-level analysis of preventive maintenance compliance water infrastructure performance to guide field resource allocation.
- Benchmarks Repair Time for SLA and Efficiency Planning: Provides a severity-based breakdown of average leak repair time for operational efficiency and SLA compliance planning.
- Aligns Maintenance Programs with Asset Condition Data: Helps utility operations managers and infrastructure planners align maintenance programs with asset condition data without rebuilding reports.
- Creates a Shared View Across Field Teams and Executives: Gives field teams and executive stakeholders a shared view of network asset health and leak response performance.
KPIs to Track in a Water Network Asset Health & Leak Management Dashboard
The following key KPIs can be tracked by using this dashboard:
- Total Active Water Assets: Counts all monitored assets in the water network asset health dashboard establishes the scope of infrastructure under management.
- Water Loss Rate (%): Core metric for the water loss rate monitoring dashboard — measures the percentage of distributed water that does not reach the end consumer, directly tied to revenue and efficiency.
- Average Leak Repair Time (hrs): Tracks the mean time to resolve a detected leak — central to water leak repair time tracking and service-level compliance.
- Asset Health Score (%): Measures the overall condition of network assets as a percentage supports critical asset failure rate water network analysis and investment prioritization.
- Preventive Maintenance Compliance (%): Tracks how consistently scheduled maintenance tasks are completed — key indicator for preventive maintenance compliance water infrastructure programs.
- Critical Asset Failure Rate (%): Measures the percentage of critical assets that have experienced failure events — used to assess systemic infrastructure risk across the network.
Frequently Asked Questions
Q1. What types of water utility teams benefit most from this dashboard?
Municipal water utility managers, infrastructure planning teams, and field operations coordinators benefit most. It consolidates asset health, leak tracking, and maintenance compliance data into one structured view for each of these groups.
Q2. Can this dashboard track leak incidents by geographic region?
Yes. The Leak Incidents by Region choropleth map displays leak activity across U.S. regions on a 0-10 scale. Teams can use the Leak Severity and Asset Type filters to narrow the view to specific incident profiles.
Q3. Is this dashboard suitable for tracking preventive maintenance program performance?
Yes. The Preventive Maintenance Compliance KPI tile directly measures program execution rates. Combined with the Asset Health Score by Asset Type chart, teams can link maintenance gaps to specific infrastructure categories that are underperforming.