
What is a Water Efficiency Dashboard?
A Water Efficiency Dashboard for agriculture is a centralized reporting and monitoring platform that helps farms improve crop productivity while conserving water and reducing operational costs. It enables farm managers, irrigation experts, and sustainability officers to track irrigation water usage, monitor soil moisture levels, measure rainfall impact, and analyze cost efficiency. Designed for the Agriculture & Sustainability sector, this smart dashboard to improve irrigation efficiency comes with KPI cards, interactive charts, and dynamic filters, ensuring real-time water usage monitoring to support smarter irrigation decisions, sustainable farming practices, and enhanced crop performance.
How to Create a Water Efficiency Dashboard
You don’t need to build your report from scratch-just start with a ready-to-use dashboard template from Mokkup. Add in your data and export it however you like. Here’s how to do it:
1. Create or Log in to Your Mokkup Account
Start by signing up on Mokkup.ai using your email. If you already have an account, just log in, and you’ll be good to go.
2. Choose and Customize Your Dashboard Template
Find the Water Efficiency Dashboard template in the Templates section. Use the drag-and-drop editor to adjust KPIs, edit filters, or add elements based on your data.
3. Export to Your BI Tool
Once your dashboard wireframe is ready, use the BI Tool Export feature to send it directly to Power BI or Tableau for further analysis and enhancements. You can also download the dashboard as a PDF, PNG, or JPEG, embed it on a platform, or invite your team to collaborate.
Note: This is a Pro template. To use and customize this dashboard wireframe, you’ll need a Pro subscription on Mokkup. Upgrade anytime to unlock full access.
Water Efficiency Dashboard Example
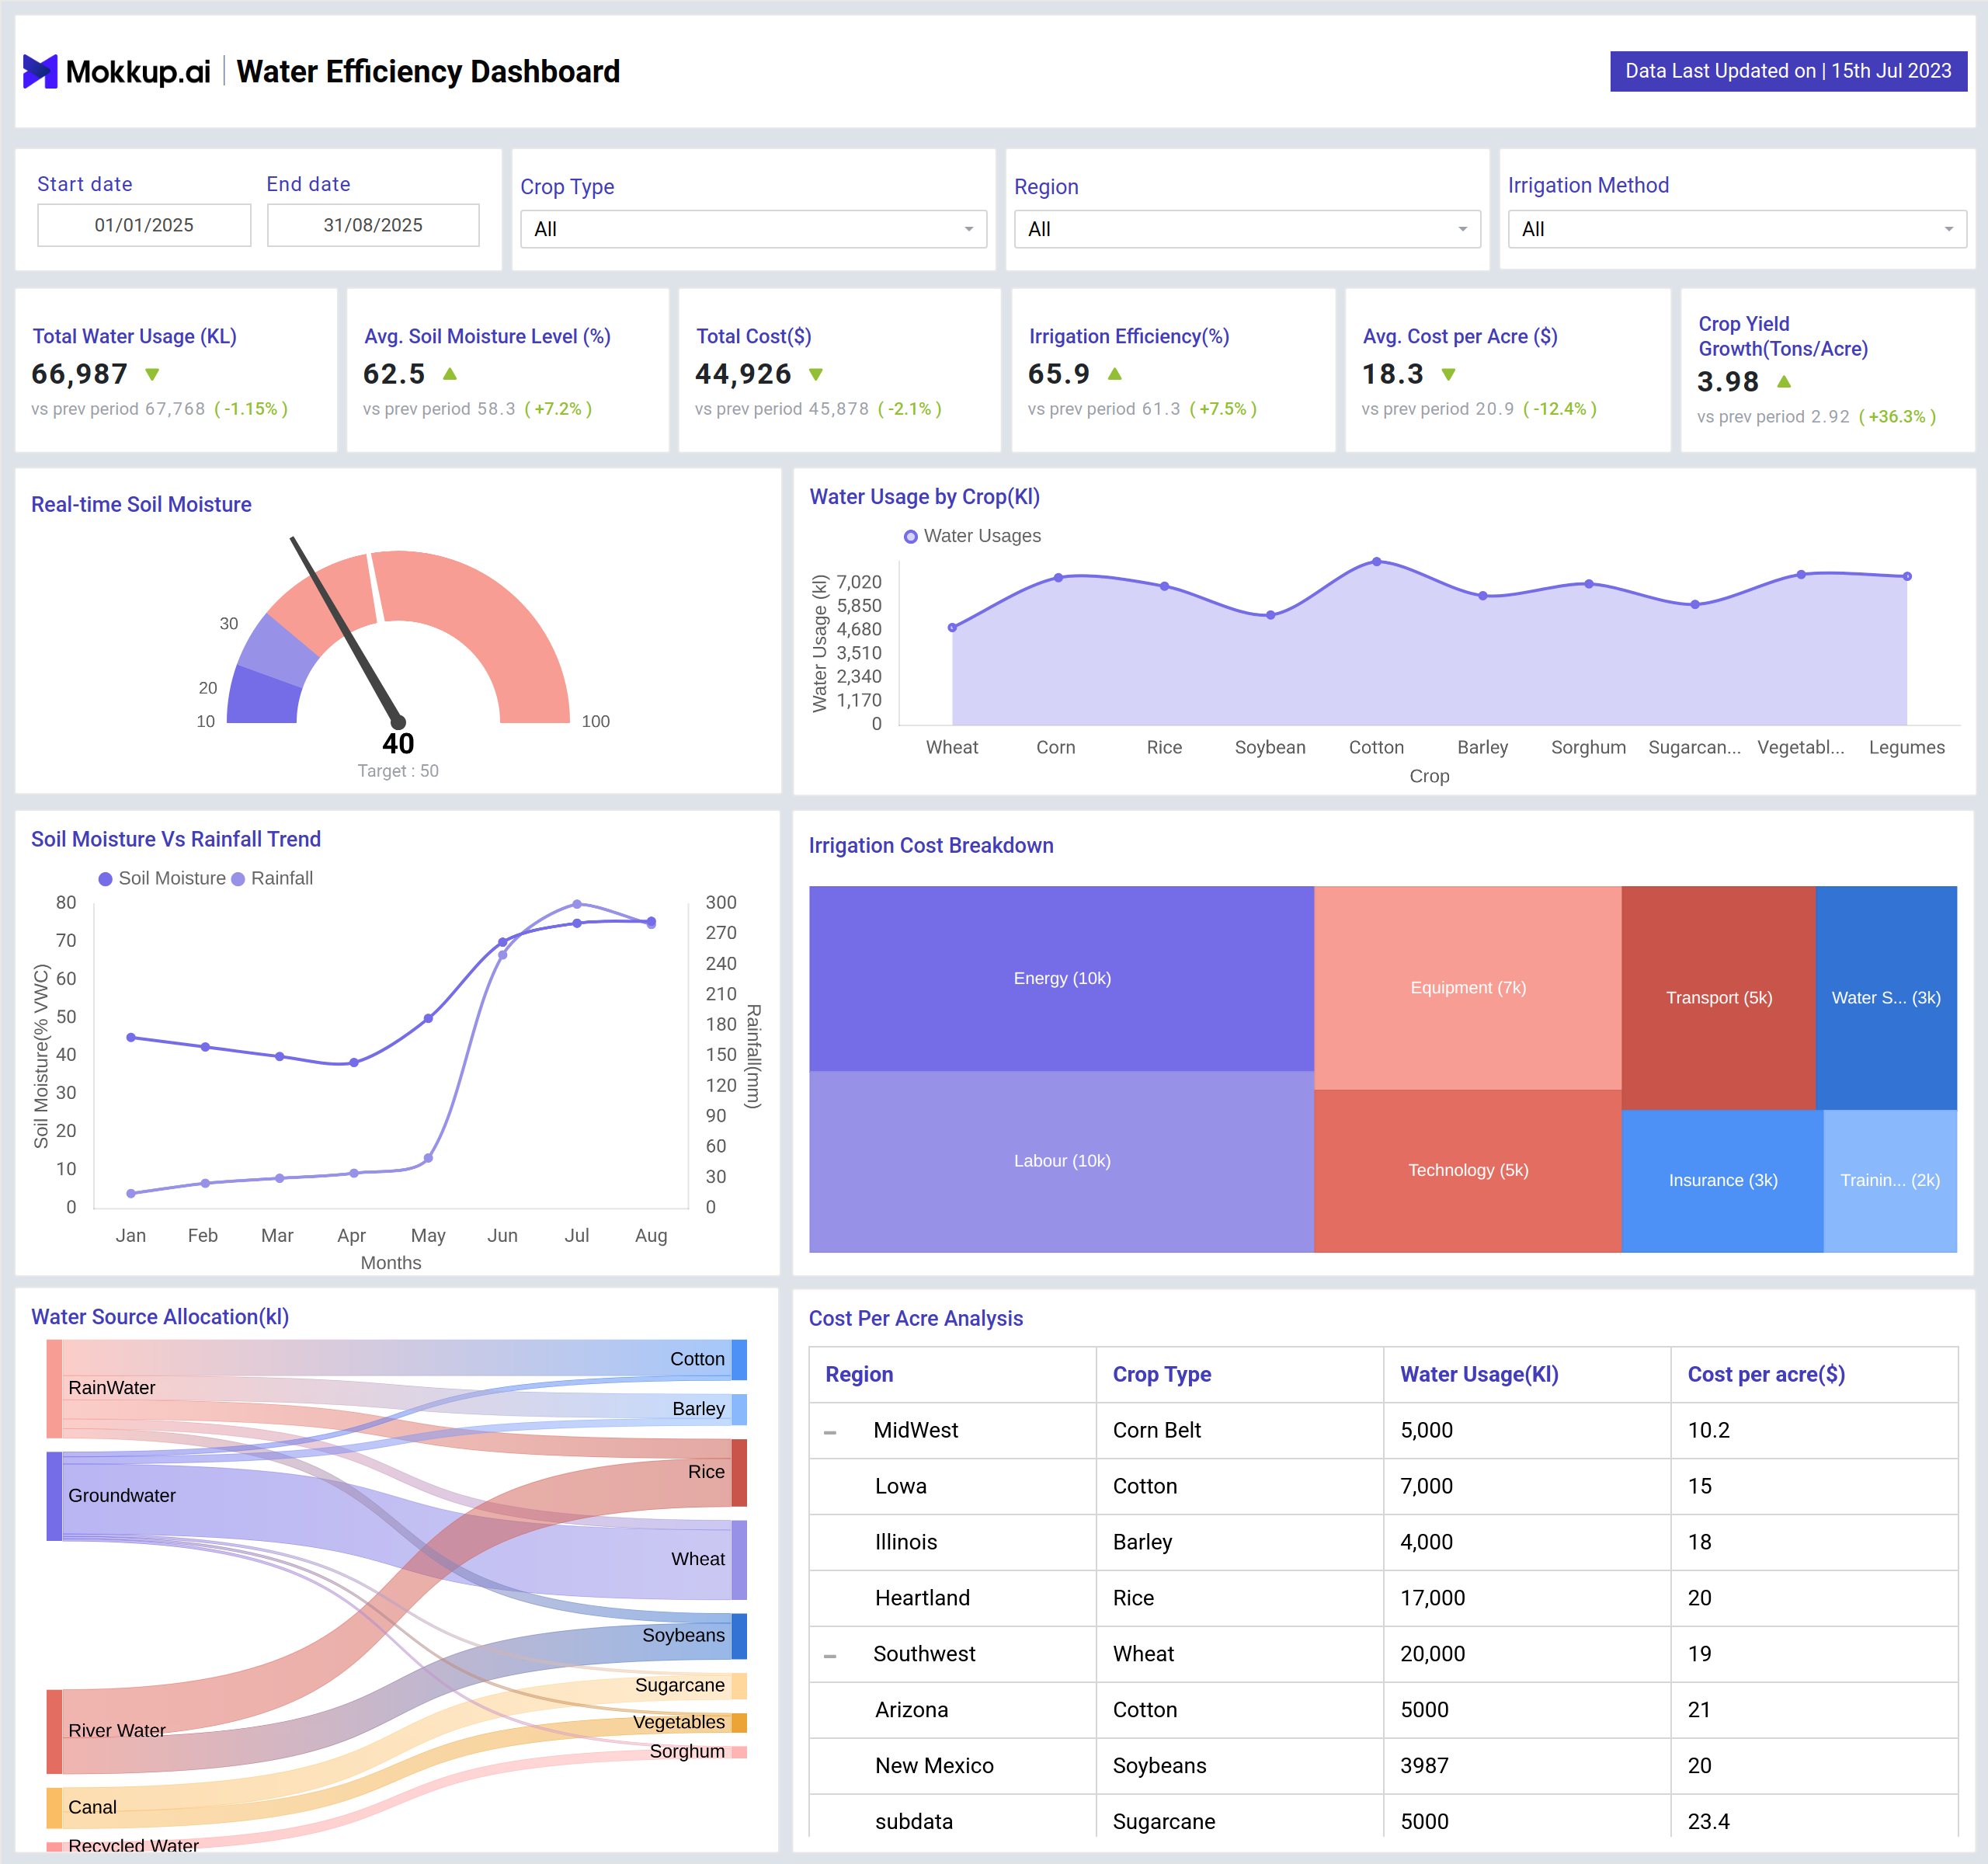
The dashboard features a clear single-screen layout with KPI cards showing Total Water Usage (KL), Average Soil Moisture Level (%), Total Costs ($), Irrigation Efficiency (%), Average Cost per Acre ($), and Crop Yield Growth (%). Line charts enable real-time water usage monitoring in agriculture by tracking crop-level consumption and comparing soil moisture with rainfall. A gauge chart provides live soil moisture insights, a treemap breaks down irrigation costs, and a hierarchy table shows cost per acre by region. A Sankey chart visualizes water allocation across crops, and flexible filters like Crop Type, Region, and Irrigation Method allow customized analysis. This smart dashboard to improve irrigation efficiency delivers actionable insights in a visually engaging way.
How to Analyze Data in Water Efficiency Dashboards
An effective dashboard with an Irrigation water usage monitoring system makes data truly actionable:
- Track crop-level water consumption using line charts to see trends in water usage across different growth stages.
- Compare soil moisture with rainfall to adjust irrigation scheduling and avoid unnecessary water use.
- Monitor real-time soil moisture against ideal thresholds for healthier crop growth and early stress detection.
- Analyze irrigation cost components (water, labor, energy) to identify where most resources are being spent.
- Drill down into high-cost regions or crops via the hierarchy table to uncover inefficiencies at a granular level.
- Visualize the allocation of water sources across different crops to ensure balanced and efficient distribution.
Benefits of Water Efficiency Dashboards
Using a water efficiency dashboard for agriculture provides several advantages:
- Centralized Monitoring -Combines soil, water, and cost data in one platform for a real-time farm overview.
- Improved Resource Allocation -Identifies high-water-demand crops and regions for efficient irrigation deployment.
- Cost Optimization -Highlights inefficiencies through cost-per-acre analysis to reduce water, labor, and energy expenses.
- Enhanced Crop Yield -Links irrigation efficiency directly to crop yield improvements for better productivity.
- Sustainability Insights -Supports water conservation by tracking usage trends and highlighting improvement areas.
- Customizable Analysis -Filters for crop type, irrigation method, and region make this a smart dashboard to improve irrigation efficiency.
KPIs to Track in Water Efficiency Dashboards
The six most important KPIs include:
- Total Water Usage (KL): Measures the total amount of water consumed across farming operations.
- Average Soil Moisture Level (%): This indicates the average soil moisture, a key factor for crop health and irrigation needs.
- Total Costs ($): Represents the combined expense of water, labor, and energy in farming activities.
- Irrigation Efficiency (%): Shows the ratio of water used to crop yield, reflecting sustainable farming practices.
- Average Cost per Acre ($): Tracks the average expense per acre, highlighting land-level resource efficiency.
- Crop Yield Growth (%): Measures the improvement in crop yield over time, showcasing productivity gains.
Frequently Asked Questions
1. How can a water efficiency dashboard help detect water stress in crops early?
It monitors real-time soil moisture levels and compares them with optimal thresholds, enabling proactive irrigation decisions to prevent crop stress.
2. How does it identify which crops or regions consume the most water?
Using hierarchy tables and Sankey charts, the dashboard highlights high-water-demand crops and regions, supporting better resource allocation.
3. Does the dashboard integrate with existing BI tools like Power BI or Tableau?
Yes, the Mokkup dashboard can be exported to Power BI, Tableau, or downloaded as PDF/PNG/JPEG for reporting and advanced analytics.