
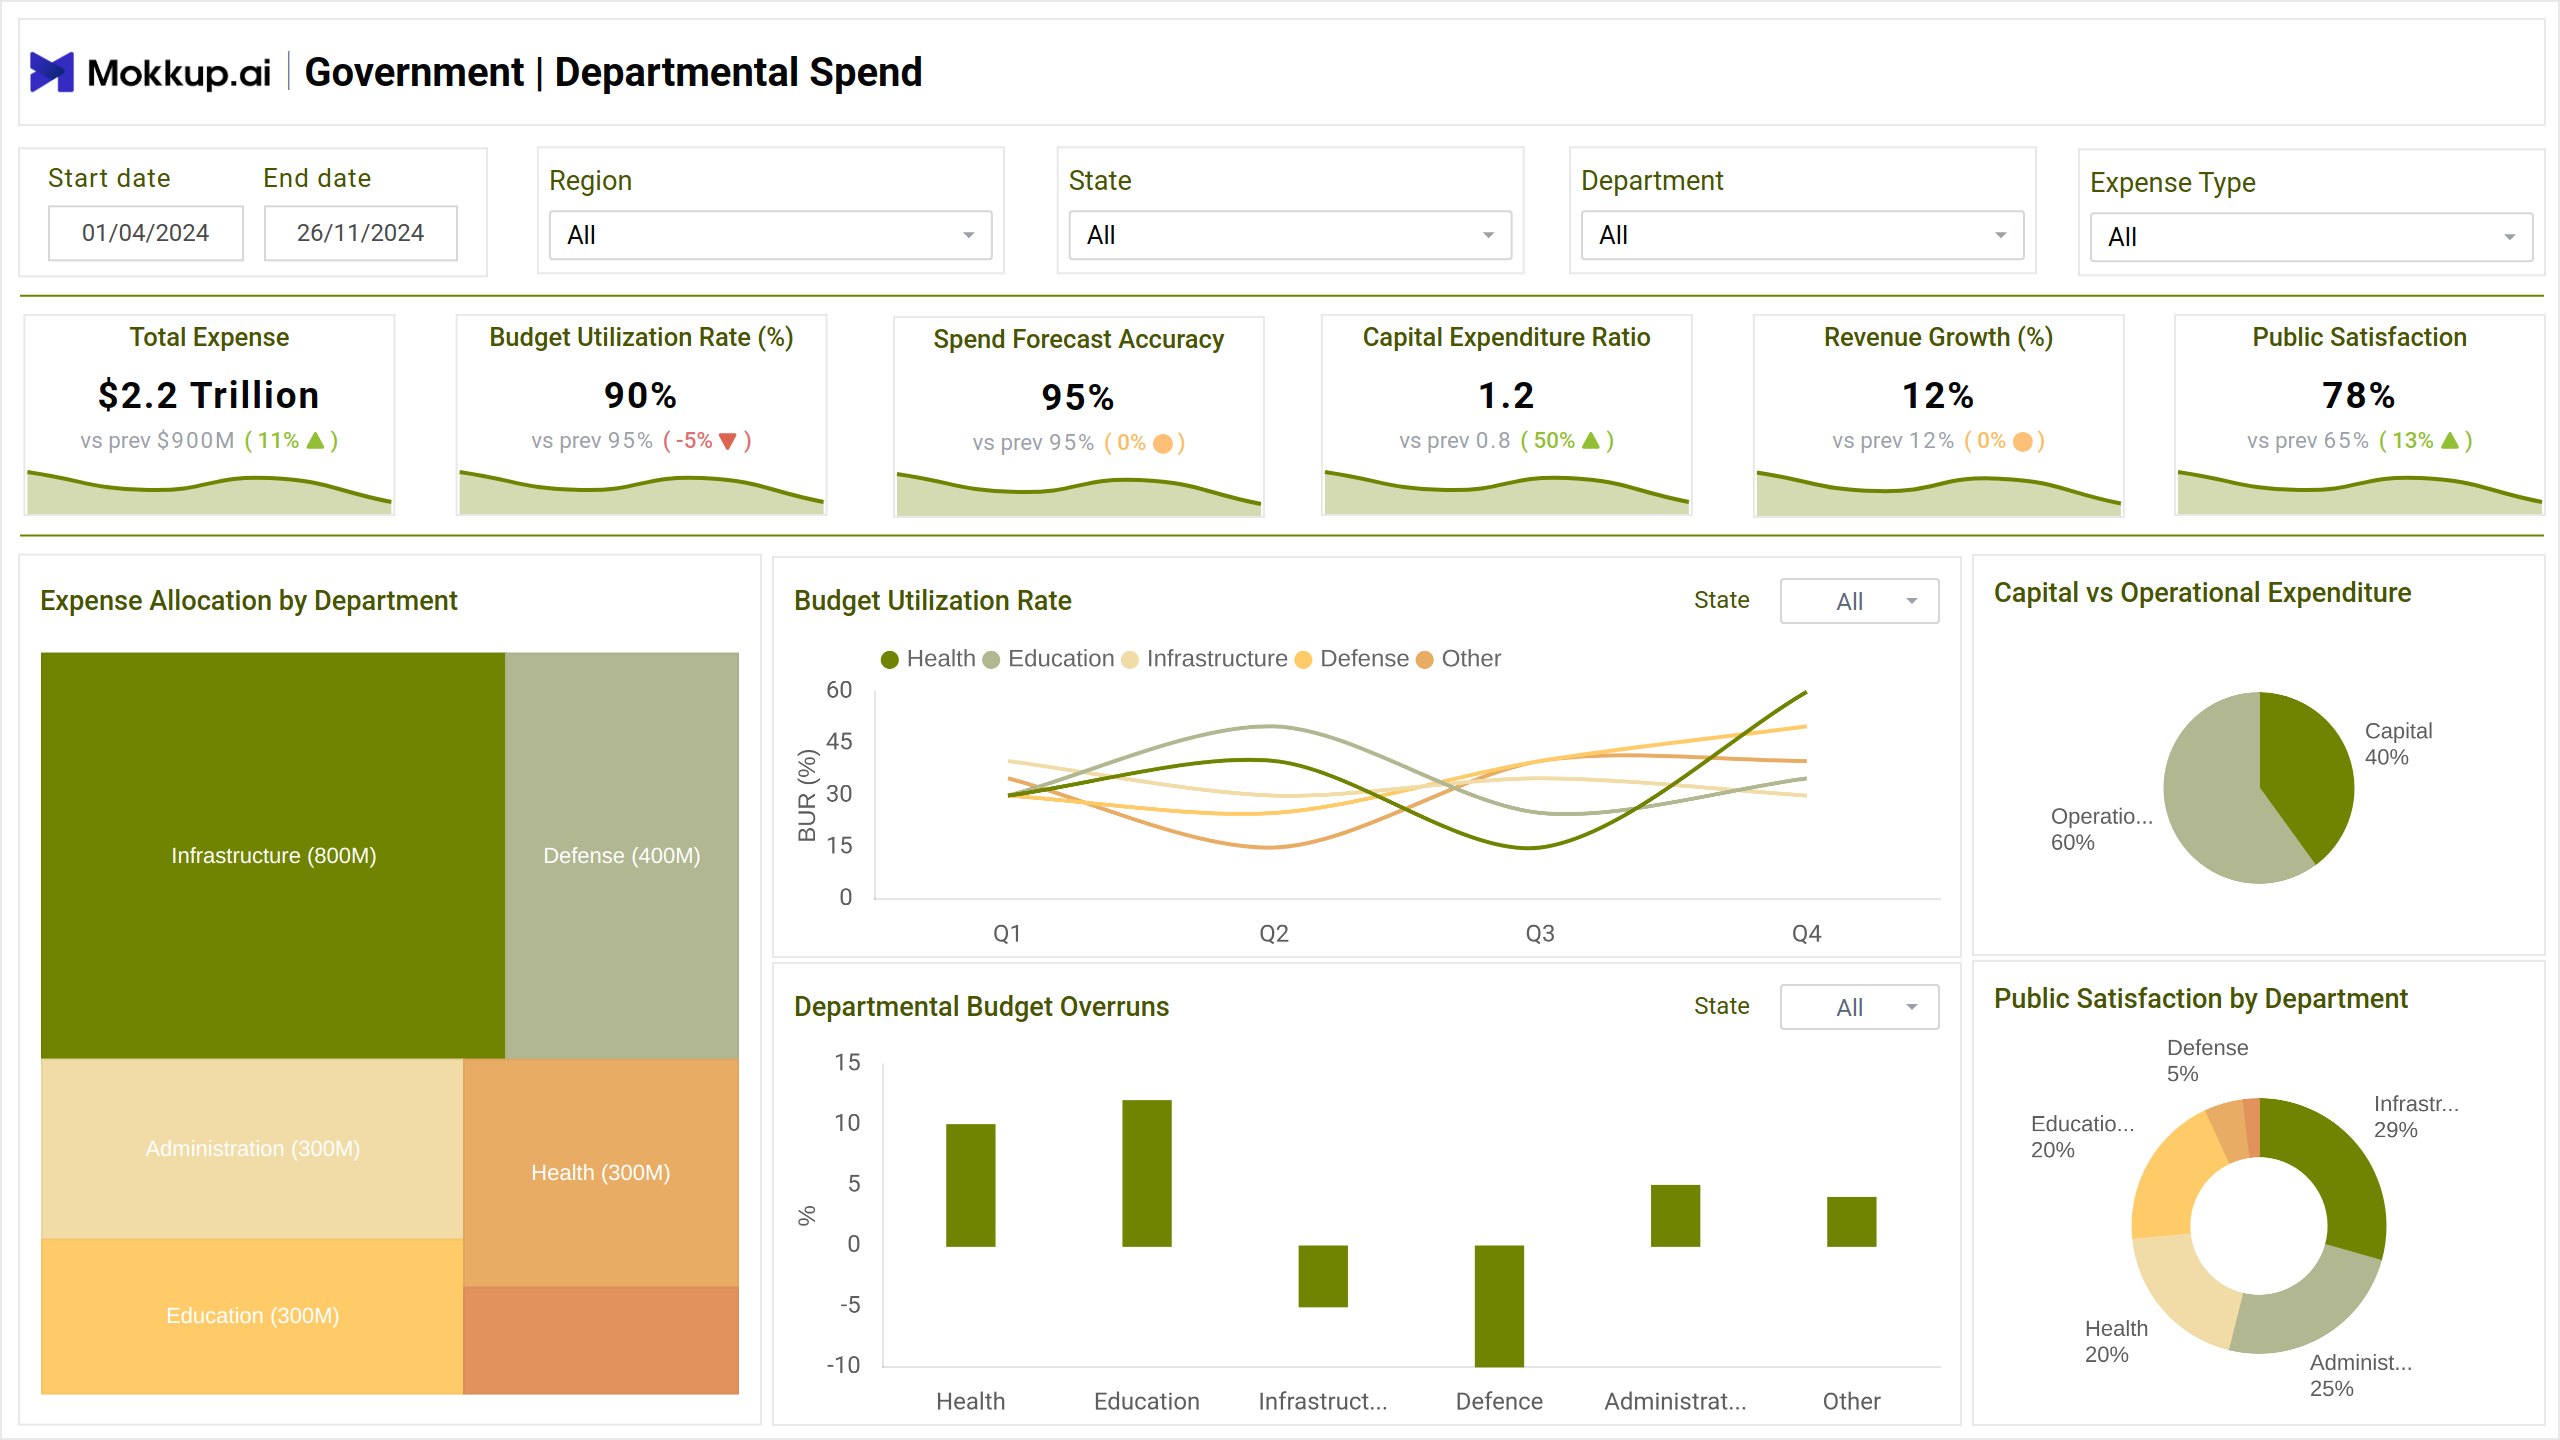
What is a Government Departments Expense Tracker Dashboard?
The Government Departments Expense Tracker Dashboard template provides a consolidated view of government spending and budget utilization across various departments. It helps policymakers and administrators track financial efficiency, forecast accuracy, and public satisfaction. The dashboard wireframe supports strategic decision-making for optimal resource allocation by visualizing expenditure patterns and identifying budget overruns.
Government Expense Tracker Dashboard Example
The Government Expense Tracker Dashboard wireframe provides a centralized view of departmental spending by combining budget allocations, actual expenditures, and category-specific breakdowns into a clear, actionable style.
Designed for financial officers and government managers, this template makes it easier to track costs across departments, emphasizes budget variations, and promotes greater planning and accountability in public fund management.
How to Analyze Data in Government Expense Dashboards
Analyzing a government expense dashboard wireframe helps uncover budget gaps, highlight department performance, and guide smarter spending decisions. Here’s how to do it:
- Check total expenses to monitor how departments use allocated budgets across the public sector dashboard.
- Track budget utilization trends to identify over- or under-spending and ensure efficient use of resources.
- Review forecast accuracy to assess the reliability of financial planning and spot inefficiencies early.
- Compare capital vs. operational spending to understand the focus on infrastructure or day-to-day services, which is key in departmental spending analysis.
- Using a public finance visualization tool, visualize departmental performance and public satisfaction using charts like treemaps, pie charts, and column graphs.
How to Create an Expense Tracker for Government Departments
You don’t need to build your report from scratch—just start with a ready-to-use sample Government Departments Expense Tracker dashboard template from Mokkup. Add in your data and export it however you like. Here’s how to do it:
1. Create or Log in to Your Mokkup Account
Start by signing up on Mokkup.ai using your email. Already have an account? Just log in, and you’re good to go.
2. Choose and Customize Your Dashboard Template
Find the Government Departments Expense Tracker dashboard in the Templates section. Use the drag-and-drop editor to adjust KPIs, edit filters, or add elements based on your data.
3. Export to Your BI Tool
Once your dashboard wireframe is ready, use the BI Tool Export feature to send it directly to Power BI or Tableau for further analysis and enhancements. You can also download the dashboard as a PDF, PNG, or JPEG, embed it on a platform, or invite your team to collaborate.
Note: This is a Pro template. To use and customize this dashboard wireframe, you’ll need a Pro subscription on Mokkup. Upgrade anytime to unlock full access.
Benefits of Government Expense Tracking Dashboards
Government departments manage vast budgets across various functions, making it essential to track expenses accurately and efficiently. A Mokkup.ai Government Dashboard template helps streamline this process by turning complex financial data into clear, actionable insights.
- Centralized Oversight: Provides a single view of department expenses for easier monitoring.
- Better Budget Control: Highlights budget vs. actual spend to spot over- or under-spending early.
- Greater Transparency: Promotes accountability and supports audits with precise, visual data.
- Faster Decision-Making: Real-time insights help allocate resources and respond to trends quickly.
- Easy Reporting: Simplifies complex data into easy-to-read visuals, reducing manual work.
- Custom Views: Filter by department, time, or category for more relevant insights.
- Detects Anomalies: Flags irregular trends or variances to prevent misuse of funds.
The dashboard wireframe boosts transparency, improves fiscal control, and supports smarter decisions, driving more responsible public spending.
KPIs to Track in Government Expense Dashboards
Tracking the right KPIs ensures government departments stay accountable and aligned with budget goals. These metrics provide valuable insights into financial health, efficiency, and service effectiveness.
- Total Expense: Tracks overall spending across departments, helping monitor fund usage and identify trends.
- Budget Utilization Rate: Measures how much of the allocated budget has been spent, showing efficiency or overspending.
- Forecast Accuracy: Compares projected expenses with actual spending to assess planning effectiveness.
- Capital Expenditure Ratio: Shows the share of spending on long-term investments versus daily operations.
- Revenue Growth: Measures the increase in government revenue over time, indicating financial stability.
- Public Satisfaction: Reflects how citizens rate the services received, highlighting areas needing improvement.
Frequently Asked Questions
Q1. What is a Government Expense Tracker Dashboard?
It’s a visual tool for monitoring and analyzing spending across government departments, helping improve transparency and financial control.
Q2. Who uses this dashboard?
It’s mainly used by government finance teams, auditors, and decision-makers to track budget utilization and identify cost-saving opportunities.
Q3. What are the key metrics shown?
Common metrics include total expenses, budget utilization rate, forecast accuracy, capital vs. operational spending, and public satisfaction.
Q4. How can this dashboard improve decision-making?
It provides real-time insights into spending patterns, helping leaders make informed, timely, and efficient budgetary decisions.