
What is a Water Distribution Long-Term Infrastructure Renewal Dashboard?
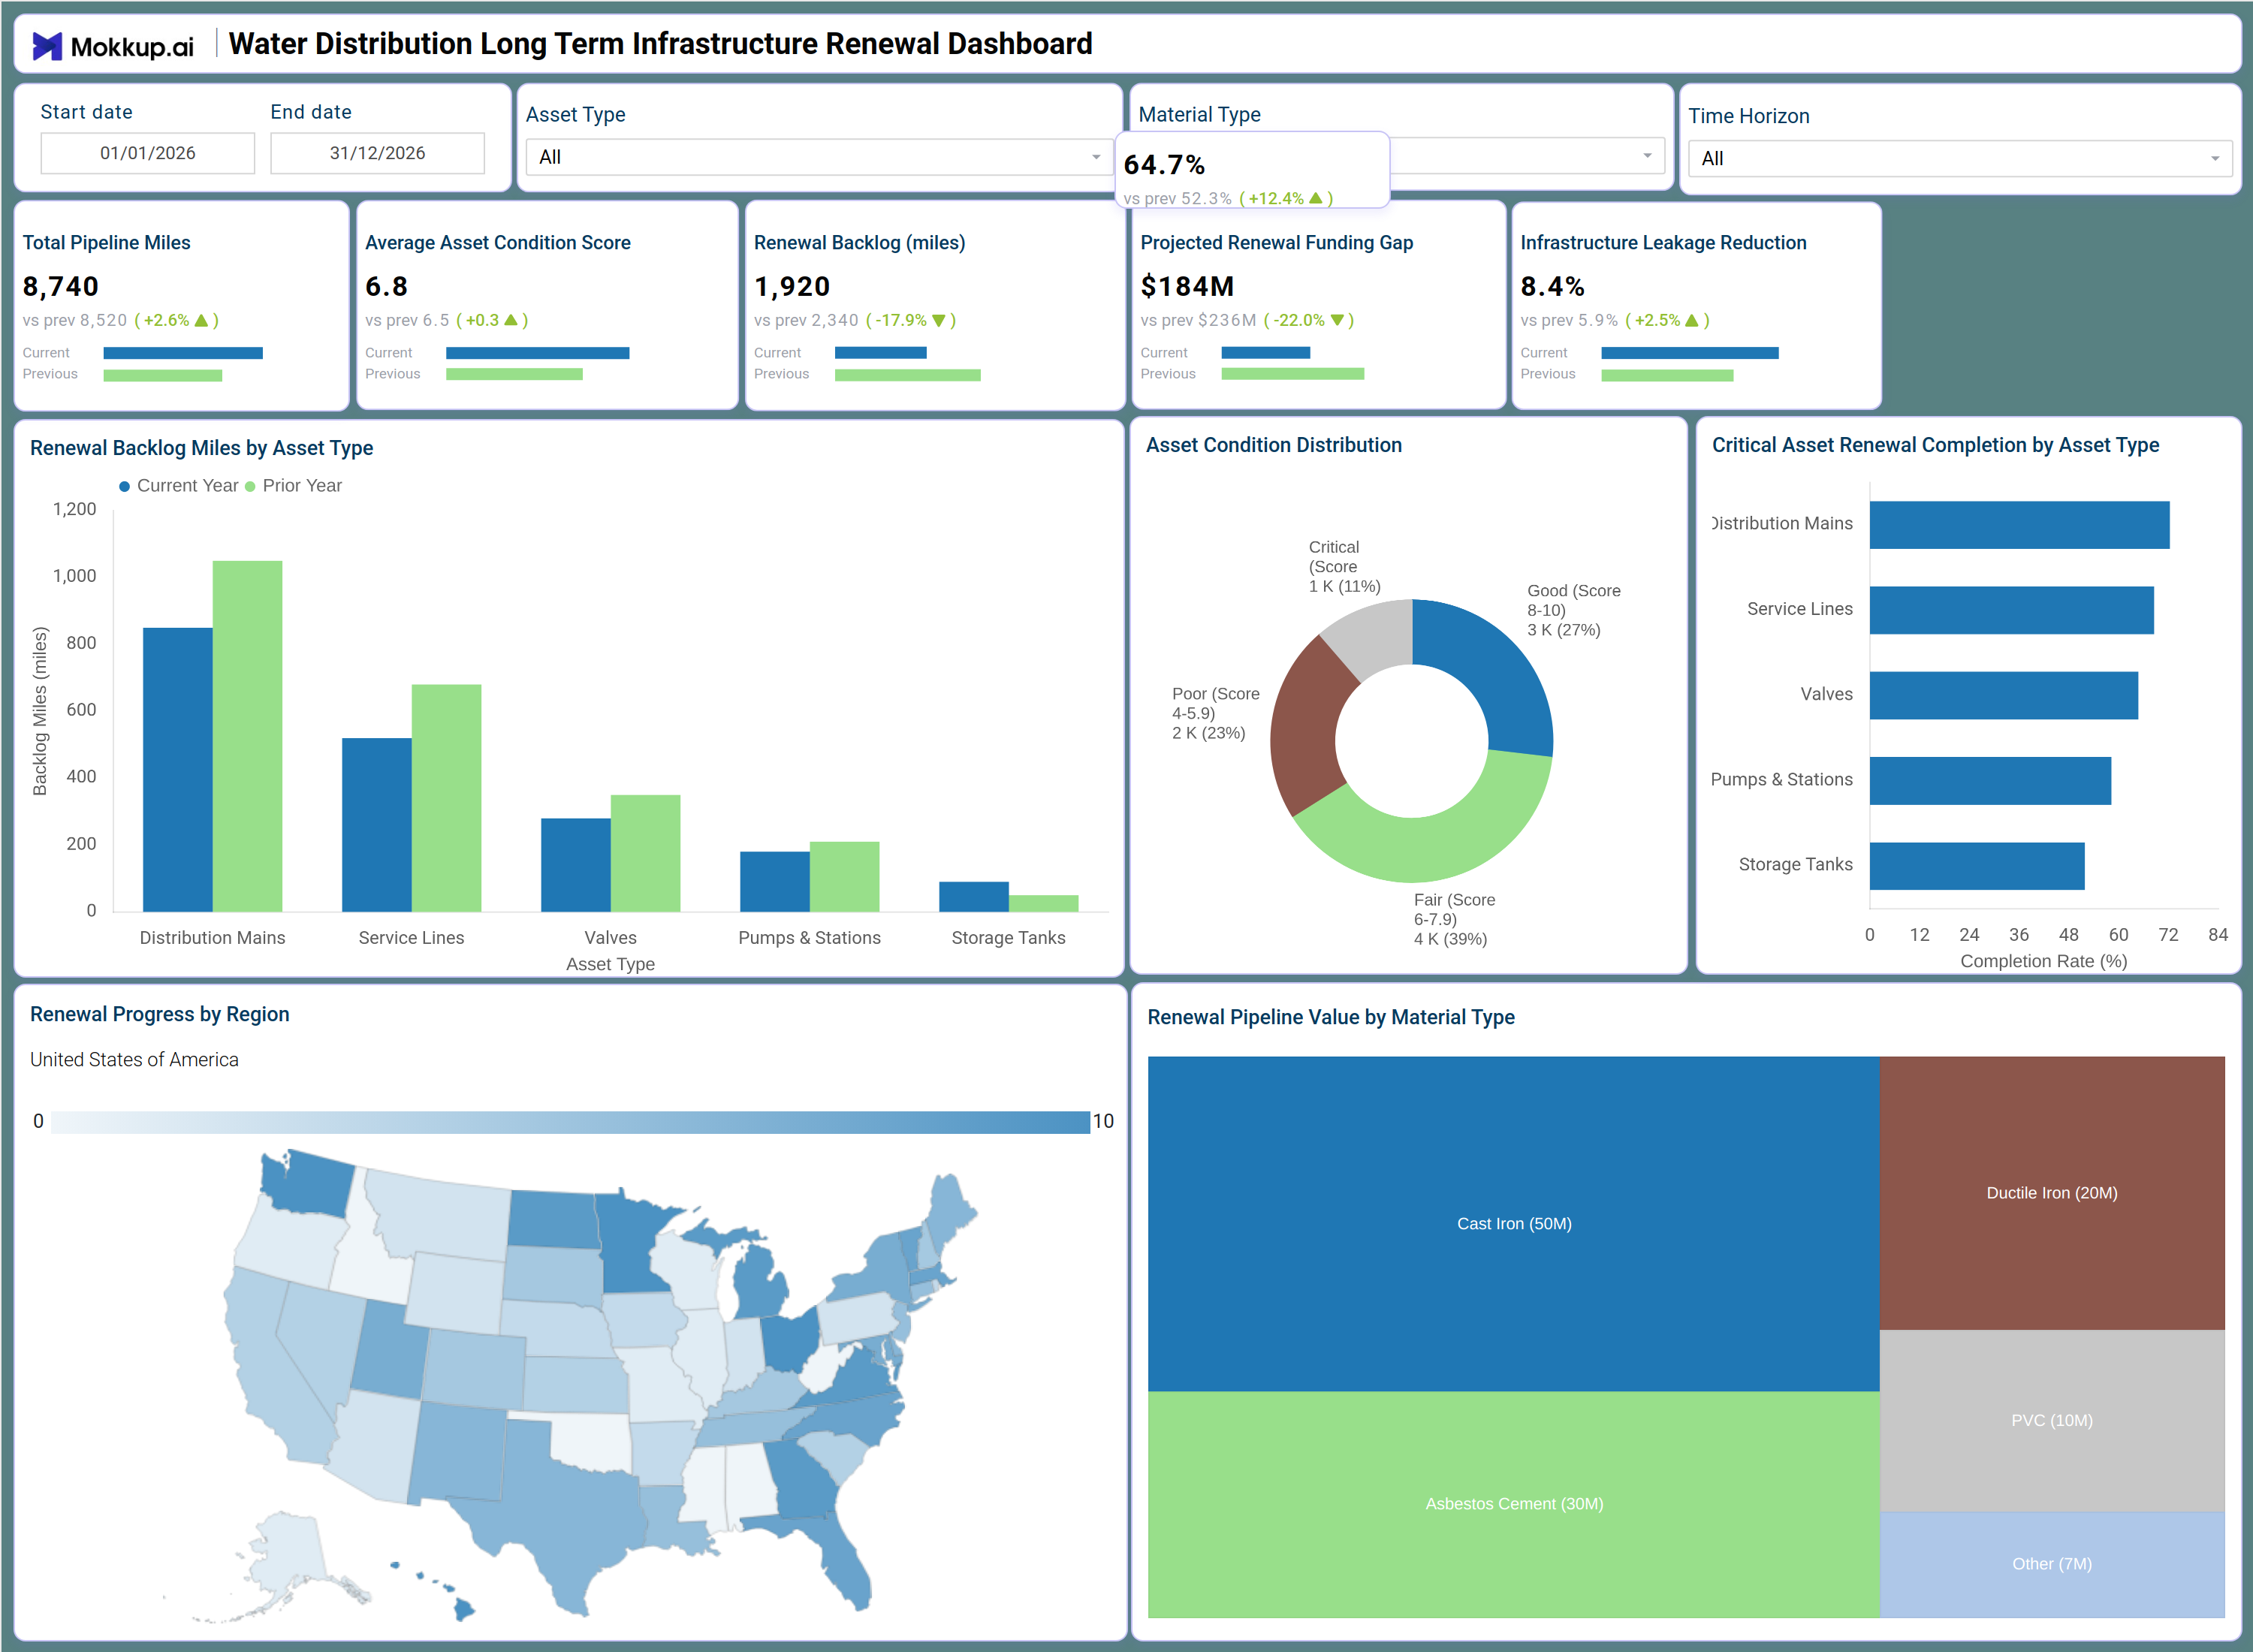
The Water Distribution Long-Term Infrastructure Renewal Dashboard is a structured planning tool designed for water utility managers, municipal infrastructure teams, and public works directors who need a consolidated view of pipeline aging, condition scoring, and capital renewal priorities across their distribution network. This water distribution infrastructure renewal dashboard brings together five core performance indicators: total pipeline miles, average asset condition score, renewal backlog in miles, projected renewal funding gap, and infrastructure leakage reduction, giving decision-makers a single pane of glass for evaluating where intervention is most critical. It supports long-term water infrastructure planning by enabling teams to assess how asset conditions have shifted year over year, what funding is needed to close renewal gaps, and how leakage reduction performance is trending across the system. Built for annual and multi-year capital planning cycles, this template helps utilities move from reactive maintenance toward structured, data-driven asset renewal strategies.
How to Create a Water Distribution Long-Term Infrastructure Renewal Dashboard
You don't need to build your report from scratch; just start with a ready-to-use dashboard template from Mokkup. Add in your data and export it however you like. Here's how to do it:
1. Create or Log in to Your Mokkup Account
Start by signing up on Mokkup.ai using your email. If you already have an account, just log in, and you'll be good to go.
2. Choose and Customize Your Dashboard Template
Find the Water Distribution Long-Term Infrastructure Renewal Dashboard template in the Templates section. Use the drag-and-drop editor to adjust KPIs, edit filters, or add elements based on your data.
3. Export to Your BI Tool
Once your dashboard wireframe is ready, use the BI Tool Export feature to send it directly to Power BI or Tableau for further analysis and enhancements. You can also download the dashboard as a PDF, PNG, or JPEG, embed it on a platform, or invite your team to collaborate.
Note: This is a Pro template. You'll need a Pro subscription on Mokkup to use and customize this dashboard wireframe. Upgrade anytime to unlock full access.
Water Distribution Long-Term Infrastructure Renewal Dashboard Example
A capital planning team at a mid-sized municipal water authority typically opens this dashboard ahead of their annual budget review to understand where the distribution network stands relative to prior-year renewal targets. The KPI row at the top gives planners an immediate read on whether total pipeline miles under management have grown, whether the average asset condition score has improved or declined, and how much of the renewal backlog remains unaddressed without needing to pull separate reports from multiple systems. Moving into the visual layer, teams use the Renewal Backlog Miles by Asset Type bar chart to compare current-year backlogs against the prior year for each asset category, making it straightforward to spot whether distribution mains or service lines are accumulating more deferred work than planned.
The Asset Condition Distribution donut chart supports pipeline renewal backlog tracking by showing what share of assets fall into critical, poor, fair, or good condition bands, helping engineers prioritize which segments need urgent capital allocation before condition deteriorates further. The Renewal Progress by Region map allows regional operations managers to identify geographies where renewal completion rates are lagging, while the Renewal Pipeline Value by Material Type treemap helps procurement and engineering teams understand which pipe materials represent the largest pending capital exposure.
How to Analyze Data in a Water Distribution Long-Term Infrastructure Renewal Dashboard
Here is how you can analyze data from this dashboard:
- Use the Asset Type filter to isolate renewal backlog and condition metrics for Distribution Mains, Service Lines, Valves, Pumps and Stations, or Storage Tanks individually.
- Use the Material Type filter to focus analysis on specific pipe materials such as Cast Iron, asbestos cement, or ductile iron, which are typically the highest priority for replacement.
- Use the Time Horizon filter to align the dashboard view with short-term, medium-term, or long-range capital planning windows for long-term water infrastructure planning.
- Review the Renewal Backlog Miles by Asset Type bar chart to identify which asset categories show year-over-year increases in deferred renewal work.
- Analyze the Asset Condition Distribution donut chart to determine what percentage of the network falls below acceptable condition thresholds using the asset condition score that water utilities rely on.
- Monitor the Critical Asset Renewal Completion by Asset Type horizontal bar chart to assess whether renewal execution rates are meeting targets across each asset class.
- Use the Renewal Progress by Region map to identify states or regions where infrastructure renewal activity is below average and requires additional resource allocation.
- Examine the Renewal Pipeline Value by Material Type treemap to understand capital exposure by pipe material and inform procurement planning aligned with the water pipeline renewal funding gap.
Benefits of a Water Distribution Long-Term Infrastructure Renewal Dashboard
The following are the benefits of using this dashboard:
- Centralizes pipeline condition, renewal backlog, and funding gap data across all asset categories in one structured planning template.
- Supports pipeline renewal backlog tracking with a year-over-year comparison view that makes deferred work immediately visible to capital planners.
- Eliminates manual data aggregation by providing pre-built KPI tiles for the five metrics most critical to infrastructure renewal decisions.
- Enables region-level analysis of renewal progress to guide resource allocation and address infrastructure leakage, reduction, and water system gaps.
- Provides a material-type breakdown of renewal pipeline value to support procurement planning and budget prioritization.
- Helps water utility teams align renewal execution with multi-year capital improvement plans without rebuilding reports each cycle.
- Gives engineering, finance, and operations teams a shared view of network condition and funding requirements.
KPIs to Track in a Water Distribution Long-Term Infrastructure Renewal Dashboard
The following key KPIs can be tracked by using this dashboard:
- Total Pipeline Miles: The total length of pipeline assets under management in the water distribution network — foundational to this water distribution infrastructure renewal dashboard for sizing renewal scope.
- Average Asset Condition Score: Tracks the network-wide mean condition rating on a standardized scale — the key asset condition score water utilities use to benchmark network health and prioritize renewal investments.
- Renewal Backlog (Miles): Quantifies the total miles of pipeline where renewal work has been deferred — the primary measure for pipeline renewal backlog tracking across the distribution system.
- Projected Renewal Funding Gap: Measures the difference between estimated renewal costs and committed capital budget — central to water pipeline renewal funding gap analysis and multi-year financial planning.
- Infrastructure Leakage Reduction: Tracks the percentage improvement in leakage reduction achieved through renewal activity — a direct outcome measure linking infrastructure leakage reduction, water system investments, and operational performance gains.
- Critical Asset Renewal Completion Rate: Measures the percentage of critical assets that have completed renewal within the planning period by asset type, supporting long-term water infrastructure planning accountability.
Frequently Asked Questions
1. What types of water utilities benefit most from this dashboard?
Municipal water authorities, regional water districts, and public works departments managing aging distribution networks benefit most. It is particularly valuable for teams running multi-year capital improvement plans where condition scoring and backlog tracking are central to funding decisions.
2. Can this dashboard compare renewal performance across different asset types?
Yes. The Renewal Backlog Miles by Asset Type bar chart and the Critical Asset Renewal Completion by Asset Type chart both break down performance across Distribution Mains, Service Lines, Valves, Pumps and Stations, and Storage Tanks, allowing direct comparison across asset categories.
3. Is this dashboard suitable for multi-year capital planning cycles?
Yes. The Time Horizon filter allows teams to align the dashboard view with short, medium, or long-range planning windows. Combined with the Projected Renewal Funding Gap KPI, it supports structured budget planning across multiple fiscal years.