
What Is a Water Conservation & Sustainability Dashboard
A water conservation dashboard for utilities is a centralized analytics platform that monitors, analyzes, and optimizes water-use, efficiency, and sustainability metrics. It consolidates data from multiple sources—such as water supply networks, wastewater treatment plants, and customer consumption—into actionable insights for municipalities, utility managers, and environmental engineers. By tracking sustainable water management KPIs, this dashboard helps organizations identify inefficiencies, reduce nonrevenue water (NRW), and improve compliance with regulatory standards. Unlike traditional reporting methods, a data-driven water conservation reporting platform offers interactive visualizations, trend analysis, and performance benchmarks. This enables utilities to make informed decisions on infrastructure upgrades, demand management, and conservation programs. Whether tracking wastewater efficiency monitoring or potable water reuse volumes, the dashboard serves as a single source of truth for water sustainability initiatives.
How to Create a Water Conservation & Sustainability Dashboard
You don't need to build your report from scratch, just start with a ready to use dashboard template from Mokkup. Add in your data and export it however you like. Here's how to do it:
1. Create or Log in to Your Mokkup Account
Start by signing up on Mokkup.ai using your email. If you already have an account, just log in, and you'll be good to go.
2. Choose and Customize Your Dashboard Template
Find the Water Conservation & Sustainability Dashboard template in the Templates section. Use the drag-and-drop editor to adjust KPIs, edit filters, or add elements based on your data.
3. Export to Your BI Tool
Once your dashboard wireframe is ready, use the BI Tool Export feature to send it directly to Power BI or Tableau for further analysis and enhancements. You can also download the dashboard as a PDF, PNG, or JPEG, embed it on a platform, or invite your team to collaborate.
Note: This is a Pro template. You'll need a Pro subscription on Mokkup to use and customize this dashboard wireframe. Upgrade anytime to unlock full access.
Water Conservation & Sustainability Dashboard Example
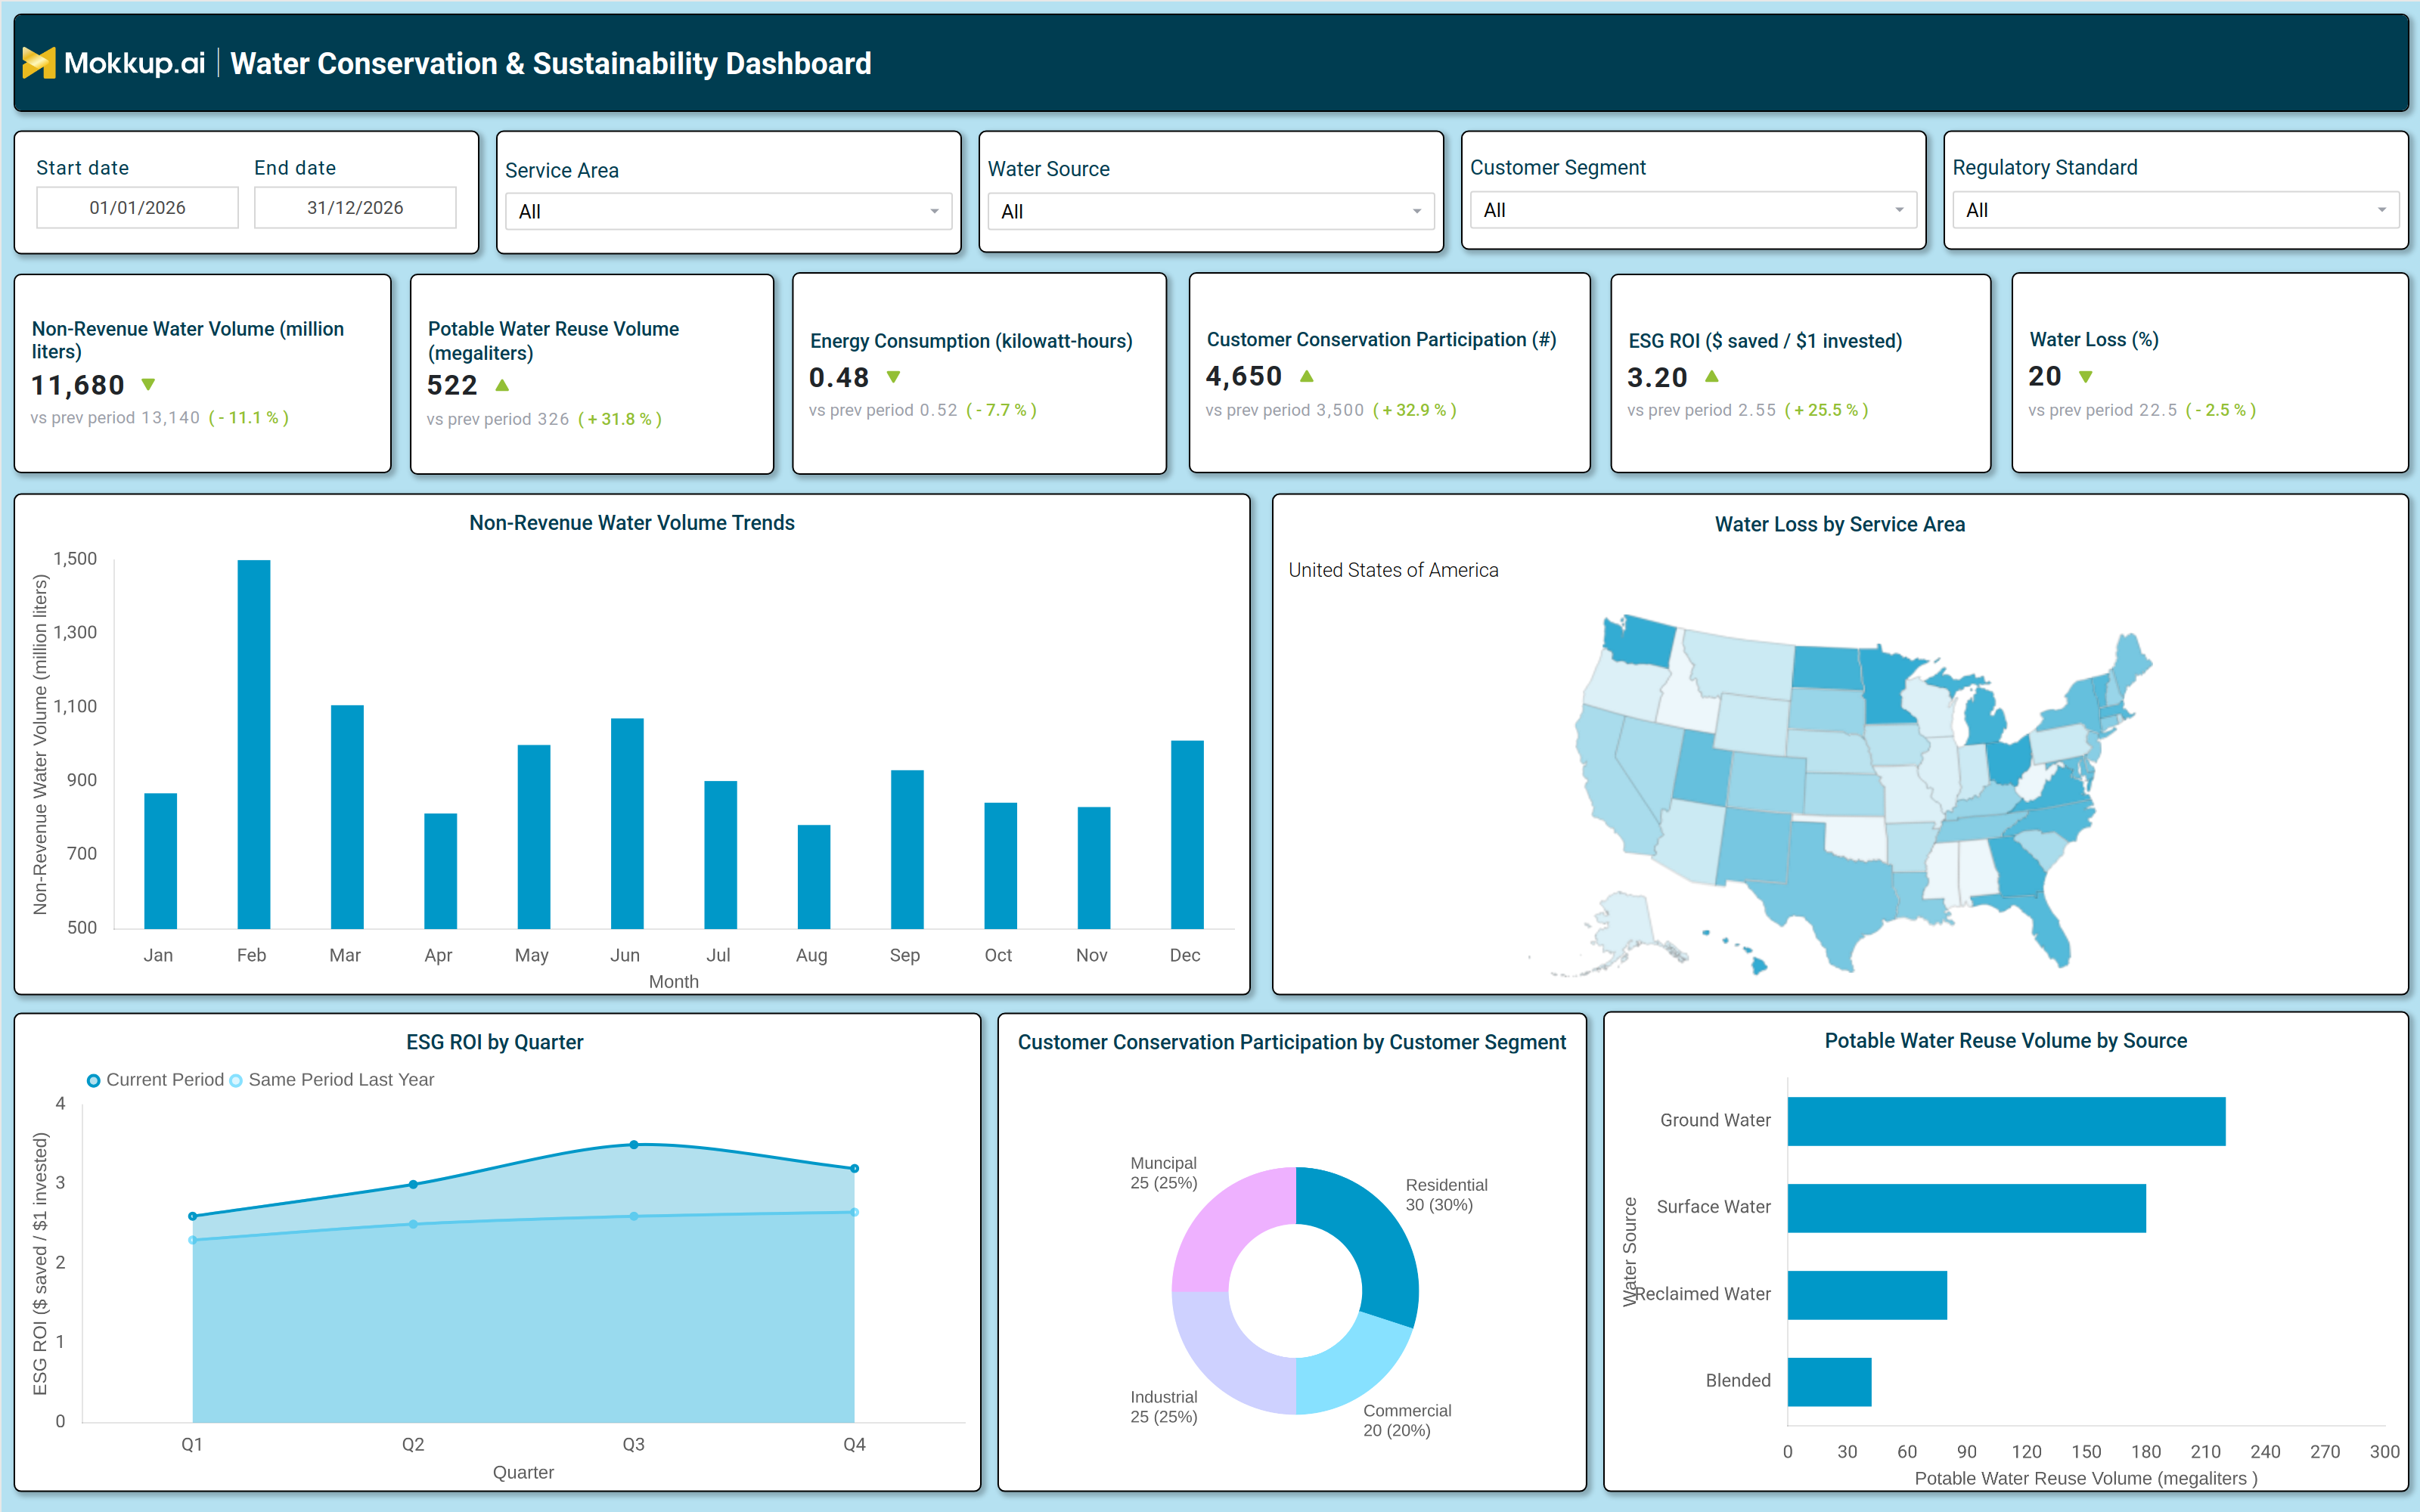
A well-designed water conservation dashboard includes key performance indicators (KPIs) such as nonrevenue water volume, potable water reuse, energy consumption, customer conservation participation, ESG ROI, and water loss percentage. The dashboard typically features interactive filters for date ranges, service areas, water sources, customer segments, and regulatory standards, allowing users to drill down into specific datasets. For instance, the dashboard may display nonrevenue water trends over time, highlighting spikes in losses that require immediate attention. A water loss by service area map helps utilities pinpoint regions with the highest inefficiencies, while a breakdown of potable water reuse volume shows contributions from groundwater, surface water, and reclaimed sources. Additionally, ESG ROI trends compare financial savings against sustainability investments, demonstrating the economic benefits of conservation efforts. Together, these components provide a comprehensive view of water management performance, enabling utilities to optimize operations and meet sustainability goals.
How to Analyze Data in a Water Conservation & Sustainability Dashboard
Here is how you can analyze data from this customer conservation participation dashboard:
- Non-Revenue Water (NRW) Trends: Monitor water losses over time to detect leaks, theft, or metering inaccuracies affecting revenue.
- Potable Water Reuse by Source: Compare reuse volumes across different sources to evaluate the effectiveness of alternative supply strategies.
- Energy Consumption in Treatment & Distribution: Track energy usage to identify cost-saving opportunities and improve operational efficiency.
- Customer Conservation Participation: Measure engagement in conservation programs to assess the impact of awareness initiatives.
- ESG Return on Investment (ROI): Evaluate sustainability investments to justify spending and support future funding decisions.
- Water Loss by Service Area (%): Analyze losses across regions to prioritize infrastructure upgrades and repair efforts.
- Regulatory Compliance Tracking: Ensure adherence to local and federal water standards to avoid penalties and maintain reliability.
- Historical Performance Benchmarking: Compare current metrics with past data to track progress in conservation and efficiency efforts.
Benefits of a Water Conservation & Sustainability Dashboard
The following are the benefits of using this potable water reuse tracking dashboard:
- Reduced Water Waste: Identify leaks, inefficiencies, and high-loss areas to minimize water wastage across operations.
- Lower Operational Costs: Optimize energy usage and reduce non-revenue water to improve overall cost efficiency.
- Improved Regulatory Compliance: Monitor water quality and usage to stay aligned with regulatory standards and requirements.
- Enhanced Sustainability Reporting: Leverage data-driven ESG metrics to strengthen environmental reporting and accountability.
- Better Demand Management: Track customer participation in conservation programs to manage demand more effectively.
- Proactive Maintenance Enablement: Use predictive analytics to monitor infrastructure health and address issues before they escalate.
- Stronger Business Case for Conservation: Demonstrate ROI to justify investments in water conservation and efficiency programs.
- Data-Driven Long-Term Planning: Support strategic water resource planning with actionable insights and trend analysis.
KPIs to Track in a Water Conservation & Sustainability Dashboard
The following key KPIs can be tracked by using this customer conservation participation dashboard:
- Non Revenue Water Volume (million liters): Measures water lost due to leaks, theft, or metering errors.
- Potable Water Reuse Volume (megaliters): Tracks the volume of treated wastewater reused for drinking or irrigation.
- Energy Consumption (kilowatt-hours): Monitors energy used in water treatment and distribution.
- Customer Conservation Participation (#): Counts the number of customers engaged in water-saving programs.
- ESG ROI ($ saved / $1 invested): Evaluates the financial return on sustainability investments.
- Water Loss (%): Calculates the percentage of water lost in distribution networks.
- Regulatory Compliance Rate (%): Assesses adherence to water quality and usage regulations.
Frequently Asked Questions
1. What is a sustainable water management dashboard used for?
A water-conservation dashboard for utilities helps track water usage, identify inefficiencies, and optimize sustainability efforts. It gives insight into nonrevenue water, energy consumption, and customer conservation programs.
2. Can this non-revenue water monitoring dashboard integrate with existing utility software?
Yes, most water sustainability KPI dashboard solutions support integration with ERP, SCADA, and GIS systems for seamless data flow.
3. Who should use a water utility ESG performance dashboard?
Municipalities, utility managers, environmental engineers, and policymakers use these dashboards to monitor water efficiency, reduce waste, and ensure regulatory compliance.