
What is a Hydropower Sustainability & Regulatory Compliance Dashboard?
A hydropower sustainability compliance dashboard is a centralized digital system designed to monitor environmental performance, regulatory adherence, and ESG metrics across hydroelectric facilities. It consolidates sustainability indicators related to carbon intensity, water usage, ecological flow compliance, biodiversity protection, dam safety, and community impact into a single operational view.
This dashboard supports utilities by providing real-time visibility into environmental and regulatory obligations associated with hydropower operations. Acting as a hydropower regulatory compliance dashboard, it enables environmental managers, compliance teams, and plant leadership to track permits, audits, and safety requirements while maintaining alignment with ESG standards. By integrating ecological performance metrics with governance and compliance data, the system functions as a hydro power ESG monitoring dashboard. It ensures transparent reporting, reduces regulatory risk, and supports responsible resource management across hydroelectric assets, making it essential for sustainable utility operations.
How to Create a Hydropower Sustainability & Regulatory Compliance Dashboard Template
You don’t need to build your report from scratch, just start with a ready-to-use dashboard template from Mokkup. Add in your data and export it however you like. Here’s how to do it:
1. Create or Log in to Your Mokkup Account
Start by signing up on Mokkup.ai using your email. If you already have an account, just log in, and you’ll be good to go.
2. Choose and Customize Your Dashboard Template
Find the Hydropower Sustainability & Regulatory Compliance Dashboard template in the Templates section. Use the drag-and-drop editor to adjust KPIs, edit filters, or add elements based on your data.
3. Export to Your BI Tool
Once your dashboard wireframe is ready, use the BI Tool Export feature to send it directly to Power BI or Tableau for further analysis and enhancements. You can also download the dashboard as a PDF, PNG, or JPEG, embed it on a platform, or invite your team to collaborate.
Note: This is a Pro template. You’ll need a Pro subscription on Mokkup to use and customize this dashboard wireframe. Upgrade anytime to unlock full access.
Hydropower Sustainability & Regulatory Compliance Dashboard Example
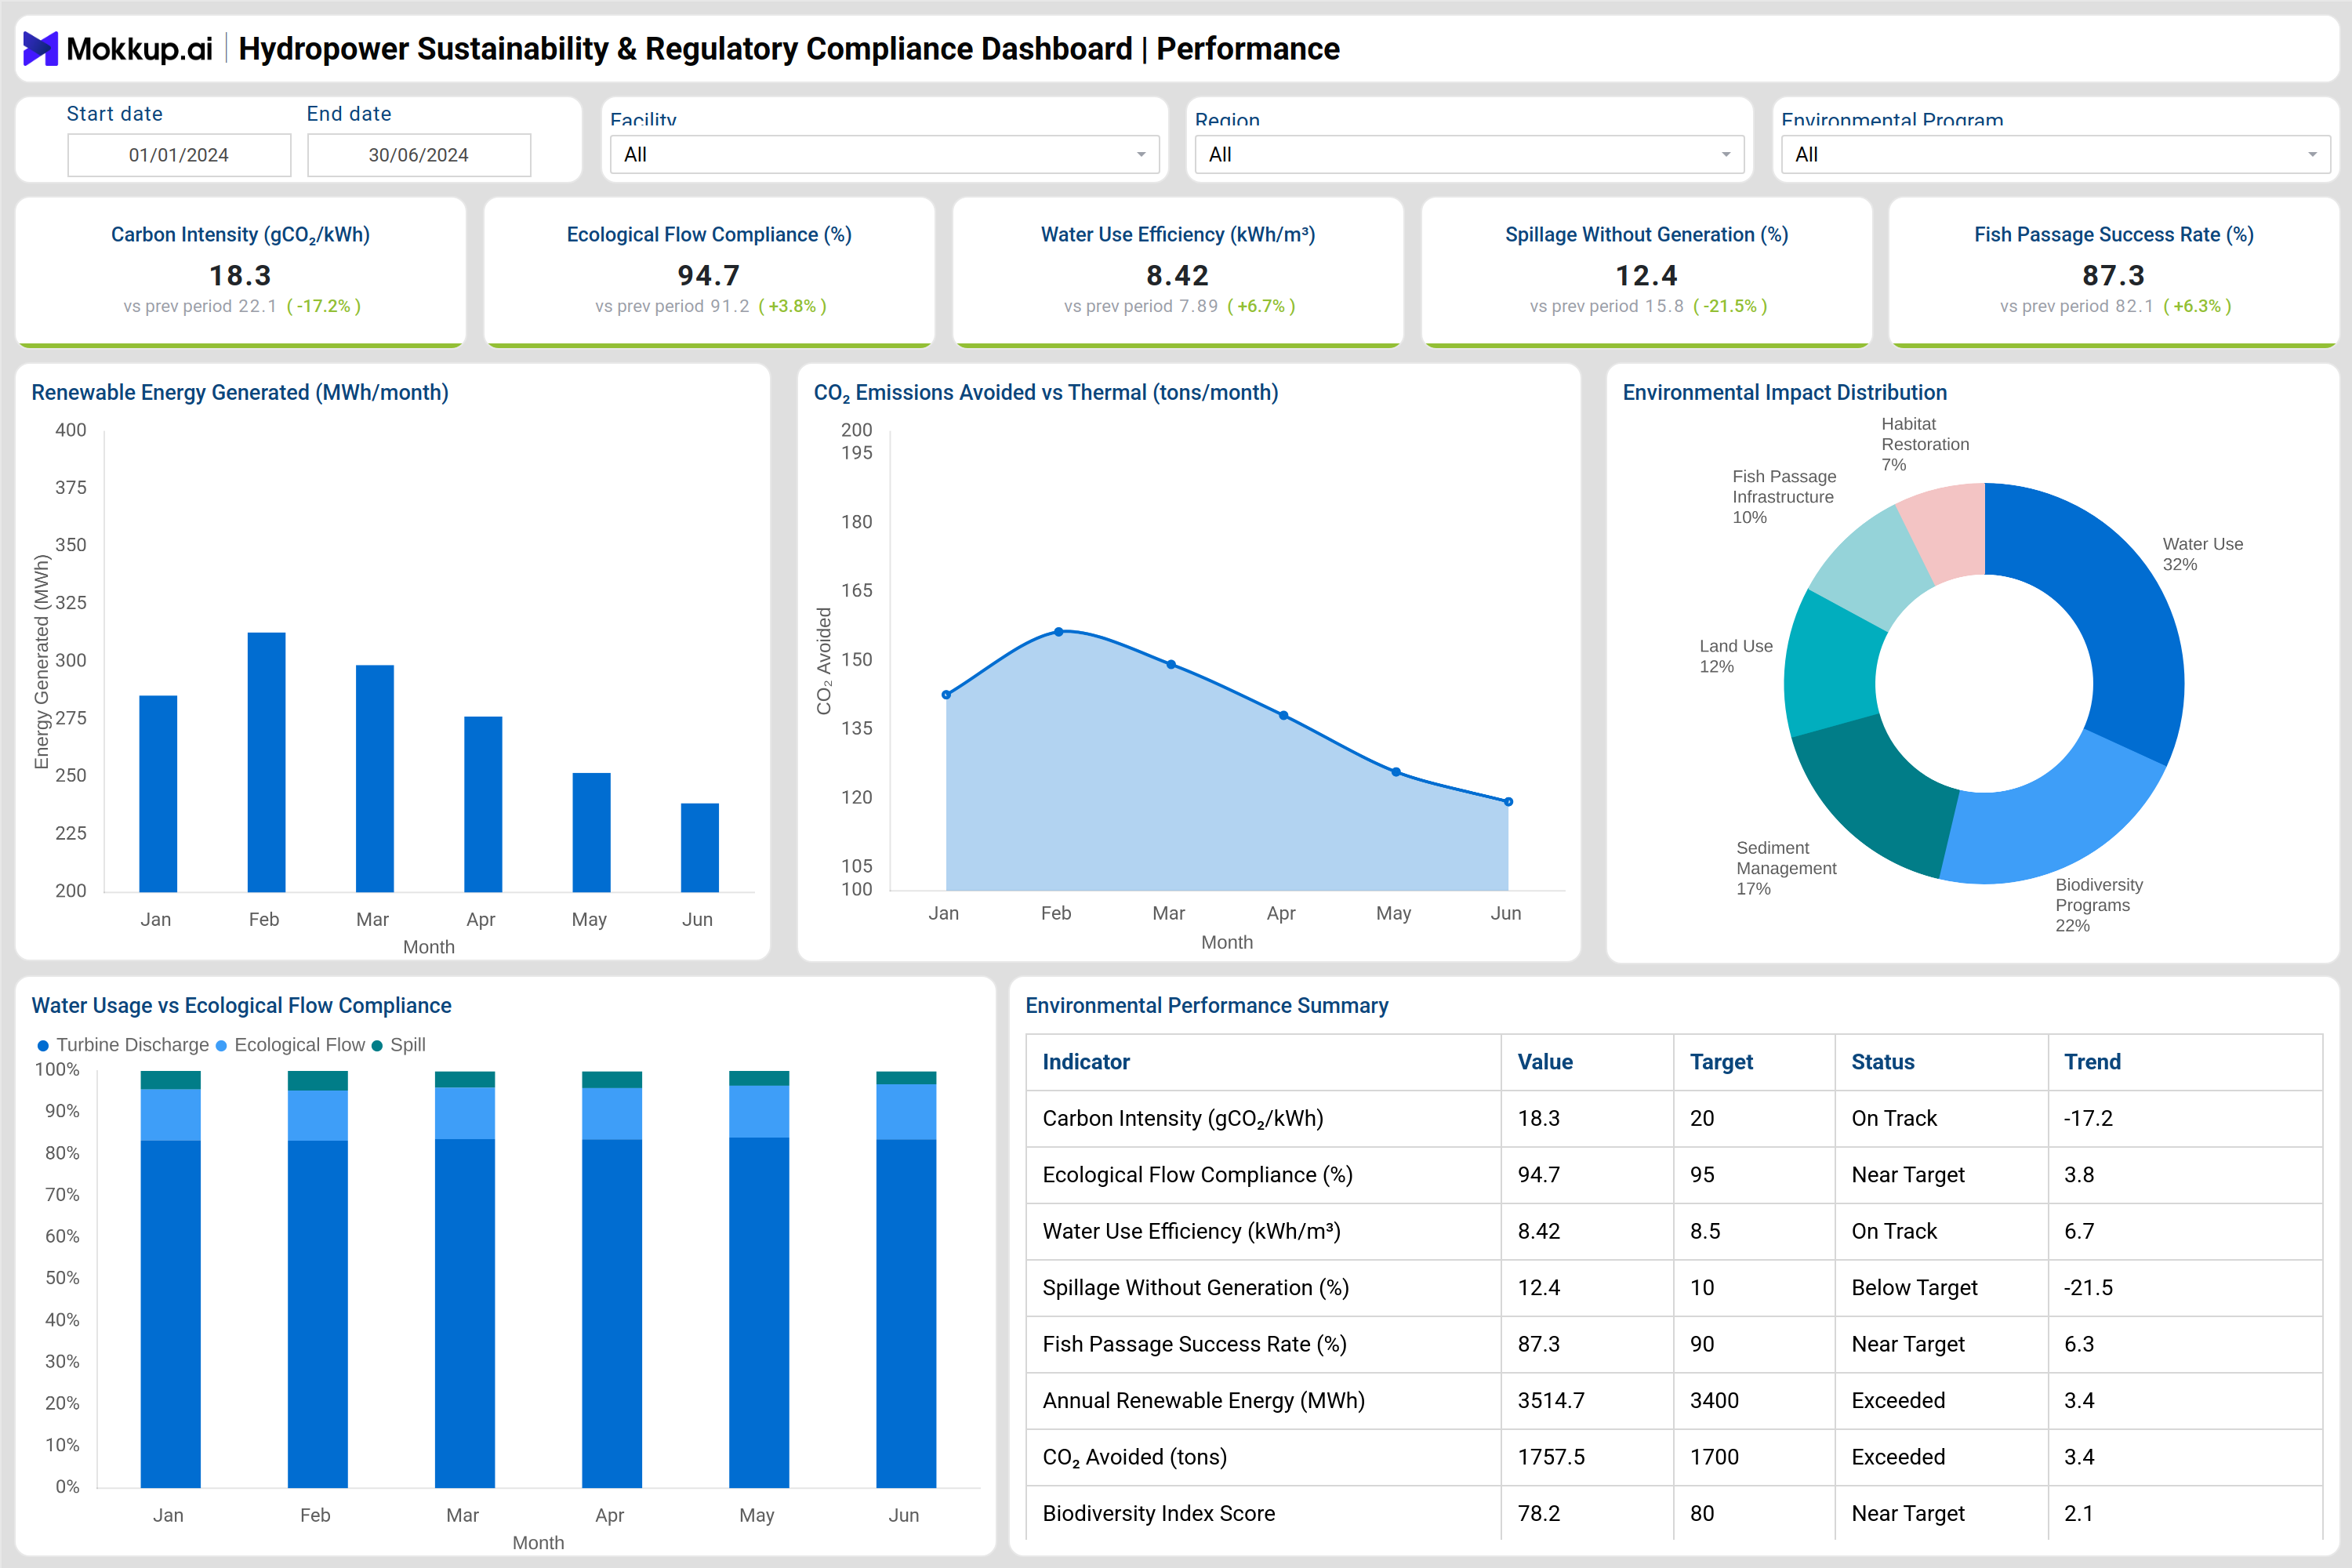
You can build a Hydropower Sustainability & Regulatory Compliance Dashboard using two primary analytical sections: Performance and Compliance & Dam Safety. The Performance section provides a comprehensive view of environmental impact and resource efficiency. It tracks carbon intensity, ecological flow compliance, water use efficiency, spillage without generation, and fish passage success rate.
These indicators enable utilities to assess the effectiveness of hydropower generation in aligning with environmental protection goals. Visuals, such as charts highlighting renewable energy generated, show monthly clean energy output, while trends in CO₂ emissions avoided illustrate the environmental benefits of hydropower compared to thermal generation. Environmental impact distribution charts break down focus areas, including water use, biodiversity programs, sediment management, land use, and habitat restoration. Water usage versus ecological flow compliance visuals help operators strike a balance between power generation and the requirements of downstream ecosystems.
The Compliance & Dam Safety section focuses on governance, safety, and social responsibility. It displays regulatory compliance rate, permit exceedances, dam safety compliance, sediment management compliance, and environmental monitoring station uptime. Dam safety activity charts track inspections, maintenance, and instrumentation checks, while permit utilization trends provide insight into regulatory capacity usage. Additional modules, such as compliance rate by regulation type, audit schedule adherence, community grievance distribution, and regulatory readiness summaries, ensure that environmental, safety, and social commitments are tracked in a transparent and auditable manner. Together, these views form a complete hydropower environmental compliance dashboard and hydroelectric sustainability performance dashboard.
How to Analyze Data in a Hydropower Sustainability & Regulatory Compliance Dashboard
Here is how you can analyze data from this dashboard:
- Review carbon intensity trends to evaluate emission performance per unit of energy generated.
- Monitor ecological flow compliance to ensure downstream environmental requirements are met.
- Analyze water use efficiency to assess how effectively water resources are utilized to generate energy.
- Track spillage without generation to identify energy loss and operational inefficiencies.
- Review fish passage success rates to evaluate the effectiveness of biodiversity protection measures.
- Compare renewable energy generation trends with environmental targets.
- Analyze CO₂ emissions avoided to quantify climate impact benefits.
- Monitor regulatory compliance rates and permit exceedances to reduce audit risk.
- Track dam safety compliance and inspection completion to ensure infrastructure integrity.
- Review community grievance trends to manage social impact and stakeholder concerns.
Benefits of Hydropower Sustainability & Regulatory Compliance Dashboard
The following are the benefits of using this dashboard:
- Enhances visibility into hydropower ESG performance and sustainability metrics.
- Improves compliance with environmental and regulatory requirements.
- Reduces regulatory and operational risk through early detection of issues.
- Supports transparent ESG and sustainability reporting.
- Strengthens dam safety and infrastructure governance.
- Optimizes water and resource utilization.
- Improves biodiversity and ecosystem protection monitoring.
- Supports community engagement and grievance resolution.
KPIs to Track in a Hydropower Sustainability & Regulatory Compliance Dashboard
The following key KPIs can be tracked by using this dashboard:
- Carbon Intensity (gCO₂/kWh) – Measures emissions intensity of hydropower generation.
- Ecological Flow Compliance (%) – Tracks adherence to mandated environmental flow requirements.
- Water Use Efficiency (kWh/m³) – Measures energy generated per unit of water used.
- Spillage Without Generation (%) – Indicates water released without power generation.
- Fish Passage Success Rate (%) – Measures the effectiveness of fish migration infrastructure.
- Renewable Energy Generated (MWh) – Tracks total clean energy produced by hydropower assets.
- CO₂ Emissions Avoided (tons) – Quantifies emissions avoided versus thermal generation.
- Regulatory Compliance Rate (%) – Measures overall adherence to regulatory requirements.
- Permit Exceedances (count) – Tracks violations of permitted operational limits.
- Dam Safety Compliance (%) – Measures compliance with dam safety standards.
- Sediment Management Compliance (%) – Tracks adherence to sediment control requirements.
- Community Grievance Resolution Rate (%) – Measures effectiveness in resolving community concerns.
- Environmental Monitoring Station Uptime (%) – Tracks availability of environmental monitoring systems.
Frequently Asked Questions
1. Why is a hydropower sustainability compliance dashboard important?
It provides insights into environmental impact, regulatory adherence, and ESG performance, helping utilities operate responsibly.
2. What type of data does the dashboard track?
It tracks carbon emissions, water usage, ecological flows, biodiversity indicators, regulatory compliance, and dam safety metrics.
3. Can this dashboard support ESG reporting?
Yes. It serves as a centralized ESG monitoring dashboard for hydro power, aligned with sustainability disclosures and regulatory frameworks.
4. Who uses this dashboard in a hydropower utility?
Environmental managers, compliance officers, dam safety teams, operations managers, ESG leaders, and executives.
5. Does the dashboard help reduce environmental and regulatory risk?
Yes. Continuous monitoring enables early identification of compliance gaps and sustainability risks.