
What is a Wastewater Utilities Revenue & Recovery Dashboard?
The Wastewater Utilities Revenue & Recovery Dashboard is a purpose-built analytics tool designed for utility finance managers, operations directors, and municipal budget analysts responsible for monitoring billing performance and cost accountability across wastewater systems. This wastewater utilities revenue recovery dashboard template consolidates critical financial signals from monthly revenue collections and stormwater fee recovery to delinquent accounts receivable balance tracking into a single, structured view. Unlike generic financial dashboards, it is built around the specific fee structures, customer segments, and geographic distribution that define how water utilities generate and recover revenue. Finance teams managing municipal wastewater revenue performance monitoring rely on this dashboard to identify where collections are lagging, where costs are outpacing recoveries, and which customer segments or geographic zones require intervention. The dashboard supports decisions across billing cycles, delinquency management, and cost-allocation planning, giving utility leaders the financial intelligence they need to protect long-term fiscal health.
How to Create a Wastewater Utilities Revenue & Recovery Dashboard
You don't need to build your report from scratch; just start with a ready-to-use dashboard template from Mokkup. Add in your data and export it however you like. Here's how to do it:
1. Create or Log in to Your Mokkup Account
Start by signing up on Mokkup.ai using your email. If you already have an account, just log in, and you'll be good to go.
2. Choose and Customize Your Dashboard Template
Find the Wastewater Utilities Revenue & Recovery Dashboard template in the Templates section. Use the drag-and-drop editor to adjust KPIs, edit filters, or add elements based on your data.
3. Export to Your BI Tool
Once your dashboard wireframe is ready, use the BI Tool Export feature to send it directly to Power BI or Tableau for further analysis and enhancements. You can also download the dashboard as a PDF, PNG, or JPEG, embed it on a platform, or invite your team to collaborate.
Note: This is a Pro template. You'll need a Pro subscription on Mokkup to use and customize this dashboard wireframe. Upgrade anytime to unlock full access.
Wastewater Utilities Revenue & Recovery Dashboard Example
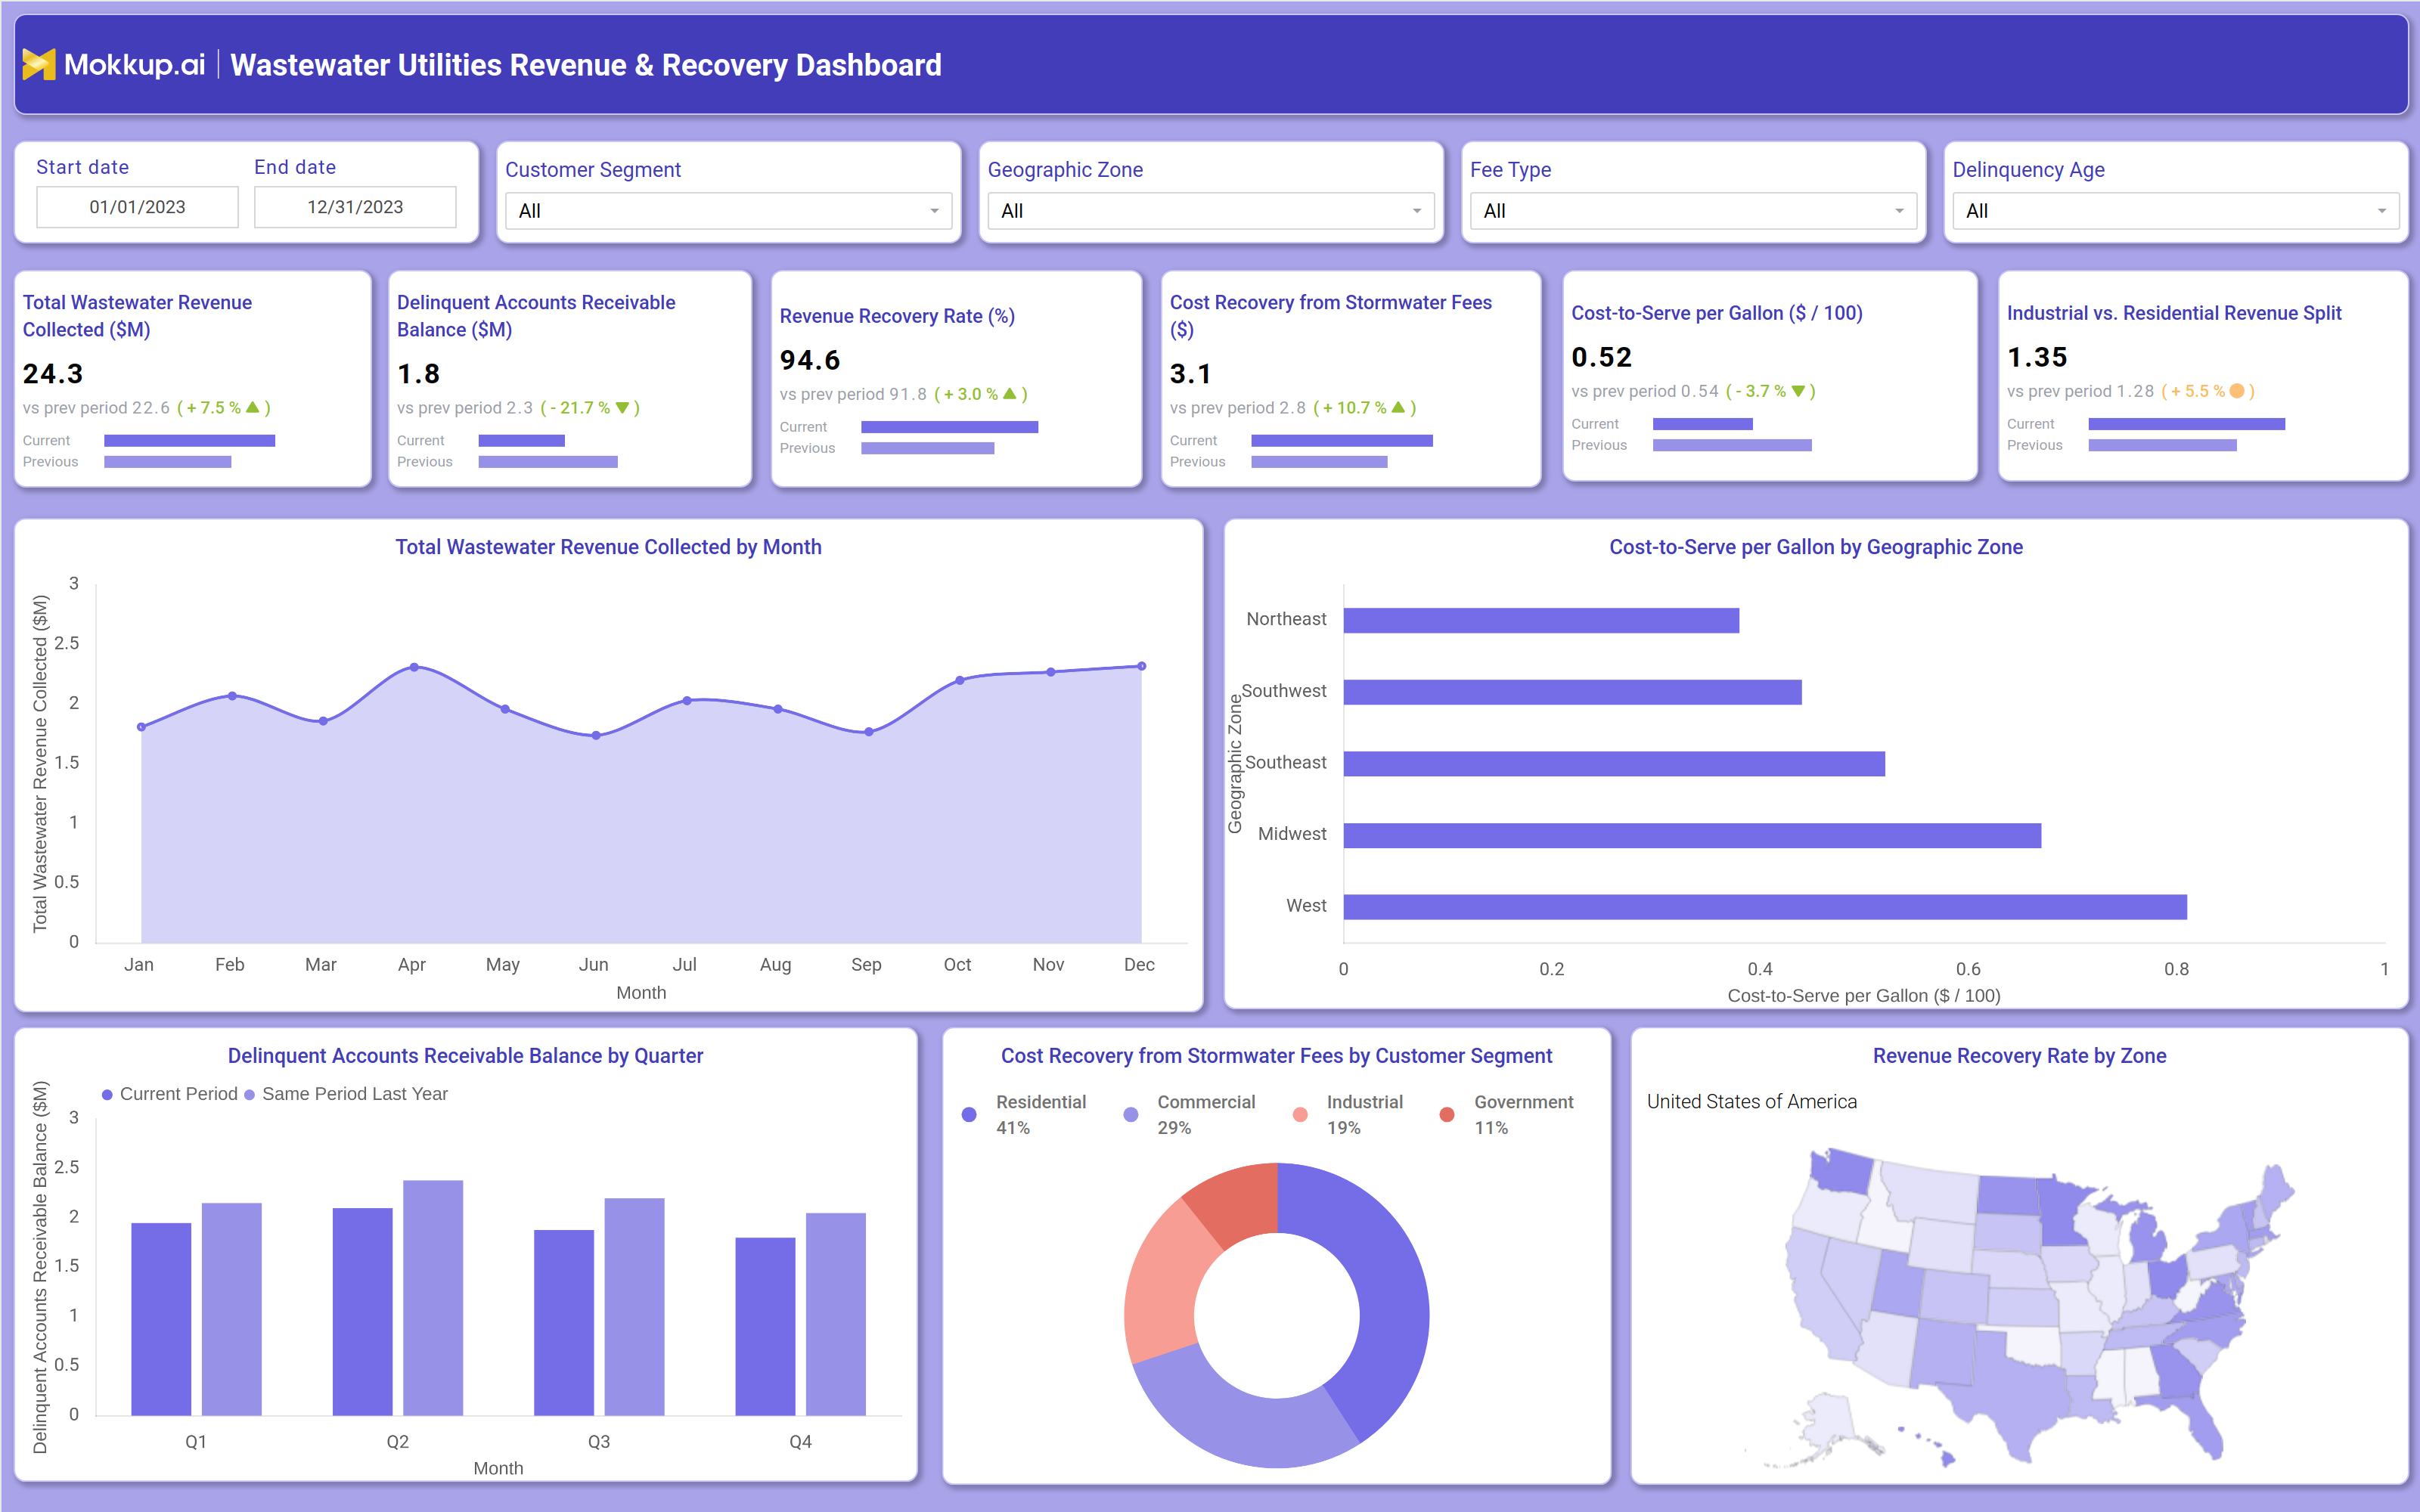
A utility finance director opens this dashboard at the start of each billing cycle to assess whether the organization is on track against its revenue targets. The top KPI row provides an immediate read on total wastewater revenue collected, whether the revenue recovery rate is improving or eroding versus the prior period, and how the cost of delivering services compares to what is being recovered through fees. These headline figures allow the director to decide in minutes whether further investigation is warranted before the next reporting period closes.
The monthly revenue trend line helps the team understand seasonal patterns and whether collection volumes are consistent with budget expectations. When collections dip in specific months, finance analysts can apply the Customer Segment or Geographic Zone filters to isolate where the shortfall originates, whether it is residential customers in one region or industrial accounts across the system. The wastewater billing delinquency tracking dashboard view, surfaced through the quarterly delinquent accounts receivable balance chart, shows whether overdue balances are growing quarter-over-quarter or stabilizing, giving collections teams a data-driven basis for escalation decisions.
For cost accountability, the stormwater fee cost recovery analytics tool embedded in this dashboard allows planners to assess what portion of stormwater fee costs are being recovered by residential, commercial, industrial, or government. If one segment consistently underperforms, rate-setting conversations can be grounded in evidence rather than assumptions. The cost-to-serve per gallon wastewater utility KPIs broken out by geographic zone help identify where operational expenditure is disproportionate and where infrastructure or service delivery changes could improve efficiency. Taken together, this dashboard equips utility leadership with the financial clarity to manage delinquency, justify rate decisions, and report on fiscal performance with confidence. Teams no longer need to compile data from disconnected billing and operations systems; the dashboard surfaces the patterns that matter, enabling faster, better-grounded decisions across the revenue cycle.
How to Analyze Data in a Wastewater Utilities Revenue & Recovery Dashboard
Here is how you can analyze data from this dashboard:
- Filter by Customer Segment to compare revenue and delinquency trends across residential, commercial, industrial, and government accounts
- Use the Geographic Zone filter to isolate cost-to-serve and recovery rate performance by region
- Track monthly revenue trend patterns to identify seasonal dips or billing cycle anomalies
- Compare current period delinquent accounts receivable balance against the same period last year to assess collection trajectory
- Review the stormwater fee cost recovery breakdown by segment to evaluate cross-segment equity in rate design
- Apply the Delinquency Age filter to prioritize collections outreach on aging overdue accounts
- Use the US geographic map to pinpoint revenue recovery gaps by zone and focus remediation efforts
Benefits of a Wastewater Utilities Revenue & Recovery Dashboard
The following are the benefits of using this dashboard:
- Consolidates billing, cost recovery, and delinquency data into one view for faster financial decision-making
- Supports delinquent accounts receivable balance water utility teams with quarterly trend visibility
- Enables stormwater fee cost recovery analytics across four distinct customer segments
- Helps rate-setting analysts justify pricing decisions with data on cost-to-serve per gallon by region
- Reduces dependency on manual reporting across billing and operations systems
- Improves accountability in municipal wastewater revenue performance monitoring cycles
- Provides a reusable wireframe teams can adapt for Power BI or Tableau without rebuilding from scratch
KPIs to Track in a Wastewater Utilities Revenue & Recovery Dashboard
The following key KPIs can be tracked by using this dashboard:
- Total Wastewater Revenue Collected ($M): measures total revenue billed and collected across all customer segments and fee types within the reporting period
- Delinquent Accounts Receivable Balance ($M): tracks the total outstanding balance of overdue accounts, indicating the scale of uncollected revenue
- Revenue Recovery Rate (%): the percentage of billed revenue successfully collected, a core indicator of billing effectiveness and customer payment compliance
- Cost Recovery from Stormwater Fees ($): measures how much operational cost is offset by stormwater fee collections across customer segments
- Cost-to-Serve per Gallon ($ / 100): calculates the operational expense per unit of service delivered, benchmarked across geographic zones
- Industrial vs. Residential Revenue Split: compares the revenue contribution ratio between industrial and residential customers, informing segment-specific rate strategies
Frequently Asked Questions
1. What makes this dashboard different from a general finance dashboard?
This dashboard is specifically structured around wastewater utility revenue streams, stormwater fee types, customer segment billing, and geographic zone performance metrics that general finance dashboards do not account for. It is built for utility finance teams, not generic business reporting.
2. Can this dashboard support rate-setting and budget planning discussions?
Yes. The cost-to-serve per gallon wastewater utility KPIs and stormwater fee cost recovery analytics tool provide the segment-level and zone-level cost data that rate-setting committees require to make defensible pricing decisions. Finance teams can use it as an evidence base in budget planning cycles.
3. Who is the target user for this dashboard?
This dashboard is designed for utility finance directors, billing managers, and municipal operations analysts who need a structured view of wastewater billing delinquency tracking, revenue recovery rates, and cost allocation across customer segments and geographic regions.