
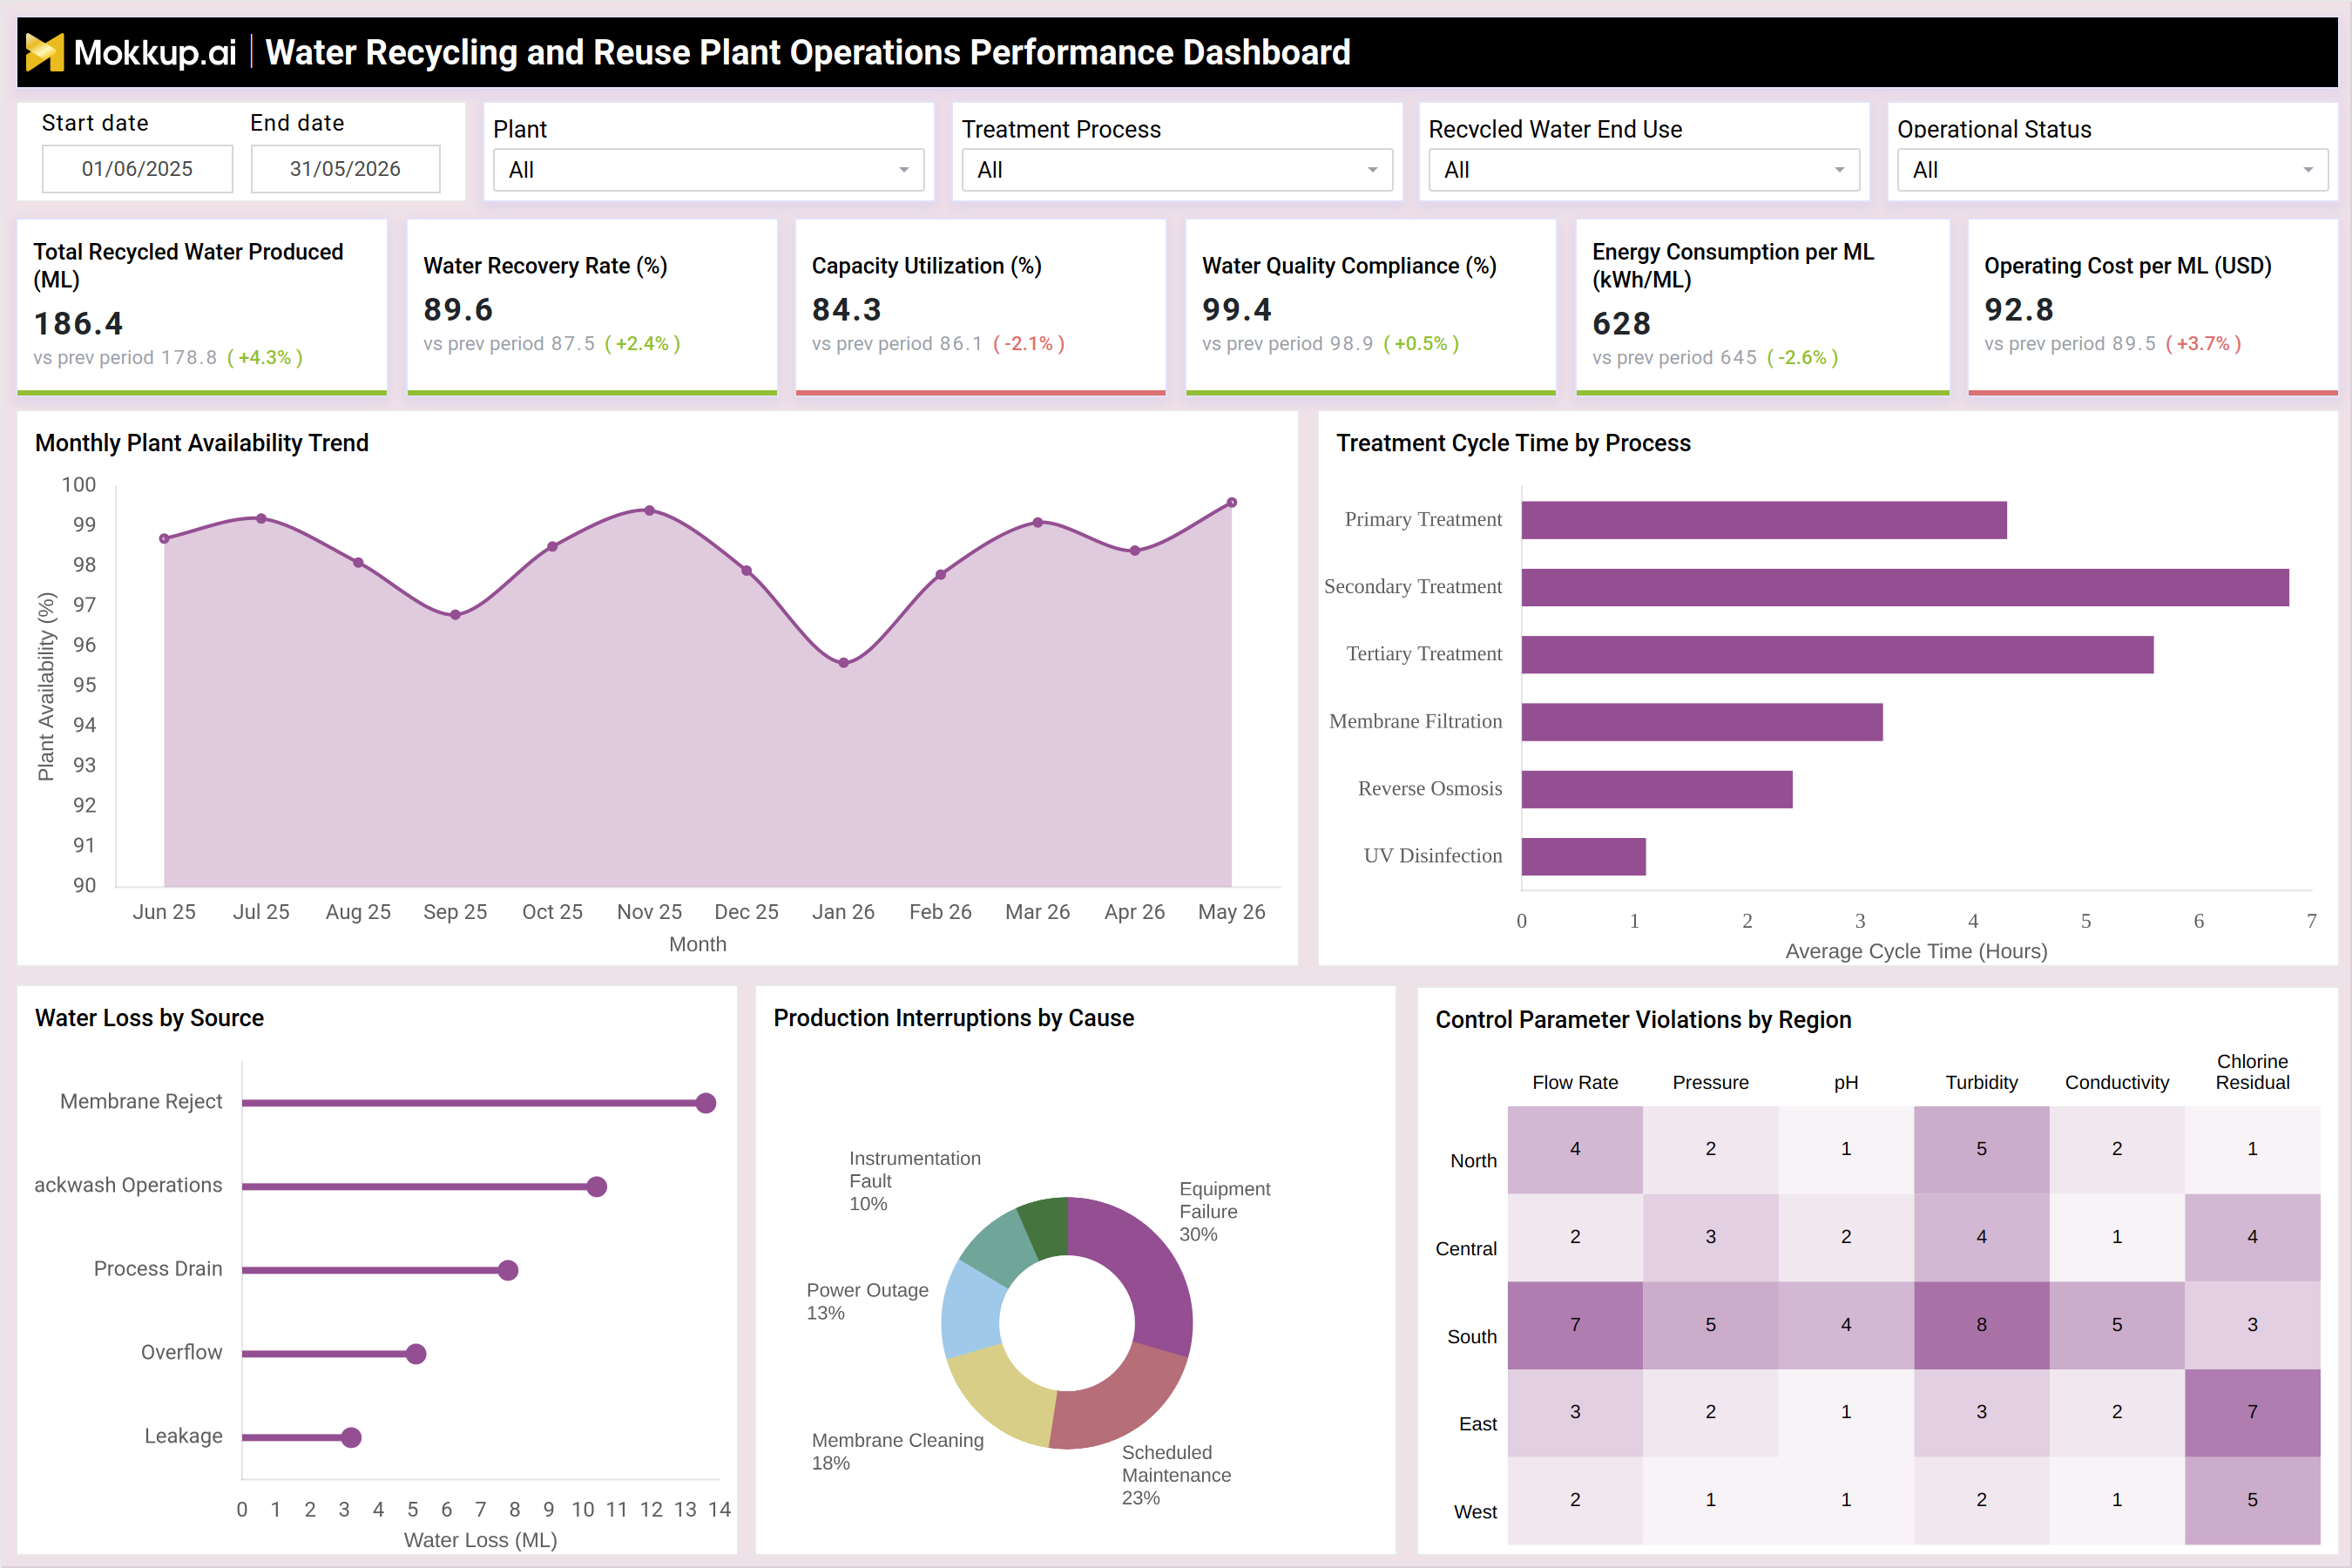
What is a Water Recycling and Reuse Plant Operations Performance Dashboard?
A water recycling and reuse plant operations performance dashboard is a structured visual tool that brings together operational data from across a recycling facility into a single, trackable interface. It gives plant operators, process engineers, and facility managers a consolidated view of how well the recycling system is performing — from intake and treatment through to distribution and end-use delivery. By centralizing recycled water production and water recovery rate monitoring into one view, the dashboard removes the need to cross-reference reports from multiple systems or rely on manual data aggregation. This dashboard is designed for facilities that need continuous oversight of production volumes, treatment efficiency, quality compliance, and energy consumption. It links key performance metrics to the operational factors that drive them — including treatment process type, plant selection, recycled water end use, and operational status — so that performance gaps can be traced to specific conditions rather than diagnosed in isolation. The water quality compliance tracking water treatment plant view ensures that regulatory and safety thresholds remain visible throughout every operational period, not just during formal reviews.
How to Create a Water Recycling and Reuse Plant Operations Performance Dashboard
You don't need to build your report from scratch; just start with a ready-to-use dashboard template from Mokkup. Add in your data and export it however you like. Here's how to do it:
1. Create or Log in to Your Mokkup Account
Start by signing up on Mokkup.ai using your email. If you already have an account, just log in, and you'll be good to go.
2. Choose and Customize Your Dashboard Template
Find the Water Recycling and Reuse Plant Operations Performance Dashboard template in the Templates section. Use the drag-and-drop editor to adjust KPIs, edit filters, or add elements based on your data.
3. Export to Your BI Tool
Once your dashboard wireframe is ready, use the BI Tool Export feature to send it directly to Power BI or Tableau for further analysis and enhancements. You can also download the dashboard as a PDF, PNG, or JPEG, embed it on a platform, or invite your team to collaborate.
Note: This is a Pro template. You'll need a Pro subscription on Mokkup to use and customize this dashboard wireframe. Upgrade anytime to unlock full access.
Water Recycling and Reuse Plant Operations Performance Dashboard Example
A plant operations manager opens this dashboard at the start of each review cycle to determine whether recycled water production volumes, recovery rates, and quality compliance are within acceptable operating ranges. The central question is immediate: is the facility producing at target capacity while maintaining water quality standards, and are treatment processes running efficiently without escalating energy costs? With filters for plant, treatment process, recycled water end use, and operational status, the manager can immediately focus the view on the most relevant segment of operations before examining broader performance trends. From the KPI overview, the team can assess whether total recycled water produced has kept pace with targets, whether the water recovery rate reflects effective process management, and whether capacity utilization is being maintained without operational stress. When capacity utilization drops or energy consumption per megalitre rises, operators can investigate whether the underlying cause is a treatment process inefficiency, a specific plant configuration issue, or a seasonal demand shift — all of which are traceable through the available filter dimensions.
The monthly plant availability trend provides visibility into how consistently equipment has been available for production over the past year. Dips in availability often correlate with specific interruption events, which the production interruptions by cause donut chart breaks down into categories such as equipment failure, scheduled maintenance, membrane cleaning, and power outage. This pairing allows facility managers to distinguish between controllable downtime — which can be optimized through better scheduling — and unplanned failures that require a maintenance or reliability response. The treatment cycle time by process chart, the water loss by source breakdown, and the control parameter violations heatmap give operators three additional dimensions of visibility that support treatment cycle time optimization water reuse facility decisions. Together, these views make it possible to manage not just output volume but the full operational health of the facility — from process timing and loss containment to regional compliance across flow rate, pressure, pH, turbidity, conductivity, and chlorine residual parameters.
How to Analyze Data in a Water Recycling and Reuse Plant Operations Performance Dashboard
Here is how you can analyze data from this dashboard:
- Use the monthly plant availability trend to identify periods of reduced equipment uptime and correlate dips with specific interruption events or seasonal maintenance cycles
- Review the six KPI cards — total recycled water produced, water recovery rate, capacity utilization, water quality compliance, energy consumption per ML, and operating cost per ML — to establish a baseline picture of overall facility performance
- Analyze the treatment cycle time by process chart to compare how long each stage — primary, secondary, tertiary, membrane filtration, reverse osmosis, and UV disinfection — takes relative to expected benchmarks, and identify where bottlenecks are forming
- Examine the water loss by source bar chart to determine whether losses are concentrated in membrane reject, backwash operations, process drain, overflow, or leakage, then prioritize the highest-volume source for corrective action
- Use the production interruptions by cause donut chart to distinguish between planned downtime such as scheduled maintenance and membrane cleaning, and unplanned failures such as equipment failure and power outage, to guide maintenance investment decisions
- Review the control parameter violations heatmap across regions — North, Central, South, East, and West — and parameters — flow rate, pressure, pH, turbidity, conductivity, and chlorine residual — to identify which region and parameter combination shows the most concentrated violations
- Apply date range, plant, treatment process, recycled water end use, and operational status filters to isolate performance data to specific operating periods and configurations for more targeted analysis
Benefits of a Water Recycling and Reuse Plant Operations Performance Dashboard
The following are the benefits of using this dashboard:
- Provides a unified view of recycled water production and water recovery rate monitoring across all treatment processes and plant locations in a single interface
- Reduces diagnostic time by linking performance gaps to specific operational conditions such as treatment process type, plant configuration, and recycled water end use
- Supports proactive maintenance scheduling by surfacing production interruption patterns and plant availability trends before they escalate into extended downtime
- Enables consistent water quality compliance tracking across all active treatment periods by keeping regulatory parameters visible throughout every operational cycle
- Helps facility managers assess treatment cycle time optimization water reuse facility opportunities by comparing cycle durations across primary, secondary, tertiary, membrane, and disinfection stages
- Improves energy and cost management by tracking energy consumption per megalitre and operating cost per megalitre alongside production volumes over time
- Supports regulatory reporting and audit documentation by consolidating control parameter violations and quality compliance data into an exportable, structured dashboard format
KPIs to Track in a Water Recycling and Reuse Plant Operations Performance Dashboard
The following key KPIs can be tracked by using this Control parameter violations water recycling plant dashboard:
- Key Performance Indicators (KPIs) are quantifiable metrics that measure how effectively a process or operation is achieving its defined objectives. In water recycling and reuse operations, KPIs help plant operators and facility managers assess system performance, identify inefficiencies, and maintain compliance with water quality and environmental standards.
- Total Recycled Water Produced (ML): Measures the total volume of recycled water produced in megalitres over the selected period, indicating plant throughput and production capacity utilization
- Water Recovery Rate (%): Tracks the proportion of input water that is successfully recovered and recycled through the treatment process, reflecting overall process efficiency
- Capacity Utilization (%): Measures how effectively available treatment capacity is being used relative to total installed capacity, signaling over- or under-utilization across the facility
- Water Quality Compliance (%): Measures how consistently treated recycled water meets defined quality standards for the selected end use and treatment process, a critical indicator for regulatory compliance
- Energy Consumption per ML (kWh/ML): Tracks the amount of energy consumed per megalitre of recycled water produced, helping identify energy efficiency trends and cost optimization opportunities
- Operating Cost per ML (USD): Measures the total operating expenditure per megalitre of recycled water produced, providing a financial efficiency benchmark for comparing performance across periods
Frequently Asked Questions
1. What makes a water recycling and reuse plant operations performance dashboard useful for facility managers?
It consolidates all critical production, quality, and operational metrics into a single, filterable view. Facility managers can compare performance across plants, treatment processes, and time periods without manually pulling data from multiple systems.
2. How does recycled water production and water recovery rate monitoring support operational decision-making?
Tracking both production volume and recovery rate together reveals whether output gains are being achieved efficiently or at the cost of higher input consumption. This pairing helps operators identify process adjustments that improve recovery without increasing energy or operating costs.
3. How does the control parameter violation heatmap support water recycling plant operations?
The heatmap shows violations by region and parameter — including flow rate, pressure, pH, turbidity, conductivity, and chlorine residual — making it easy to identify which locations and parameters need immediate attention. This supports targeted corrective action rather than broad operational reviews.