
What is a Wastewater Utilities Collection Cost & Budget Dashboard?
A Water & Wastewater Utilities Collection Cost & Budget Dashboard is a data-driven analytics tool designed to help utilities monitor, analyze, and optimize spending on wastewater collection systems. It consolidates financial data, operational expenses, and budget variances into a single interface, enabling utility managers to track costs, identify inefficiencies, and make informed financial decisions. This dashboard provides insights into operational and maintenance (O&M) costs, capital expenditures, grant funding utilization, and unplanned overflow response expenses. By visualizing trends in wastewater collection system financial optimization, utilities can improve budget allocation, reduce financial waste, and ensure compliance with regulatory requirements.
How to Create a Wastewater Utilities Collection Cost & Budget Dashboard
You don’t need to build your report from scratch; just start with a ready-to-use dashboard template from Mokkup. Add in your data and export it however you like. Here’s how to do it:
1. Create or Log in to Your Mokkup Account
Start by signing up on Mokkup.ai using your email. If you already have an account, just log in, and you’ll be good to go.
2. Choose and Customize Your Dashboard Template
Find the Wastewater Utilities Collection Cost & Budget Dashboard template in the Templates section. Use the drag-and-drop editor to adjust KPIs, edit filters, or add elements based on your data.
3. Export to Your BI Tool
Once your dashboard wireframe is ready, use the BI Tool Export feature to send it directly to Power BI or Tableau for further analysis and enhancements. You can also download the dashboard as a PDF, PNG, or JPEG, embed it on a platform, or invite your team to collaborate.
Note: This is a Pro template. You’ll need a Pro subscription on Mokkup to use and customize this dashboard wireframe. Upgrade anytime to unlock full access.
Wastewater Utilities Collection Cost & Budget Dashboard Example
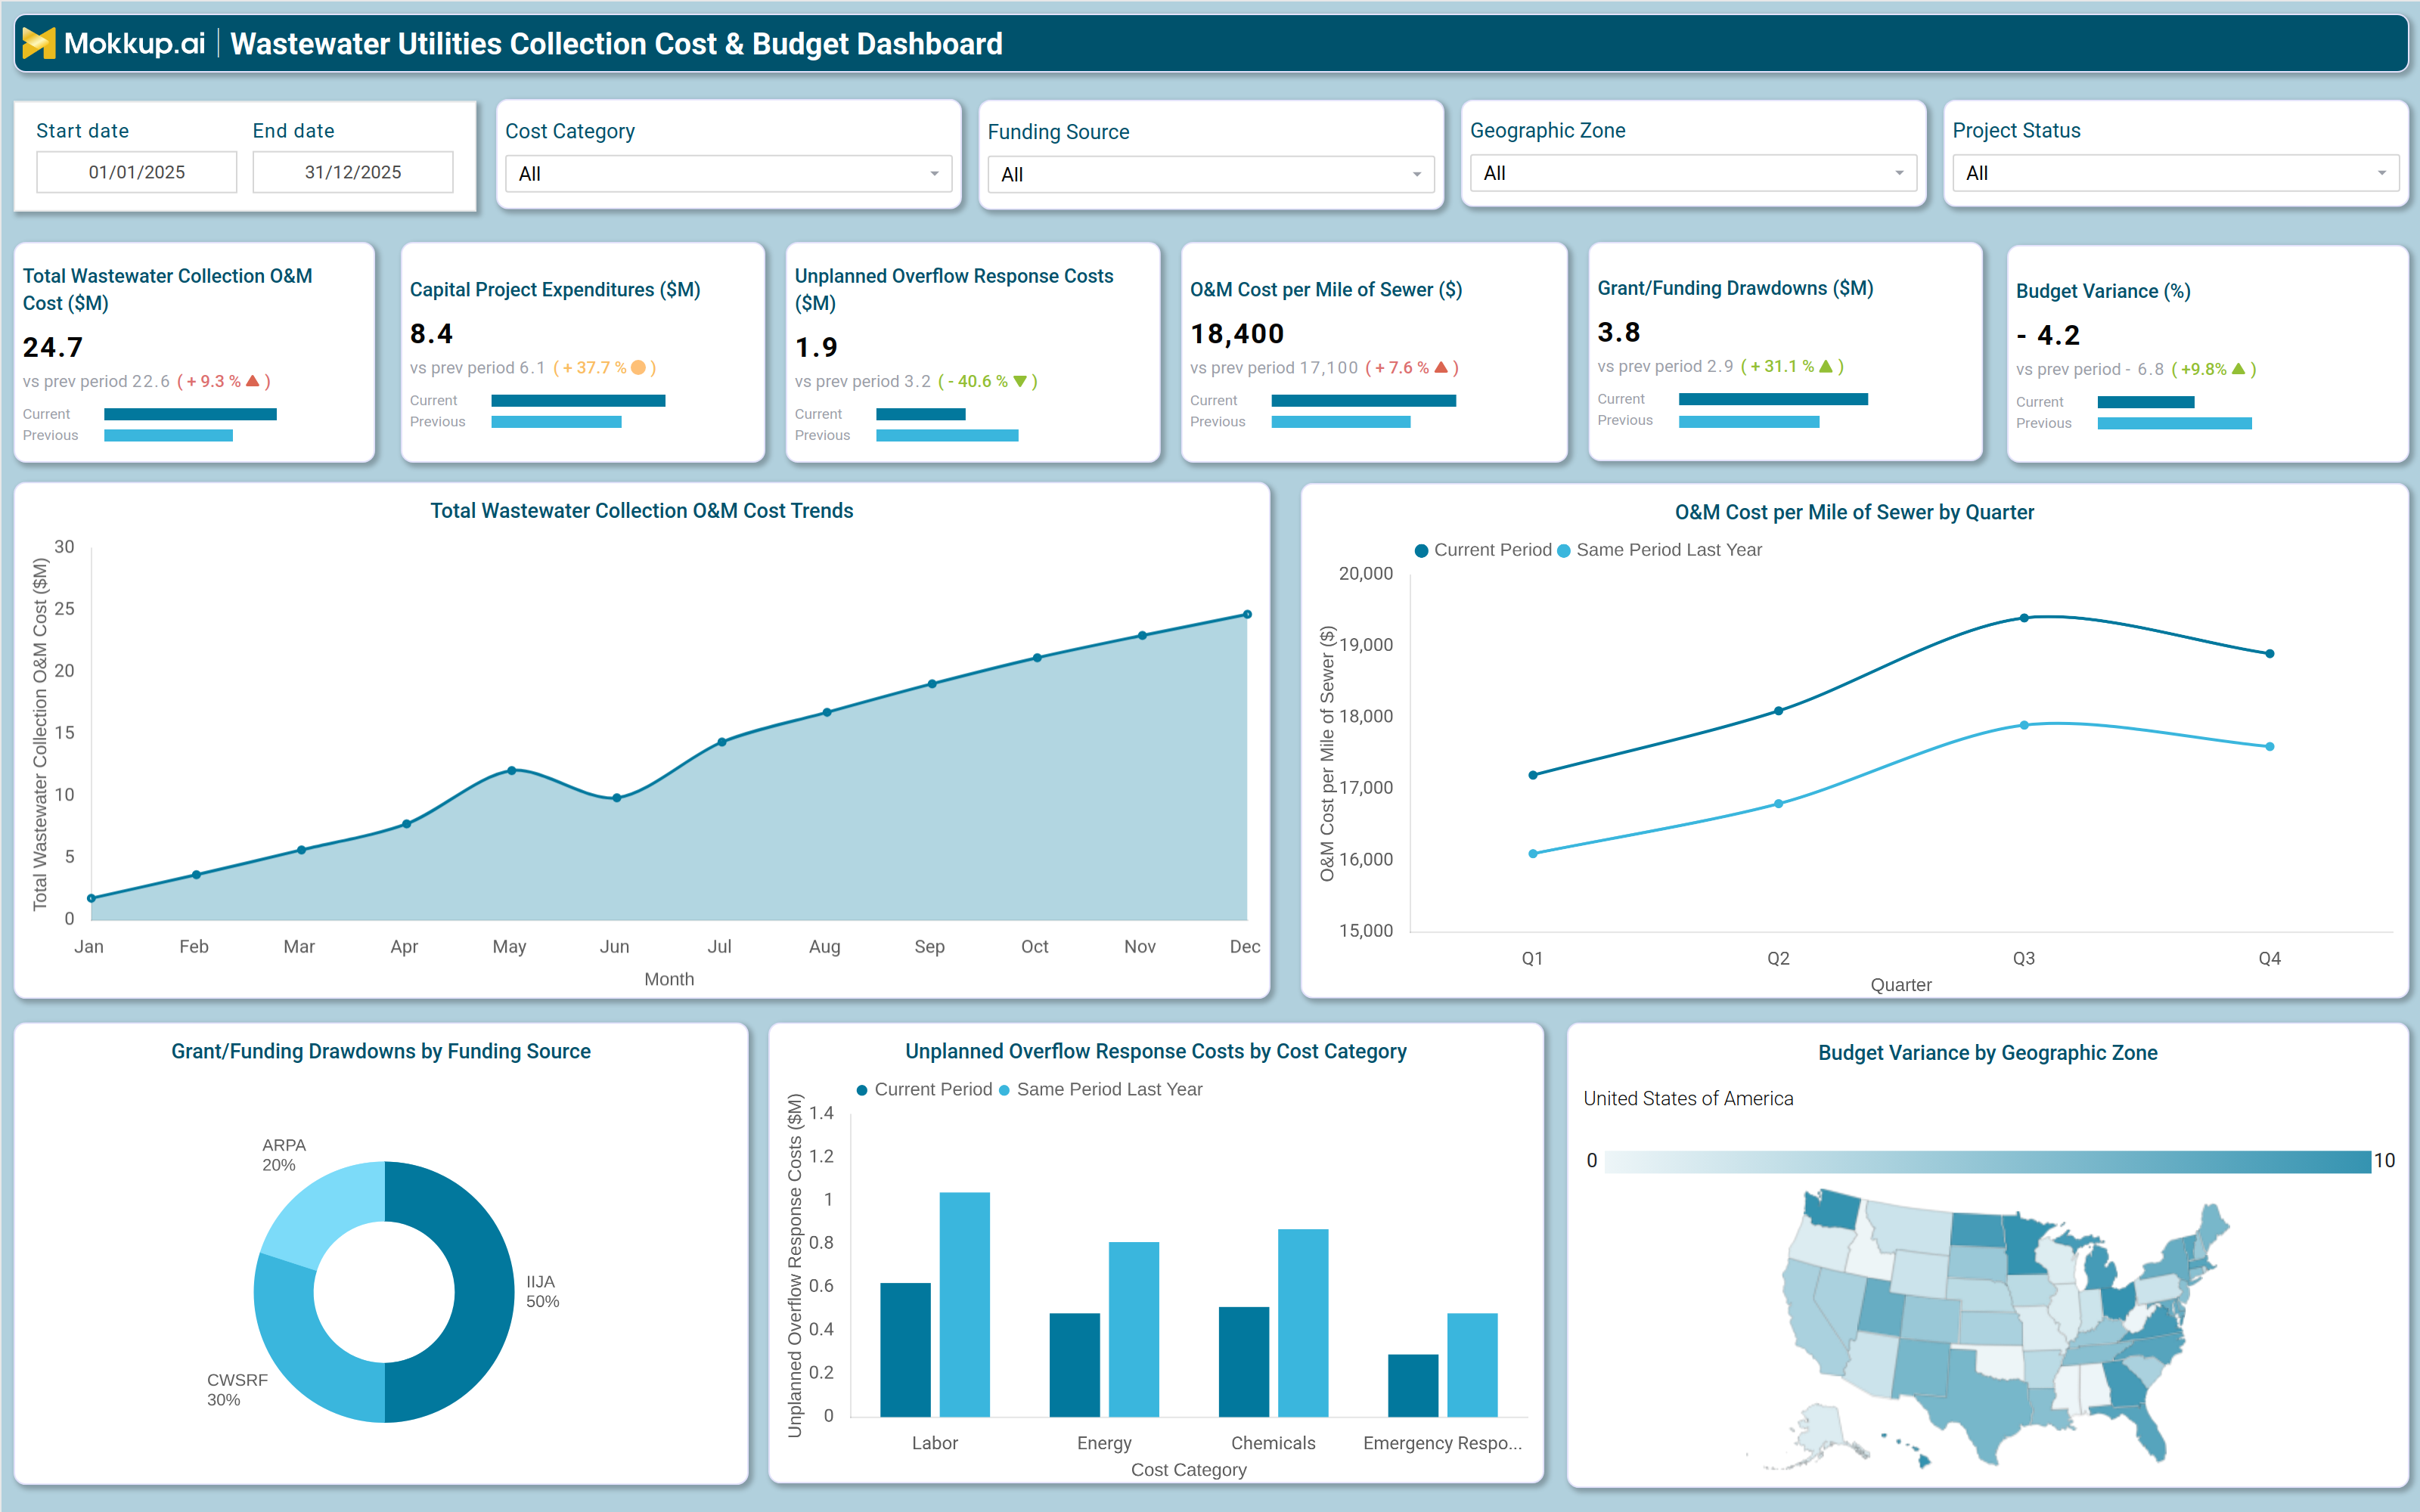
A typical wastewater collection cost and budget dashboard includes interactive filters for date ranges, cost categories, funding sources, geographic zones, and project statuses, allowing users to drill down into specific financial data. Key performance tiles display total wastewater collection O&M cost, capital project expenditures, unplanned overflow response costs, O&M cost per mile of sewer, grant/funding drawdowns, and budget variance, each compared against previous periods to highlight spending trends. Trend charts show monthly total wastewater collection O&M cost trends, helping financial managers identify seasonal or operational cost patterns. A bar chart compares O&M cost per mile of sewer by quarter, with the current period and the same period last year side by side to evaluate efficiency improvements.
A pie or bar chart breaks down grant/funding drawdowns by funding source, showing the share from ARPA, IIJA, and CWSRF, ensuring that available financial resources are utilized effectively. Another bar chart illustrates unplanned overflow response costs by cost category (labor, energy, chemicals, emergency response), pinpointing which expenses drive emergency spending. A geographic map visualizes budget variance by region, enabling targeted corrective actions in underperforming zones. Together, these components provide a comprehensive wastewater infrastructure cost dashboard that helps utilities reduce financial waste, improve budget accuracy, and optimize infrastructure investments.
How to Analyze Data in a Wastewater Utilities Collection Cost & Budget Dashboard
Here is how you can analyze data from this dashboard:
- Compare O&M costs against previous periods to detect spending trends.
- Monitor capital project expenditures to ensure infrastructure investments align with long-term budgets.
- Track unplanned overflow response costs to identify recurring issues in the collection system.
- Analyze O&M cost per mile of sewer to benchmark efficiency across different zones.
- Review grant/funding drawdowns to ensure financial resources are utilized effectively.
- Assess budget variance to determine if spending is under or over projections.
- Examine cost breakdowns by category (labor, energy, chemicals) to pinpoint high expense areas.
- Use geographic heatmaps to identify regions with the highest or most variable costs.
Benefits of an Wastewater Utilities Collection Cost & Budget Dashboard
The following are the benefits of using this dashboard:
- Improves cost visibility by consolidating all wastewater collection expenses in one place.
- Enhances budget accuracy by tracking actual spending against projections.
- Reduces financial waste by identifying inefficiencies in O&M and capital projects.
- Supports regulatory compliance by ensuring spending aligns with funding requirements.
- Optimizes grant utilization by monitoring drawdowns and remaining balances.
- Enables data driven decision making for wastewater infrastructure investments.
- Streamlines financial reporting with automated dashboards and visual analytics.
KPIs to Track in a Wastewater Utilities Collection Cost & Budget Dashboard
The following key KPIs can be tracked by using this grant funding drawdown dashboard:
- Total Wastewater Collection O&M Cost ($M): Measures overall operational spending on wastewater collection.
- Capital Project Expenditures ($M): Tracks investments in infrastructure upgrades and expansions.
- Unplanned Overflow Response Costs ($M): Monitors emergency spending due to system failures.
- O&M Cost per Mile of Sewer ($): Benchmarks efficiency by comparing costs per mile of sewer infrastructure.
- Grant/Funding Drawdowns ($M): Tracks utilization of available financial resources.
- Budget Variance (%): Compares actual spending against planned budgets to identify discrepancies.
Frequently Asked Questions
1. What is an O&M cost per mile dashboard used for ?
It helps utilities monitor spending, optimize budgets, and reduce financial waste in wastewater collection operations.
2. What data sources feed into this utility budget tracking dashboard?
ERP systems, financial software, SCADA data, work order management tools, and grant tracking systems.
3. Who should use a wastewater collection cost dashboard?
Utility managers, financial planners, operations teams, and regulatory compliance officers.