
What Is a Wastewater Treatment Workforce Operations Dashboard?
A Wastewater Treatment Workforce Operations dashboard is a centralized analytics tool designed to monitor labor efficiency, compliance, and operational performance in water and wastewater utilities. This digital dashboard for wastewater treatment labor efficiency consolidates workforce data, including hours worked, overtime, training compliance, labor costs, and work order completion rates into a single view. By providing workforce analytics for water and wastewater utilities, it helps plant managers, operations teams, and utility leaders make data-driven decisions to improve productivity, reduce costs, and ensure regulatory compliance. The work order completion dashboard tracks key metrics such as workforce hours, training compliance, labor costs per million gallons treated, and first-time fix rates, enabling utilities to optimize staffing, enhance training programs, and maintain operational efficiency.
How to Create a Wastewater Treatment Workforce Operations Dashboard
You don’t need to build your report from scratch; just start with a ready-to-use dashboard template from Mokkup. Add in your data and export it however you like. Here’s how to do it:
1. Create or Log in to Your Mokkup Account
Start by signing up on Mokkup.ai using your email. If you already have an account, just log in, and you’ll be good to go.
2. Choose and Customize Your Dashboard Template
Find the Wastewater Treatment Workforce Operations Dashboard template in the Templates section. Use the drag and drop editor to adjust KPIs, edit filters, or add elements based on your data.
3. Export to Your BI Tool
Once your dashboard wireframe is ready, use the BI Tool Export feature to send it directly to Power BI or Tableau for further analysis and enhancements. You can also download the dashboard as a PDF, PNG, or JPEG, embed it on a platform, or invite your team to collaborate.
Note: This is a Pro template. You’ll need a Pro subscription on Mokkup to use and customize this dashboard wireframe. Upgrade anytime to unlock full access.
Wastewater Treatment Workforce Operations Dashboard Example
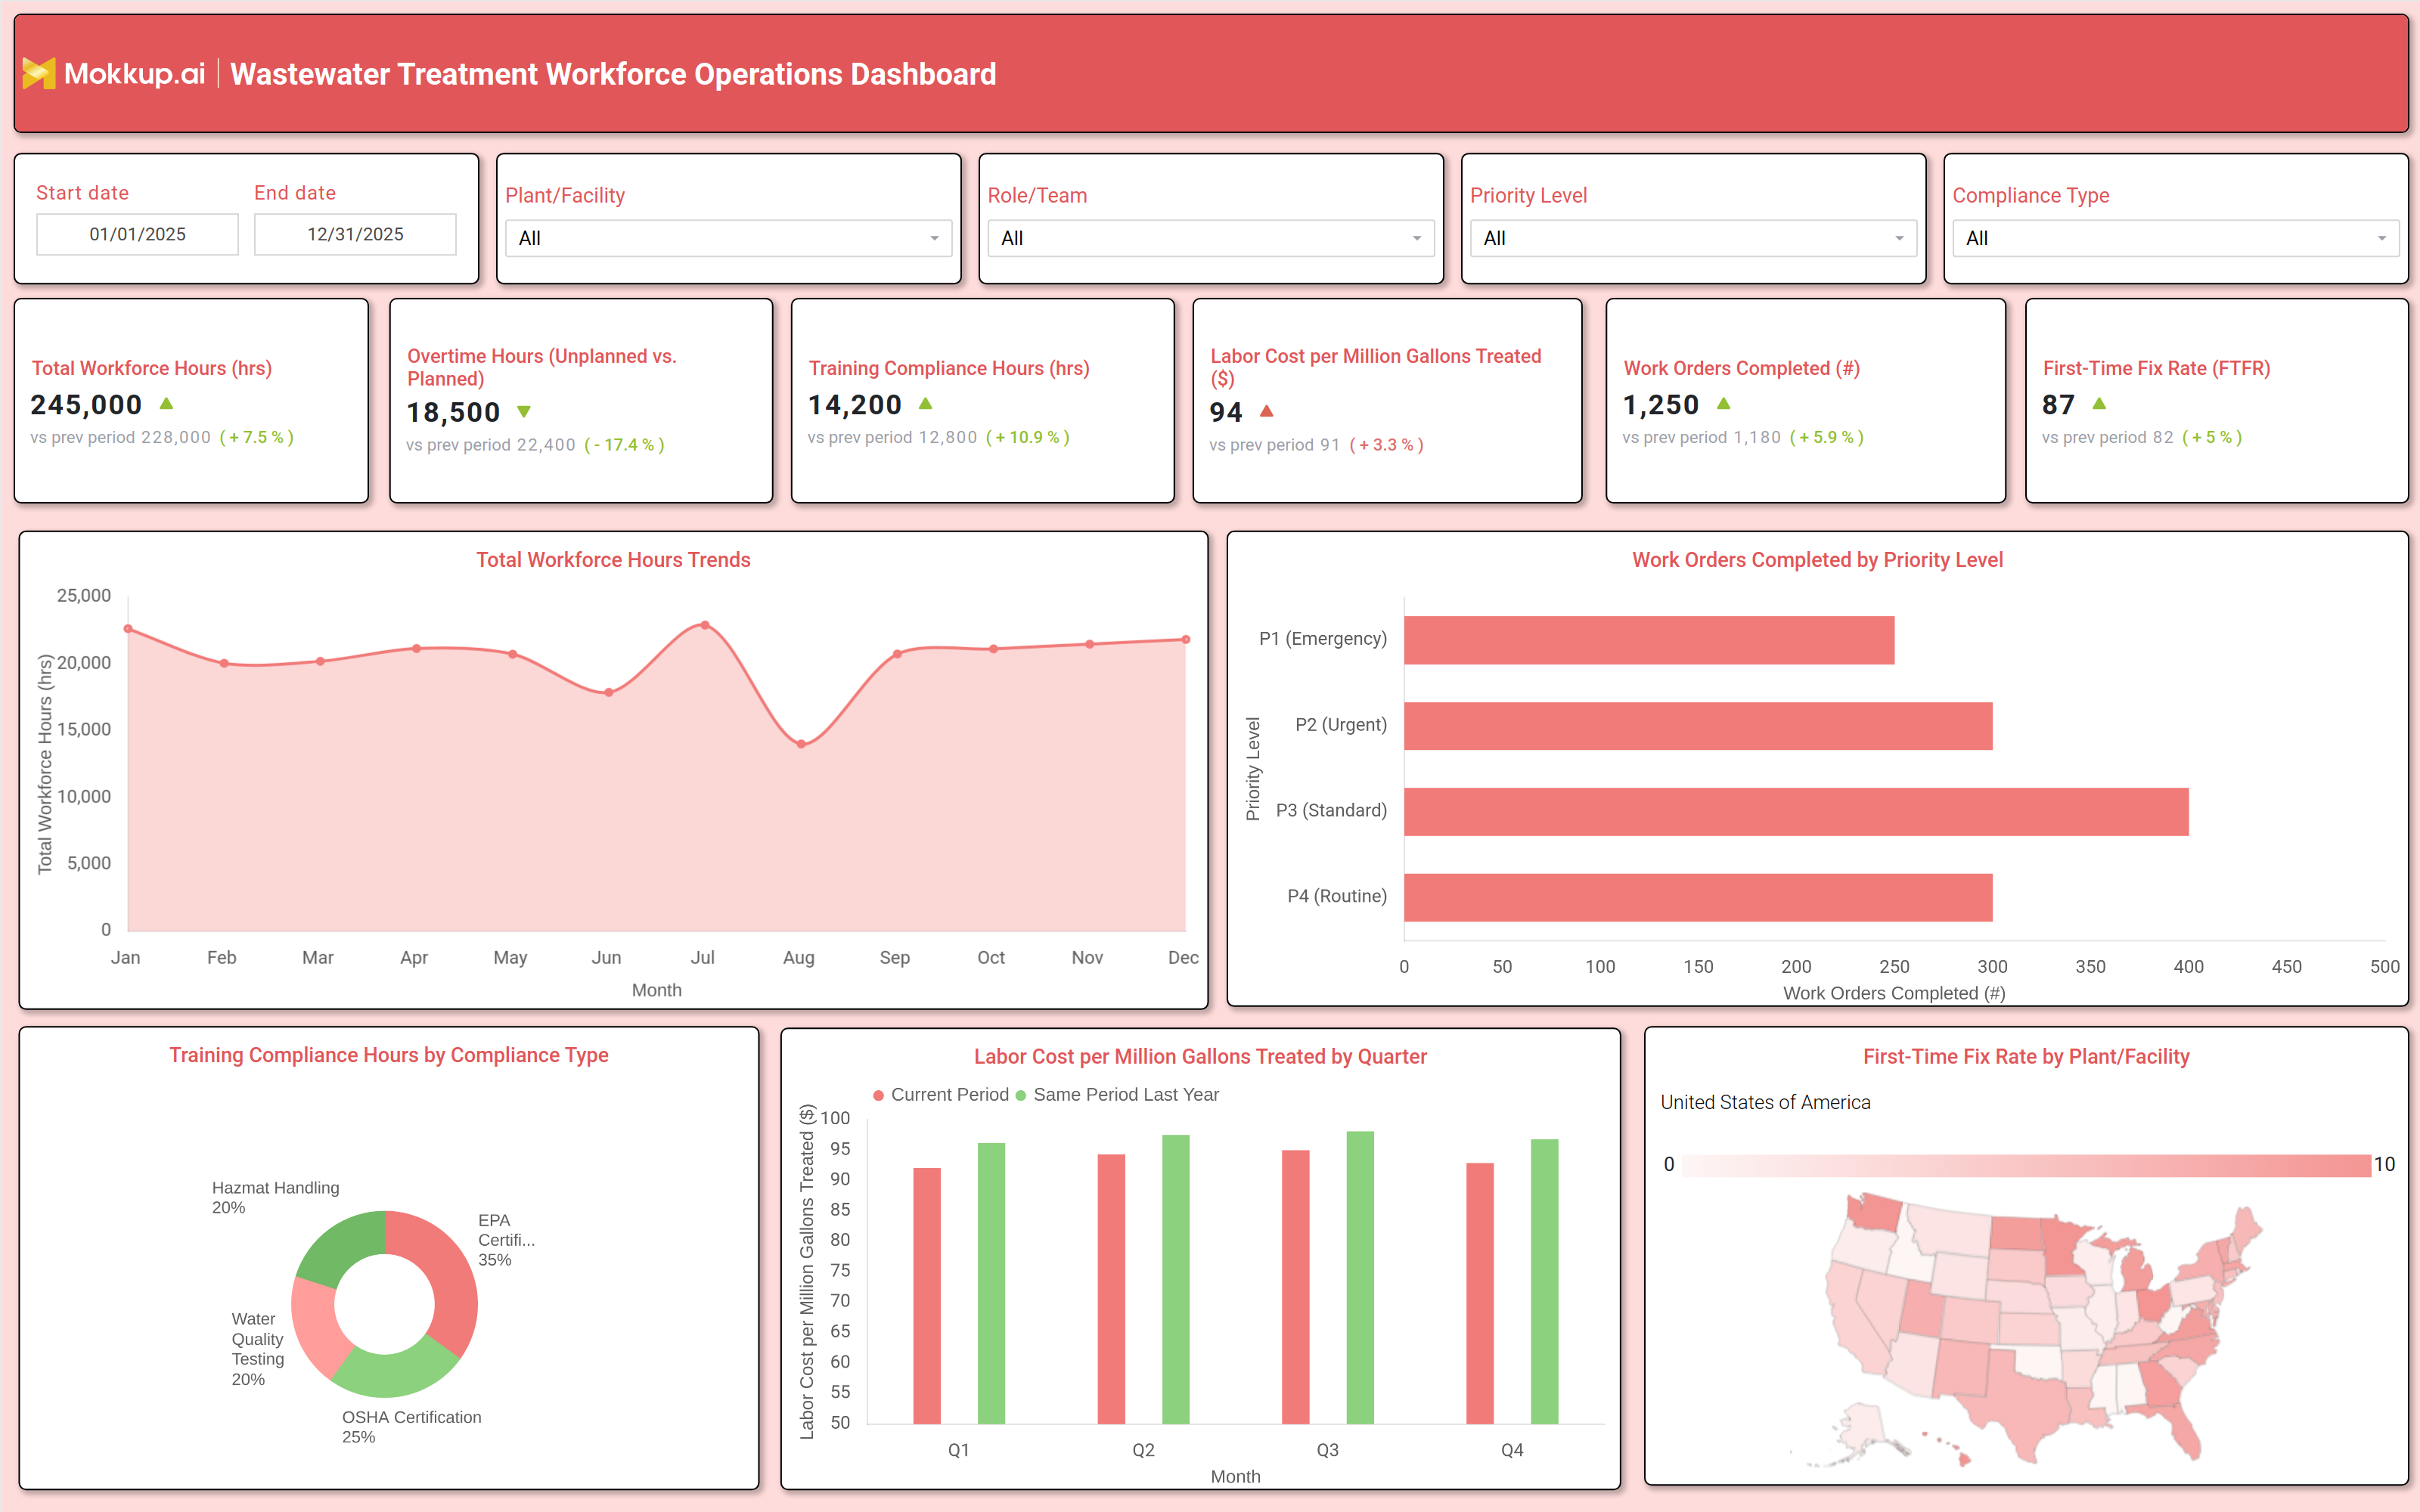
A typical Wastewater Treatment Workforce Operations dashboard includes interactive filters for date ranges, plant/facility, role/team, priority level, and compliance type. Key performance tiles display total workforce hours, planned vs. unplanned overtime hours, training compliance hours, labor cost per million gallons treated, work orders completed, and first‑time fix rate (FTFR) each compared against previous periods. Trend charts show total workforce hours over time, helping managers identify seasonal workload peaks.
A bar chart breaks down work orders completed by priority level (P1 Emergency, P2 Urgent, P3 Standard, P4 Routine), highlighting where resources are most heavily deployed. Training compliance hours are tracked by compliance type (e.g., Hazmat Handling, Water Quality Testing, OSHA Certification, EPA Certification) across months, revealing gaps in certification programs. A quarterly line chart compares current period labor cost per million gallons treated against the same period last year, supporting cost‑efficiency reviews. Finally, a bar chart visualizes the first‑time fix rate by plant/facility, enabling targeted performance improvements. Together, these components form a comprehensive wastewater operations workforce analytics dashboard that optimizes labor allocation, reduces overtime, and ensures regulatory compliance.
How to Analyze Data in a Wastewater Treatment Workforce Operations Dashboard
Here is how you can analyze data from the best Wastewater Treatment dashboard like this one:
- Review total workforce hours to assess labor capacity and identify trends in workload distribution.
- Compare planned vs. unplanned overtime to detect staffing shortages or inefficiencies in scheduling.
- Monitor training compliance hours to ensure regulatory adherence and identify gaps in workforce certifications.
- Track labor cost per million gallons treated to evaluate cost efficiency and control operational expenses.
- Analyze work orders completed by priority level to prioritize high impact tasks and improve response times.
- Assess first time fix rate (FTFR) to measure workforce effectiveness in resolving issues without repeat visits.
- Compare current performance with historical data to detect improvements or declines in productivity.
- Use geographic heatmaps to identify underperforming plants and allocate resources effectively.
Benefits of a Wastewater Treatment Workforce Operations Dashboard
The following are the benefits of using this dashboard:
- Enhances workforce productivity by tracking labor efficiency and identifying bottlenecks.
- Reduces overtime costs through better scheduling and workload distribution.
- Improves compliance by monitoring training hours and certifications.
- Optimizes labor allocation by analyzing work order completion rates and priority levels.
- Lowers operational costs by tracking labor expenses per million gallons treated.
- Boosts first time fix rates by identifying training needs and improving workforce skills.
- Supports data driven decisionmaking for staffing, training, and resource planning.
- Provides insights into workforce performance for faster corrective actions.
KPIs to Track in a Wastewater Treatment Workforce Operations Dashboard
The following key KPIs can be tracked by using this work order completion dashboard:
- Total Workforce Hours (hrs): Measures total labor hours worked across all plants/facilities.
- Overtime Hours (Planned vs. Unplanned): Tracks excess labor hours to identify staffing inefficiencies.
- Training Compliance Hours (hrs): Ensures workforce meets regulatory training requirements.
- Labor Cost per Million Gallons Treated ($): Evaluates cost efficiency in wastewater treatment operations.
- Work Orders Completed (#): Measures workforce productivity by tracking completed tasks.
- FirstTime Fix Rate (FTFR) (%): Indicates the percentage of issues resolved on the first attempt.
Frequently Asked Questions
1. What is a Water Utility Labor Efficiency dashboard used for?
It tracks labor efficiency, training compliance, overtime, and work order completion to optimize workforce performance in water and wastewater utilities.
2. Who should use a Wastewater Treatment Workforce dashboard?
Plant managers, operations teams, HR leaders, and utility executives responsible for workforce productivity and compliance.
3. What data sources feed into this training compliance tracking dashboard?
Workforce management systems, HR databases, training records, work order platforms, and labor cost reports.