
What is a Desalination Capacity Utilization & Contract Exposure Dashboard?
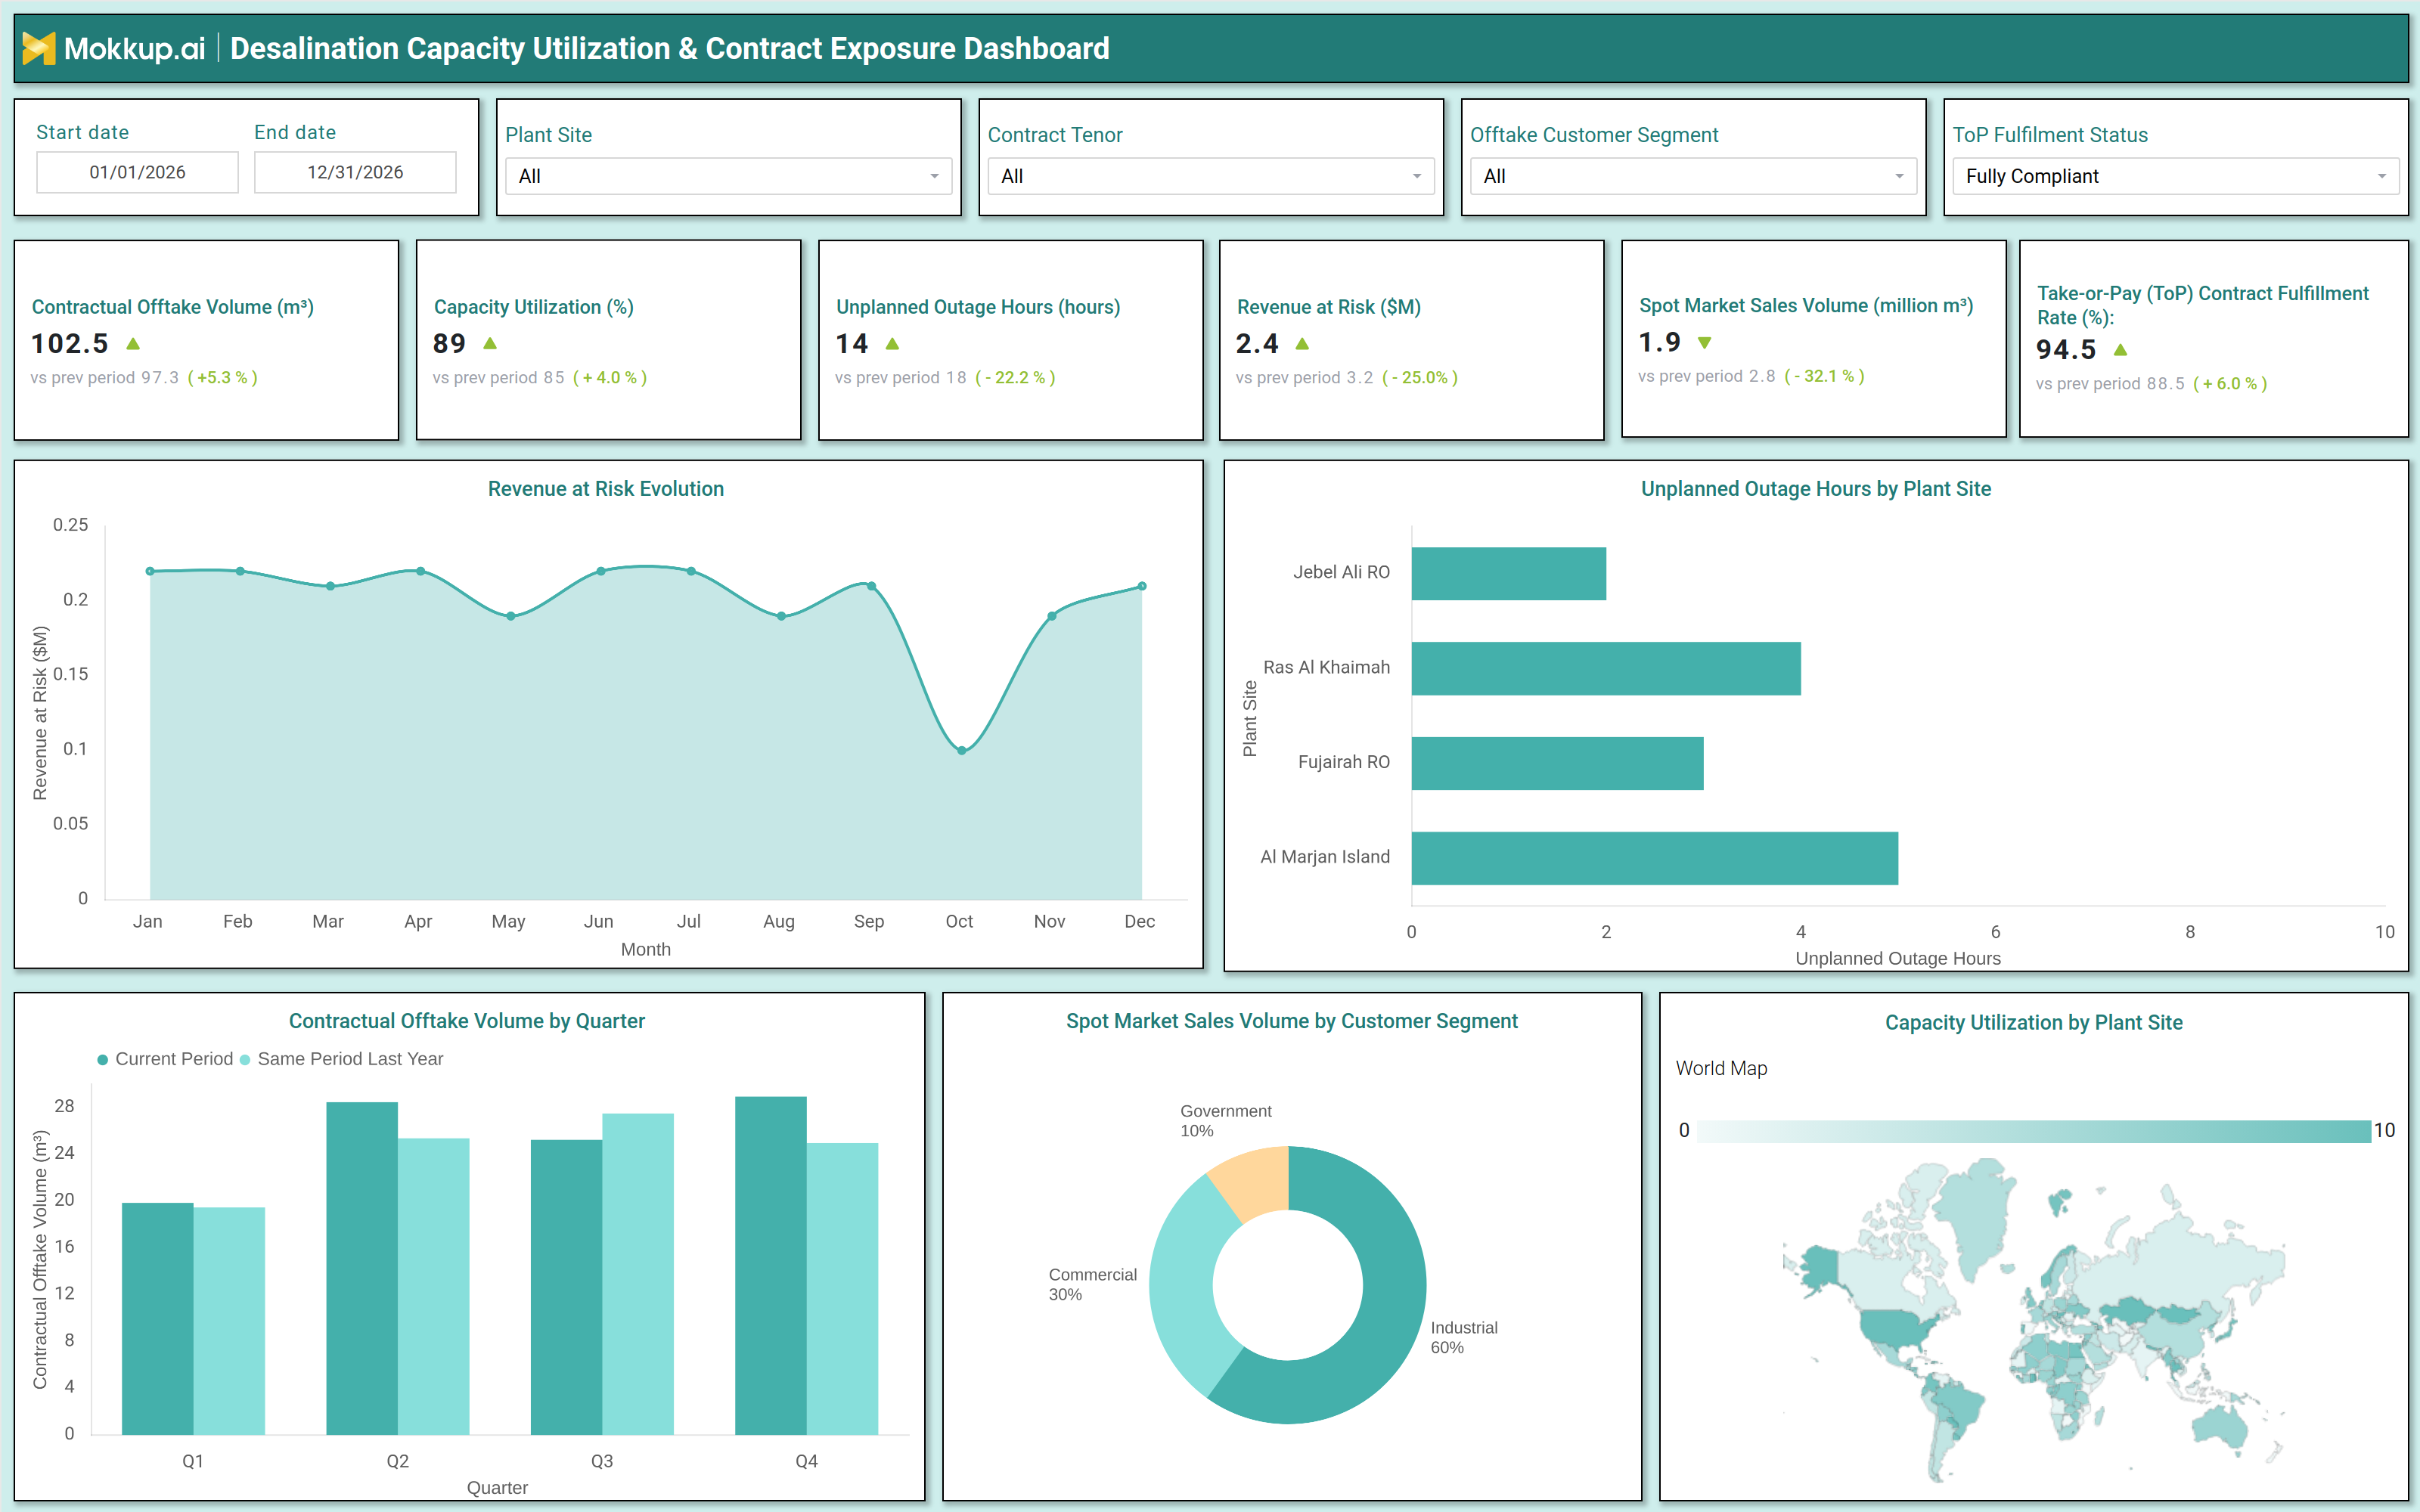
The Desalination Capacity Utilization & Contract Exposure Dashboard is a purpose-built analytics solution for operations directors, contract managers, and offtake agreement teams engaged in desalination capacity utilization monitoring across multi-site water production portfolios. It consolidates critical performance and contractual risk dimensions including capacity utilization rates, contractual offtake volumes, take or pay obligations, unplanned outage hours, spot market sales, and revenue at risk into a single integrated view.
By combining plant operational performance with desalination contract exposure management metrics, it enables leadership to evaluate whether facilities are running at optimal throughput and whether contractual commitments are being honored across all customer segments. Water utilities, independent water producers, and offtake authorities rely on this dashboard to protect revenue, reduce contract exposure, and make data-driven decisions across their full facility portfolio.
How to Create a Desalination Capacity Utilization & Contract Exposure Dashboard
You don’t need to build your report from scratch—just start with a ready-to-use Desalination Capacity Utilization & Contract Exposure dashboard template from Mokkup. Add in your data and export it however you like. Here’s how to do it:
1. Create or Log in to Your Mokkup Account
Start by signing up on Mokkup.ai using your email. If you already have an account, just log in, and you'll be good to go.
2. Choose and Customize Your Dashboard Template
Find the Desalination Capacity Utilization & Contract Exposure Dashboard template in the Templates section. Use the drag and drop editor to adjust KPIs, edit filters, or add elements based on your data.
3. Export to Your BI Tool
Once your dashboard wireframe is ready, use the BI Tool Export feature to send it directly to Power BI or Tableau for further analysis and enhancements. You can also download the dashboard as a PDF, PNG, or JPEG, embed it on a platform, or invite your team to collaborate.
Note: This is a Pro template. You'll need a Pro subscription on Mokkup to use and customize this dashboard wireframe. Upgrade anytime to unlock full access.
Desalination Capacity Utilization & Contract Exposure Dashboard Example
When a contract performance manager opens the dashboard, they start with the KPI row to assess capacity utilization and offtake performance against targets. Any decline is quickly linked to underperforming sites or unplanned outages, while the revenue-at-risk view quantifies the financial impact and highlights whether corrective action is needed.
Commercial and operations teams then drill deeper into contract fulfillment trends, filtering by contract type and customer segment to identify gaps and take early action. At the same time, outage analysis and geographic capacity views help pinpoint high-risk sites and rebalance operations. Together, these insights enable proactive contract management and help protect delivery commitments across the portfolio.
How to Analyze Data in a Desalination Capacity Utilization & Contract Exposure Dashboard
Here is how you can analyze data from this dashboard:
- Filter by Plant Site: Compare utilization and outage performance across individual facilities.
- Track Utilization Levels: Review the capacity utilization KPI to spot gaps against optimal throughput.
- Identify Revenue Risk Trends: Monitor revenue at risk evolution to link spikes with outages or shortfalls.
- Analyze Downtime by Site: Review unplanned outage hours to identify plants with the highest disruptions.
- Compare Offtake Volumes: Evaluate quarterly delivery trends against the previous year.
- Assess Spot Sales Mix: Use the segment donut chart to understand distribution across customer types.
- Check Contract Compliance: Filter by ToP fulfillment status to identify underperforming contracts.
- Monitor Fulfillment Rate: Track ToP contract fulfillment KPI to ensure consistent compliance.
Benefits of a Desalination Capacity Utilization & Contract Exposure Dashboard
The following are the benefits of using this dashboard:
- Centralized Performance View: Combines utilization, outages, offtake, and revenue risk metrics.
- Improved Contract Monitoring: Tracks ToP compliance and delivery performance in one place.
- Reduced Reporting Effort: Prebuilt KPIs and charts simplify performance tracking.
- Plant-Level Insights: Highlights sites with delivery gaps or rising contract exposure.
- Better Maintenance Planning: Identifies outage-heavy plants for prioritization.
- Stronger Operational Alignment: Supports coordinated action across operations and commercial teams.
- Shared Global Visibility: Provides a unified view of plant performance across locations.
KPIs to Track in a Desalination Capacity Utilization & Contract Exposure Dashboard
The following key KPIs can be tracked by using this dashboard:
- Contractual Offtake Volume (m³): Tracks the volume of water delivered under contractual agreements central to desalination capacity utilization monitoring and measuring whether plants are fulfilling committed delivery obligations each period.
- Capacity Utilization (%): Measures what proportion of installed treatment capacity is actively producing output a core indicator for contractual offtake volume tracking and optimizing throughput across the portfolio.
- Revenue at Risk ($M): Quantifies the financial exposure created by delivery shortfalls or outage events the revenue at risk desalination plant metric that helps leadership assess the financial consequence of operational performance gaps.
- Unplanned Outage Hours (hours): Tracks the cumulative hours of unplanned downtime across plant sites the unplanned outage hours desalination measure that directly links maintenance performance to contractual exposure and revenue risk.
- Take or Pay (ToP) Contract Fulfillment Rate (%): Evaluates adherence to take or pay contract obligations across customer segments and contract tenors central to take or pay contract fulfillment desalination compliance reporting and risk management.
- Spot Market Sales Volume (million m³): Tracks water volumes sold outside of contractual commitments used to understand how spot sales activity is distributed across Industrial, Commercial, and Government customer segments.
Frequently Asked Questions
Q1. What teams use a Desalination Capacity Utilization & Contract Exposure Dashboard?
Contract performance managers, operations directors, offtake commercial teams, and finance leadership overseeing multi-site desalination portfolios typically rely on this dashboard to manage capacity delivery and contractual risk.
Q2. How does this dashboard help manage take or pay contract risk?
By combining the Take or Pay Contract Fulfillment Rate KPI with the Contract Tenor and Offtake Customer Segment filters, teams can pinpoint which contract durations and customer categories are falling short of fulfillment obligations enabling early engagement with counterparties before penalties are triggered.
Q3. Can this dashboard track outage performance by plant site?
Yes. The Unplanned Outage Hours by Plant Site horizontal bar chart displays downtime hours across individual facilities, making it straightforward to identify which sites are driving the most operational disruption and where maintenance prioritization is most needed.