
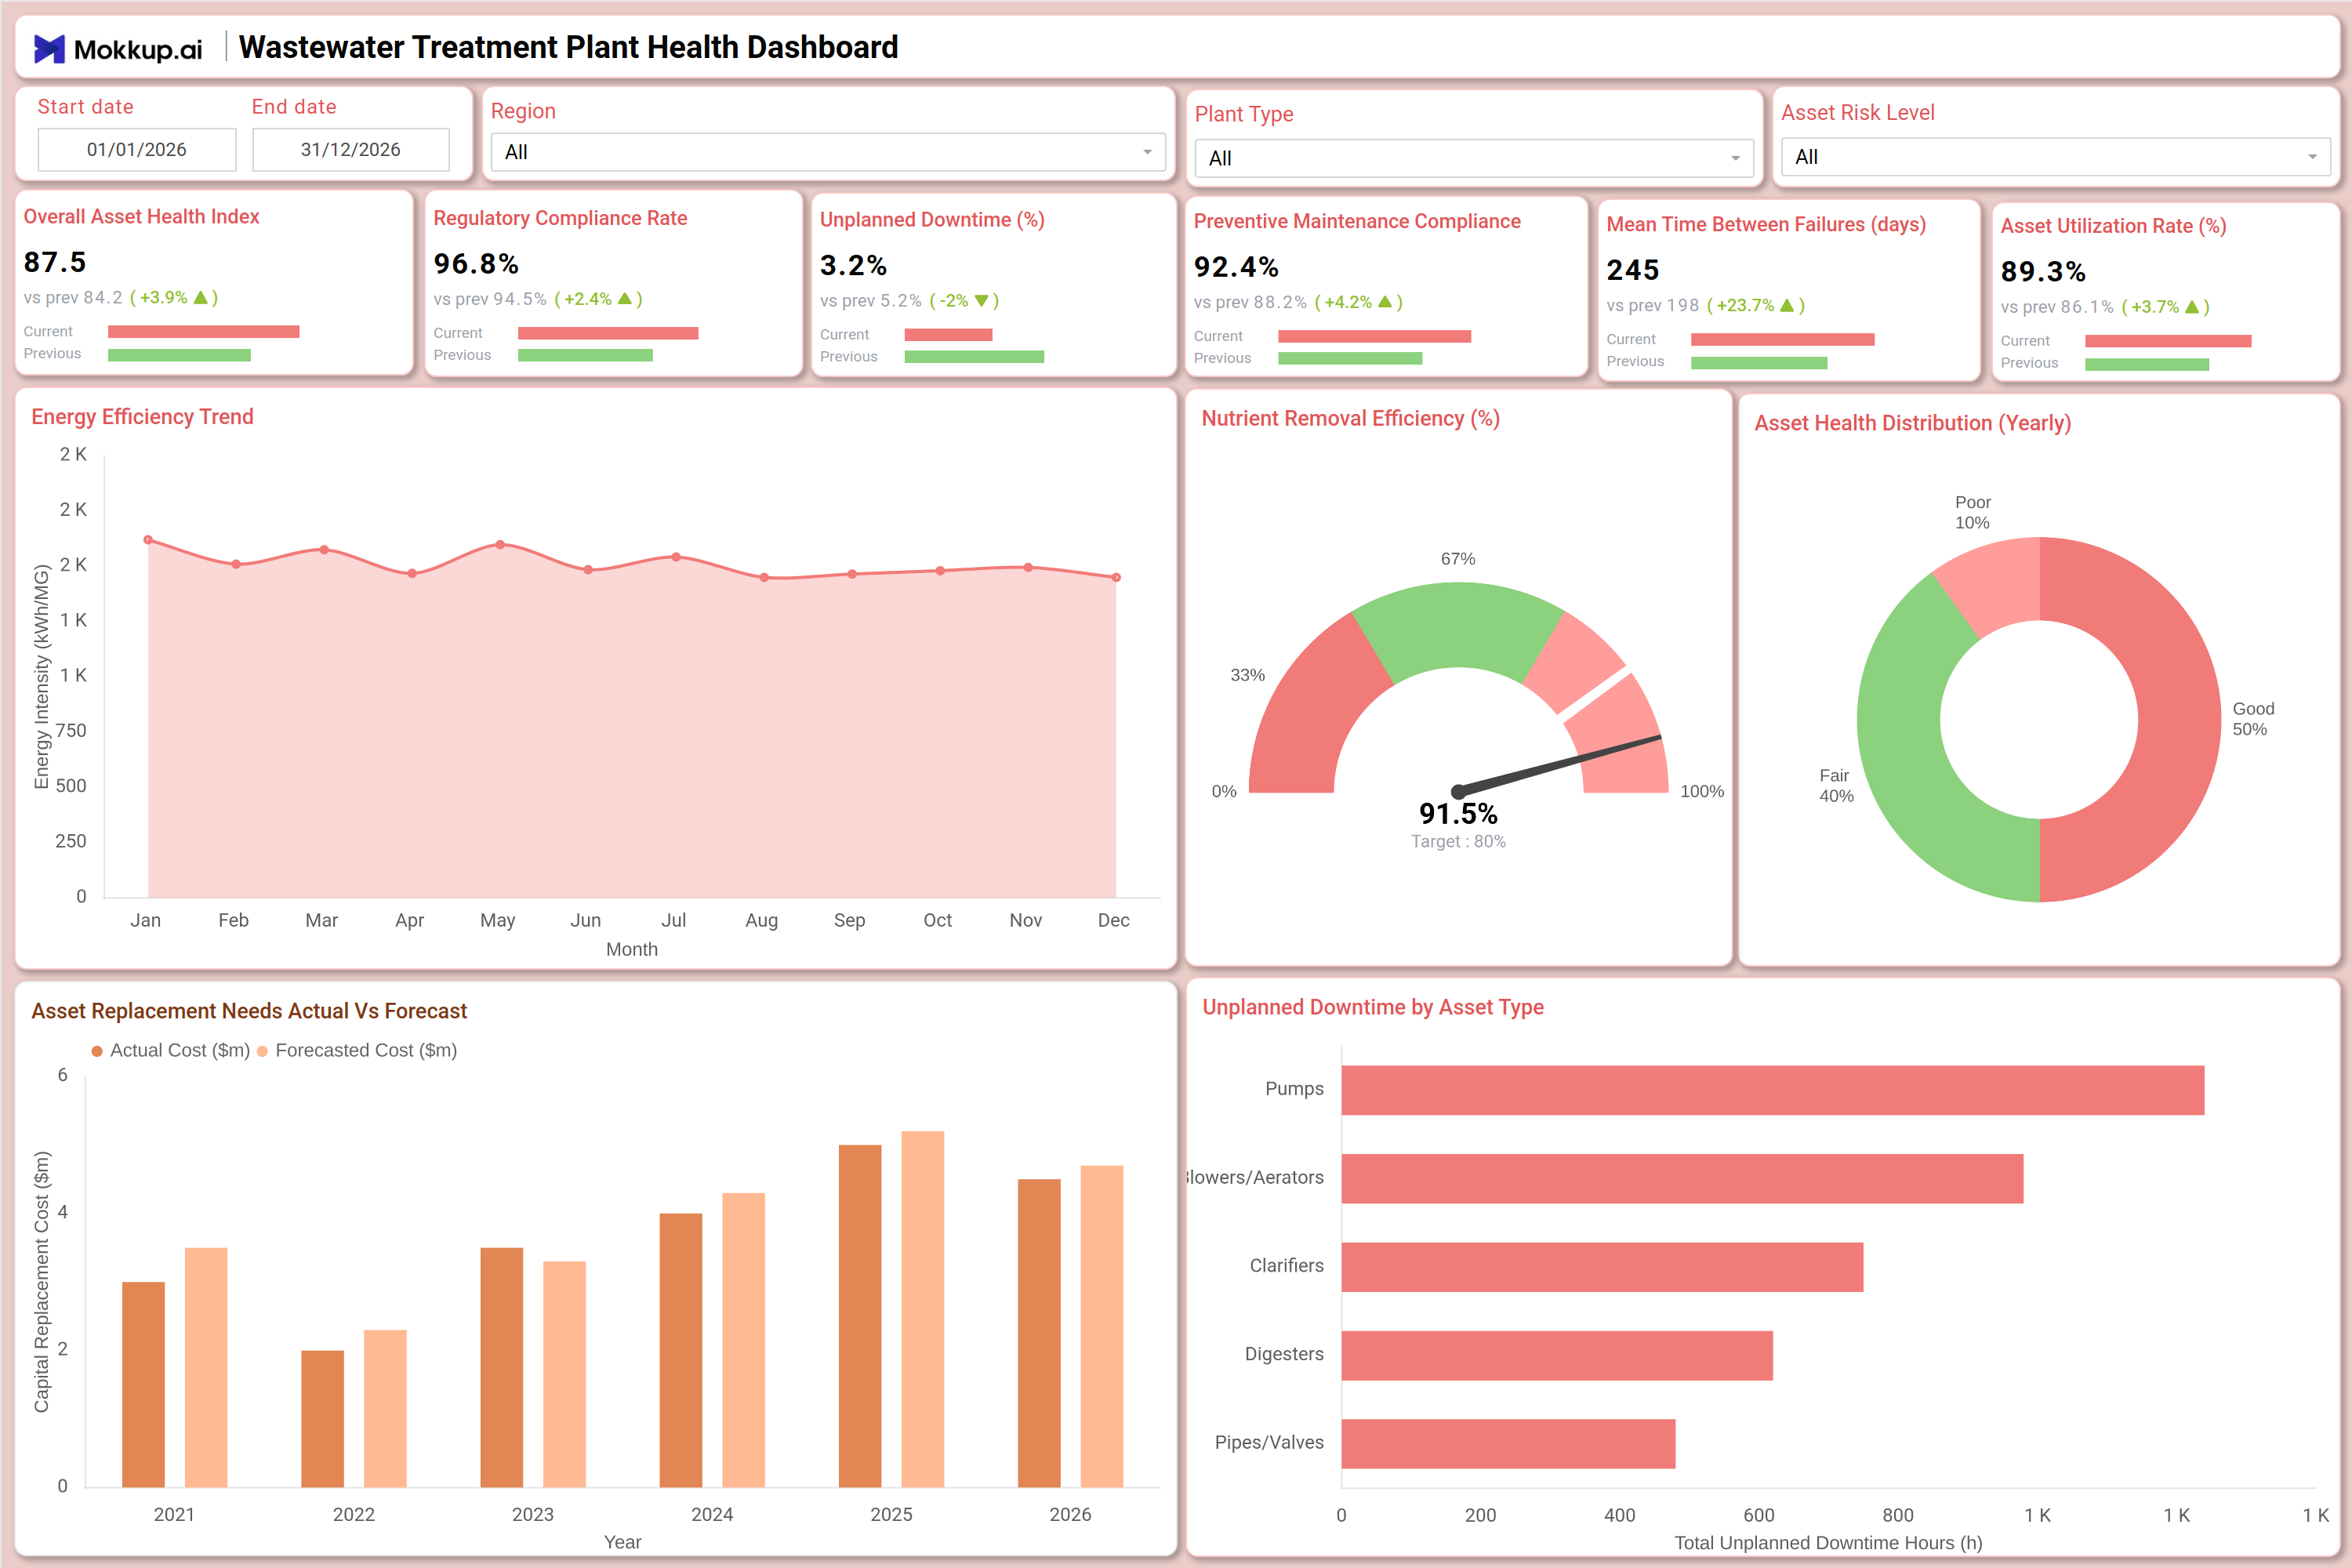
What is a Wastewater Treatment Plant Health Dashboard?
The Wastewater Treatment Plant Health Dashboard is a structured monitoring tool designed for plant operators, facility managers, and infrastructure teams responsible for managing treatment assets and compliance obligations. This wastewater treatment plant health dashboard consolidates six core KPIs — including Overall Asset Health Index, Regulatory Compliance Rate, and Mean Time Between Failures — alongside charts that track energy consumption, nutrient removal efficiency monitoring, and long-term capital forecasting. Teams use it to stay ahead of equipment degradation, meet environmental standards, and allocate maintenance budgets with precision. It provides a single view of asset performance across plant types, regions, and risk levels, eliminating the need to pull data from disconnected maintenance logs or compliance reports.
How to Create a Wastewater Treatment Plant Health Dashboard
You don't need to build your report from scratch; just start with a ready-to-use dashboard template from Mokkup. Add in your data and export it however you like. Here's how to do it:
1. Create or Log in to Your Mokkup Account
Start by signing up on Mokkup.ai using your email. If you already have an account, just log in, and you'll be good to go.
2. Choose and Customize Your Dashboard Template
Find the Wastewater Treatment Plant Health Dashboard template in the Templates section. Use the drag-and-drop editor to adjust KPIs, edit filters, or add elements based on your data.
3. Export to Your BI Tool
Once your dashboard wireframe is ready, use the BI Tool Export feature to send it directly to Power BI or Tableau for further analysis and enhancements. You can also download the dashboard as a PDF, PNG, or JPEG, embed it on a platform, or invite your team to collaborate.
Note: This is a Pro template. You'll need a Pro subscription on Mokkup to use and customize this dashboard wireframe. Upgrade anytime to unlock full access.
Wastewater Treatment Plant Health Dashboard Example
A wastewater utility operations manager opens this dashboard at the start of the week to assess asset health monitoring wastewater treatment performance across all facilities. Using the Region, Plant Type, and Asset Risk Level filters, the team narrows its focus to high-risk plants where the Asset Health Distribution donut chart shows an elevated share of assets rated Poor. The Energy Efficiency Trend line chart reveals seasonal spikes in energy intensity, while the Nutrient Removal Efficiency gauge confirms whether treatment output is meeting the 90% target - supporting ongoing regulatory compliance rate wastewater plants reporting requirements. The Asset Replacement Needs Forecast waterfall chart helps capital planning teams identify which forecast years carry the highest cumulative replacement cost, while the Unplanned Downtime by Asset Type bar chart pinpoints which equipment categories - Pumps, Blowers/Aerators, Clarifiers, Digesters, or Pipes/Valves are driving the most operational disruption.
How to Analyze Data in a Wastewater Treatment Plant Health Dashboard
Here is how you can analyze data from this dashboard:
- Use the Region and Plant Type filters to isolate performance data for specific facilities or asset categories.
- Monitor the Energy Efficiency Trend line chart to detect rising energy intensity before it affects operating budgets.
- Review the Asset Health Distribution donut chart to track the ratio of Good, Fair, and Poor-rated assets year over year.
- Use the Unplanned Downtime by Asset Type bar chart to identify which equipment group drives the most lost hours — supporting unplanned downtime reduction wastewater assets planning.
- Compare Asset Risk Level filter settings to find facilities with the highest proportion of at-risk assets.
- Analyze the Nutrient Removal Efficiency gauge to confirm treatment output meets the 90% target and supports nutrient removal efficiency monitoring requirements.
- Filter by Forecast Year in the Asset Replacement Needs Forecast chart to align capital budgets with multi-year replacement schedules.
- Track Preventive Maintenance Compliance and Mean Time Between Failures together to measure how maintenance frequency affects equipment longevity.
Benefits of a Wastewater Treatment Plant Health Dashboard
The following are the benefits of using this dashboard:
- Centralizes asset health, compliance, and energy metrics across all treatment facilities in one structured template.
- Supports regulatory compliance rate wastewater plants tracking across multiple reporting frameworks simultaneously.
- Reduces manual data compilation for infrastructure reporting with pre-built KPI tiles and chart layouts.
- Enables region-level analysis of unplanned downtime reduction wastewater assets to guide capital investment decisions.
- Provides a waterfall breakdown of cumulative capital replacement cost for multi-year infrastructure planning.
- Helps operations teams align with environmental standards without rebuilding compliance reports from scratch.
- Gives plant managers and capital planners a shared view of asset health and preventive maintenance compliance tracking performance.
KPIs to Track in a Wastewater Treatment Plant Health Dashboard
The following key KPIs can be tracked by using this dashboard:
- Overall Asset Health Index: This wastewater treatment plant health dashboard KPI aggregates condition scores across all monitored assets — giving operators an immediate read on fleet-wide health.
- Regulatory Compliance Rate (%): Tracks the percentage of operations meeting environmental and regulatory standards — central to the regulatory compliance rate of wastewater plants reporting.
- Unplanned Downtime (%): Quantifies the share of time assets are offline unexpectedly — key to unplanned downtime reduction, wastewater assets analysis, and maintenance prioritization.
- Preventive Maintenance Compliance (%): Measures how consistently scheduled maintenance tasks are completed — the foundation of preventive maintenance compliance tracking across all asset types.
- Mean Time Between Failures (days): Evaluates equipment reliability by calculating the average interval between failures — supporting long-term asset lifecycle planning.
- Asset Utilization Rate (%): Tracks how efficiently assets are being used across plant operations — informing capacity planning and nutrient removal efficiency monitoring performance reviews.
Frequently Asked Questions
1. What industries benefit most from this Wastewater Treatment Plant Health Dashboard?
Municipal water utilities, industrial wastewater treatment operators, and environmental compliance teams benefit most. It is also used by infrastructure asset managers responsible for long-term capital planning across treatment facilities.
2. Can this dashboard track asset replacement cost forecasts?
Yes. The Asset Replacement Needs Forecast waterfall chart shows cumulative capital replacement cost by year from 2026 through 2030, plus a total. Teams use it to align budget cycles with projected infrastructure investment needs.
3. Is this dashboard suitable for multi-facility wastewater operations?
Yes. The Region, Plant Type, and Asset Risk Level filters allow teams to slice performance data by facility group or asset category. This makes it practical for operations managers overseeing multiple treatment plants simultaneously.
4. How does the Asset Health Distribution chart work?
The Asset Health Distribution donut chart segments all monitored assets into three condition categories — Good, Fair, and Poor — for the selected year. It gives operations teams an instant visual of fleet health and helps prioritize inspection or replacement activity.
5. What does Preventive Maintenance Compliance measure?
Preventive maintenance compliance tracking measures the percentage of scheduled maintenance tasks completed on time across all asset types. A high score indicates strong maintenance discipline, which directly reduces unplanned failures and extends asset service life.