What is an Irrigation & Water Distribution Regulatory Compliance Dashboard?
An Irrigation & Water Distribution Regulatory Compliance Dashboard is a centralized monitoring solution that helps irrigation authorities, water utilities, and regulatory teams track compliance performance across permits, reporting requirements, water diversion regulations, and audit obligations. The dashboard provides visibility into compliance status, active violations, permit utilization, audit resolution progress, and regulatory reporting performance. By consolidating compliance metrics into a single view, organizations can reduce regulatory risks, improve reporting accuracy, and ensure adherence to water governance standards. An irrigation and water distribution regulatory compliance dashboard enables teams to monitor compliance trends, identify areas with recurring violations, and proactively address regulatory concerns before they result in penalties. The dashboard supports irrigation network regulatory compliance monitoring by helping managers oversee permit conditions, track audit findings, and maintain transparency across jurisdictions. It also functions as a water utility compliance tracking and monitoring solution that strengthens operational governance and regulatory accountability.
How to Create an Irrigation & Water Distribution Regulatory Compliance Dashboard
You don't need to build your report from scratch, just start with a ready-to-use dashboard template from Mokkup. Add in your data and export it however you like. Here's how to do it:
1. Create or Log in to Your Mokkup Account
Start by signing up on Mokkup.ai using your email. If you already have an account, just log in, and you'll be good to go.
2. Choose and Customize Your Dashboard Template
Find the Irrigation & Water Distribution Regulatory Compliance Dashboard template in the Templates section. Use the drag-and-drop editor to adjust KPIs, edit filters, or add elements based on your data.
3. Export to Your BI Tool
Once your dashboard wireframe is ready, use the BI Tool Export feature to send it directly to Power BI or Tableau for further analysis and enhancements. You can also download the dashboard as a PDF, PNG, or JPEG, embed it on a platform, or invite your team to collaborate.
Note: This is a Pro template. You'll need a Pro subscription on Mokkup to use and customize this dashboard wireframe. Upgrade anytime to unlock full access.
Irrigation & Water Distribution Regulatory Compliance Dashboard Example
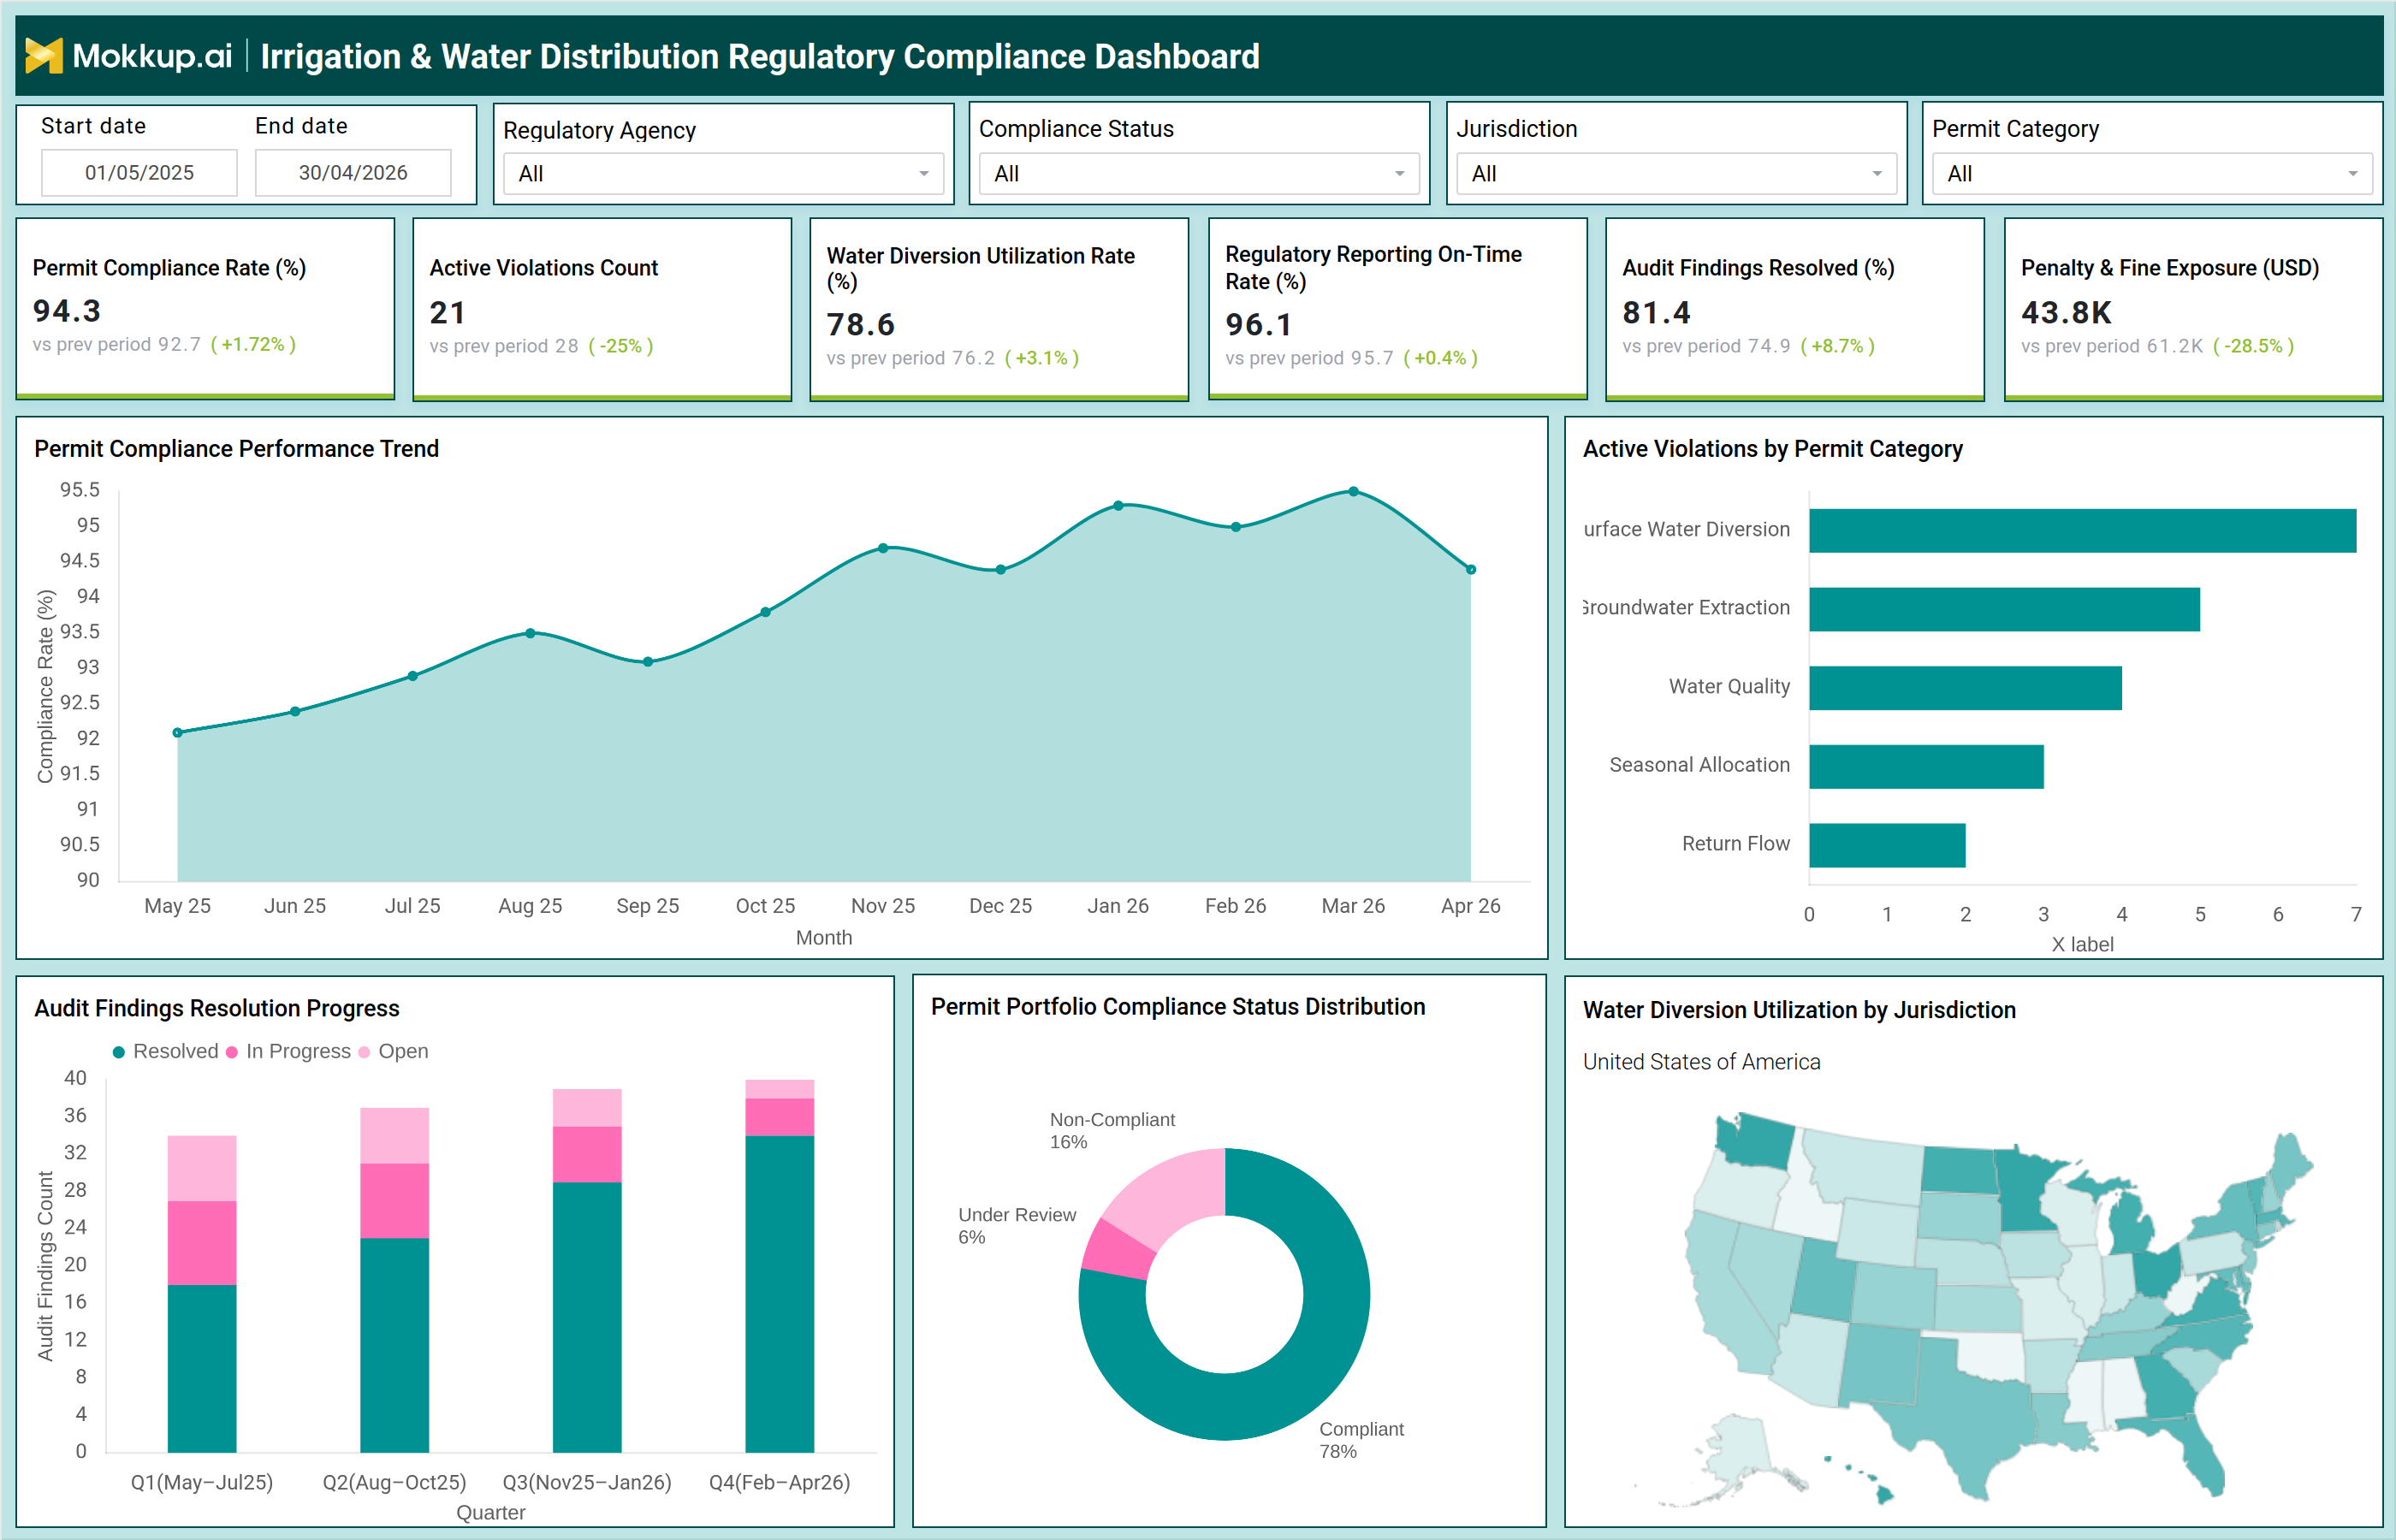
A regional water utility managing multiple irrigation networks and water diversion permits can use this dashboard to oversee compliance activities across operational regions. The dashboard may display key metrics such as Permit Compliance Rate, Active Violations Count, Water Diversion Utilization Rate, Regulatory Reporting On-Time Rate, Audit Findings Resolved, and Penalty & Fine Exposure. Compliance managers can review permit compliance performance trends to evaluate whether regulatory requirements are consistently met over time. Active violation analysis helps identify permit categories with the highest number of compliance issues, such as surface water diversion, groundwater extraction, or water quality permits.
The irrigation infrastructure regulatory reporting dashboard allows teams to monitor reporting deadlines and ensure submissions are completed on schedule. The dashboard also supports irrigation system regulatory audit management by tracking audit findings through different resolution stages. Regional maps displaying water diversion utilization help regulators and utility operators understand resource usage patterns across jurisdictions. This enables proactive compliance management while minimizing financial and operational risks.
How to Analyze Data in Irrigation & Water Distribution Regulatory Compliance Dashboard
Here is how you can analyze data from this dashboard:
- Monitor Permit Compliance Rate (%): Measure overall adherence to permit requirements and regulatory obligations to ensure consistent compliance across operations.
- Track Active Violations Count: Monitor unresolved compliance violations to identify regulatory risks and prioritize corrective actions.
- Analyze Water Diversion Utilization Rate (%): Evaluate water usage against authorized diversion limits to ensure regulatory compliance and sustainable resource management.
- Review Regulatory Reporting On-Time Rate (%): Track the timely submission of required regulatory reports to assess reporting efficiency and compliance performance.
- Monitor Audit Findings Resolved (%): Measure the percentage of audit findings that have been addressed and closed to evaluate remediation effectiveness.
- Track Penalty and Fine Exposure (USD): Assess potential financial liabilities resulting from noncompliance, violations, or unresolved audit findings.
- Analyze Permit Compliance Performance Trends: Review historical compliance data to identify long-term improvements, recurring issues, or declining compliance performance.
- Review Active Violations by Permit Category: Categorize violations by permit type to identify areas with the highest compliance risk and focus remediation efforts.
- Monitor Audit Findings Resolution Progress: Track the status of corrective actions to ensure audit recommendations are implemented efficiently and on schedule.
- Analyze Permit Portfolio Compliance Status Distribution: Evaluate compliance levels across the entire permit portfolio to gain a comprehensive view of regulatory health.
- Review Water Diversion Utilization by Jurisdiction: Compare water usage across jurisdictions to identify regional compliance concerns and ensure adherence to local regulations.
- Compare Compliance Performance Across Operations: Benchmark compliance metrics across agencies, permit categories, and operational regions to identify best practices and improvement opportunities.
Benefits of Irrigation & Water Distribution Regulatory Compliance Dashboard
The following are the benefits of using this irrigation system regulatory audit management dashboard:
- Improves Visibility into Compliance Performance: Provides a centralized view of regulatory compliance metrics, enabling organizations to monitor adherence and identify potential issues more effectively.
- Reduces the Risk of Violations and Penalties: Helps detect noncompliance issues early, minimizing the likelihood of regulatory violations, fines, and enforcement actions.
- Supports Timely Regulatory Reporting: Ensures required reports and documentation are submitted on schedule, improving compliance efficiency and reducing reporting risks.
- Helps Identify Compliance Gaps Before Audits: Continuously monitors compliance performance to uncover deficiencies and address them proactively before regulatory audits occur.
- Improves Audit Readiness: Maintains accurate compliance records and tracks corrective actions, ensuring irrigation operations are prepared for audits and inspections.
- Enables Proactive Violation Management: Identifies active violations and supports timely corrective actions to prevent issues from escalating into larger compliance risks.
- Enhances Governance and Accountability: Strengthens oversight by providing clear visibility into compliance responsibilities, performance metrics, and regulatory obligations.
- Supports Water Diversion Monitoring and Permit Management: Tracks water usage and permit compliance to ensure operations remain within authorized limits and regulatory requirements.
- Reduces Financial Exposure: Minimizes the risk of penalties, fines, and compliance-related costs through continuous monitoring and risk mitigation.
- Improves Decision-Making with Compliance Analytics: Delivers actionable insights and performance trends that support informed regulatory and operational decisions.
- Strengthens Operational Transparency: Provides consistent compliance visibility across jurisdictions, regions, and operational units to improve stakeholder confidence.
- Supports Continuous Compliance Improvement: Enables ongoing monitoring, benchmarking, and performance evaluation to drive long-term regulatory excellence and operational compliance.
KPIs to Track in Irrigation & Water Distribution Regulatory Compliance Dashboard
The following key KPIs can be tracked by using this water utility compliance tracking and monitoring dashboard:
- Permit Compliance Rate (%): Measures the percentage of permits operating in compliance with regulatory requirements.
- Active Violations Count: Tracks the number of unresolved regulatory violations.
- Water Diversion Utilization Rate (%): Measures utilization of approved water diversion allocations.
- Regulatory Reporting On-Time Rate (%): Tracks the percentage of regulatory reports submitted on schedule.
- Audit Findings Resolved (%): Measures the percentage of audit findings successfully closed.
- Penalty & Fine Exposure (USD): Tracks potential financial exposure from compliance violations and penalties.
Frequently Asked Questions
1. Why is a regulatory compliance dashboard important for irrigation utilities?
It helps organizations monitor permits, violations, reporting obligations, audit findings, and regulatory risks in a centralized environment.
2. What compliance areas are commonly monitored?
Common areas include water diversion permits, groundwater extraction permits, water quality regulations, reporting compliance, and audit performance.
3. How does the dashboard help reduce regulatory risk?
By providing early visibility into violations, overdue reporting, audit findings, and potential compliance gaps that require corrective action.