
What is a Wastewater Treatment Digester Equipment Health Dashboard?
The Wastewater Treatment Digester Equipment Health Dashboard is a purpose-built monitoring tool used by plant managers, maintenance engineers, and operations teams to track the performance and reliability of anaerobic digester systems. This digester equipment health dashboard consolidates critical metrics such as equipment uptime availability, volatile solids destruction rate, methane content in biogas, and preventive maintenance compliance into a single, structured view. It helps facilities teams detect early signs of equipment degradation, schedule maintenance proactively, and ensure that digester assets are operating within acceptable performance bands. By centralizing biogas production quality tracking and equipment reliability data, the dashboard gives wastewater utilities the visibility they need to reduce unplanned downtime and extend asset life.
How to Create a Wastewater Treatment Digester Equipment Health Dashboard
You don't need to build your report from scratch; just start with a ready-to-use dashboard template from Mokkup. Add in your data and export it however you like. Here's how to do it:
1. Create or Log in to Your Mokkup Account
Start by signing up on Mokkup.ai using your email. If you already have an account, just log in, and you'll be good to go.
2. Choose and Customize Your Dashboard Template
Find the Wastewater Treatment Digester Equipment Health Dashboard template in the Templates section. Use the drag-and-drop editor to adjust KPIs, edit filters, or add elements based on your data.
3. Export to Your BI Tool
Once your dashboard wireframe is ready, use the BI Tool Export feature to send it directly to Power BI or Tableau for further analysis and enhancements. You can also download the dashboard as a PDF, PNG, or JPEG, embed it on a platform, or invite your team to collaborate.
Note: This is a Pro template. You'll need a Pro subscription on Mokkup to use and customize this dashboard wireframe. Upgrade anytime to unlock full access.
Wastewater Treatment Digester Equipment Health Dashboard Example
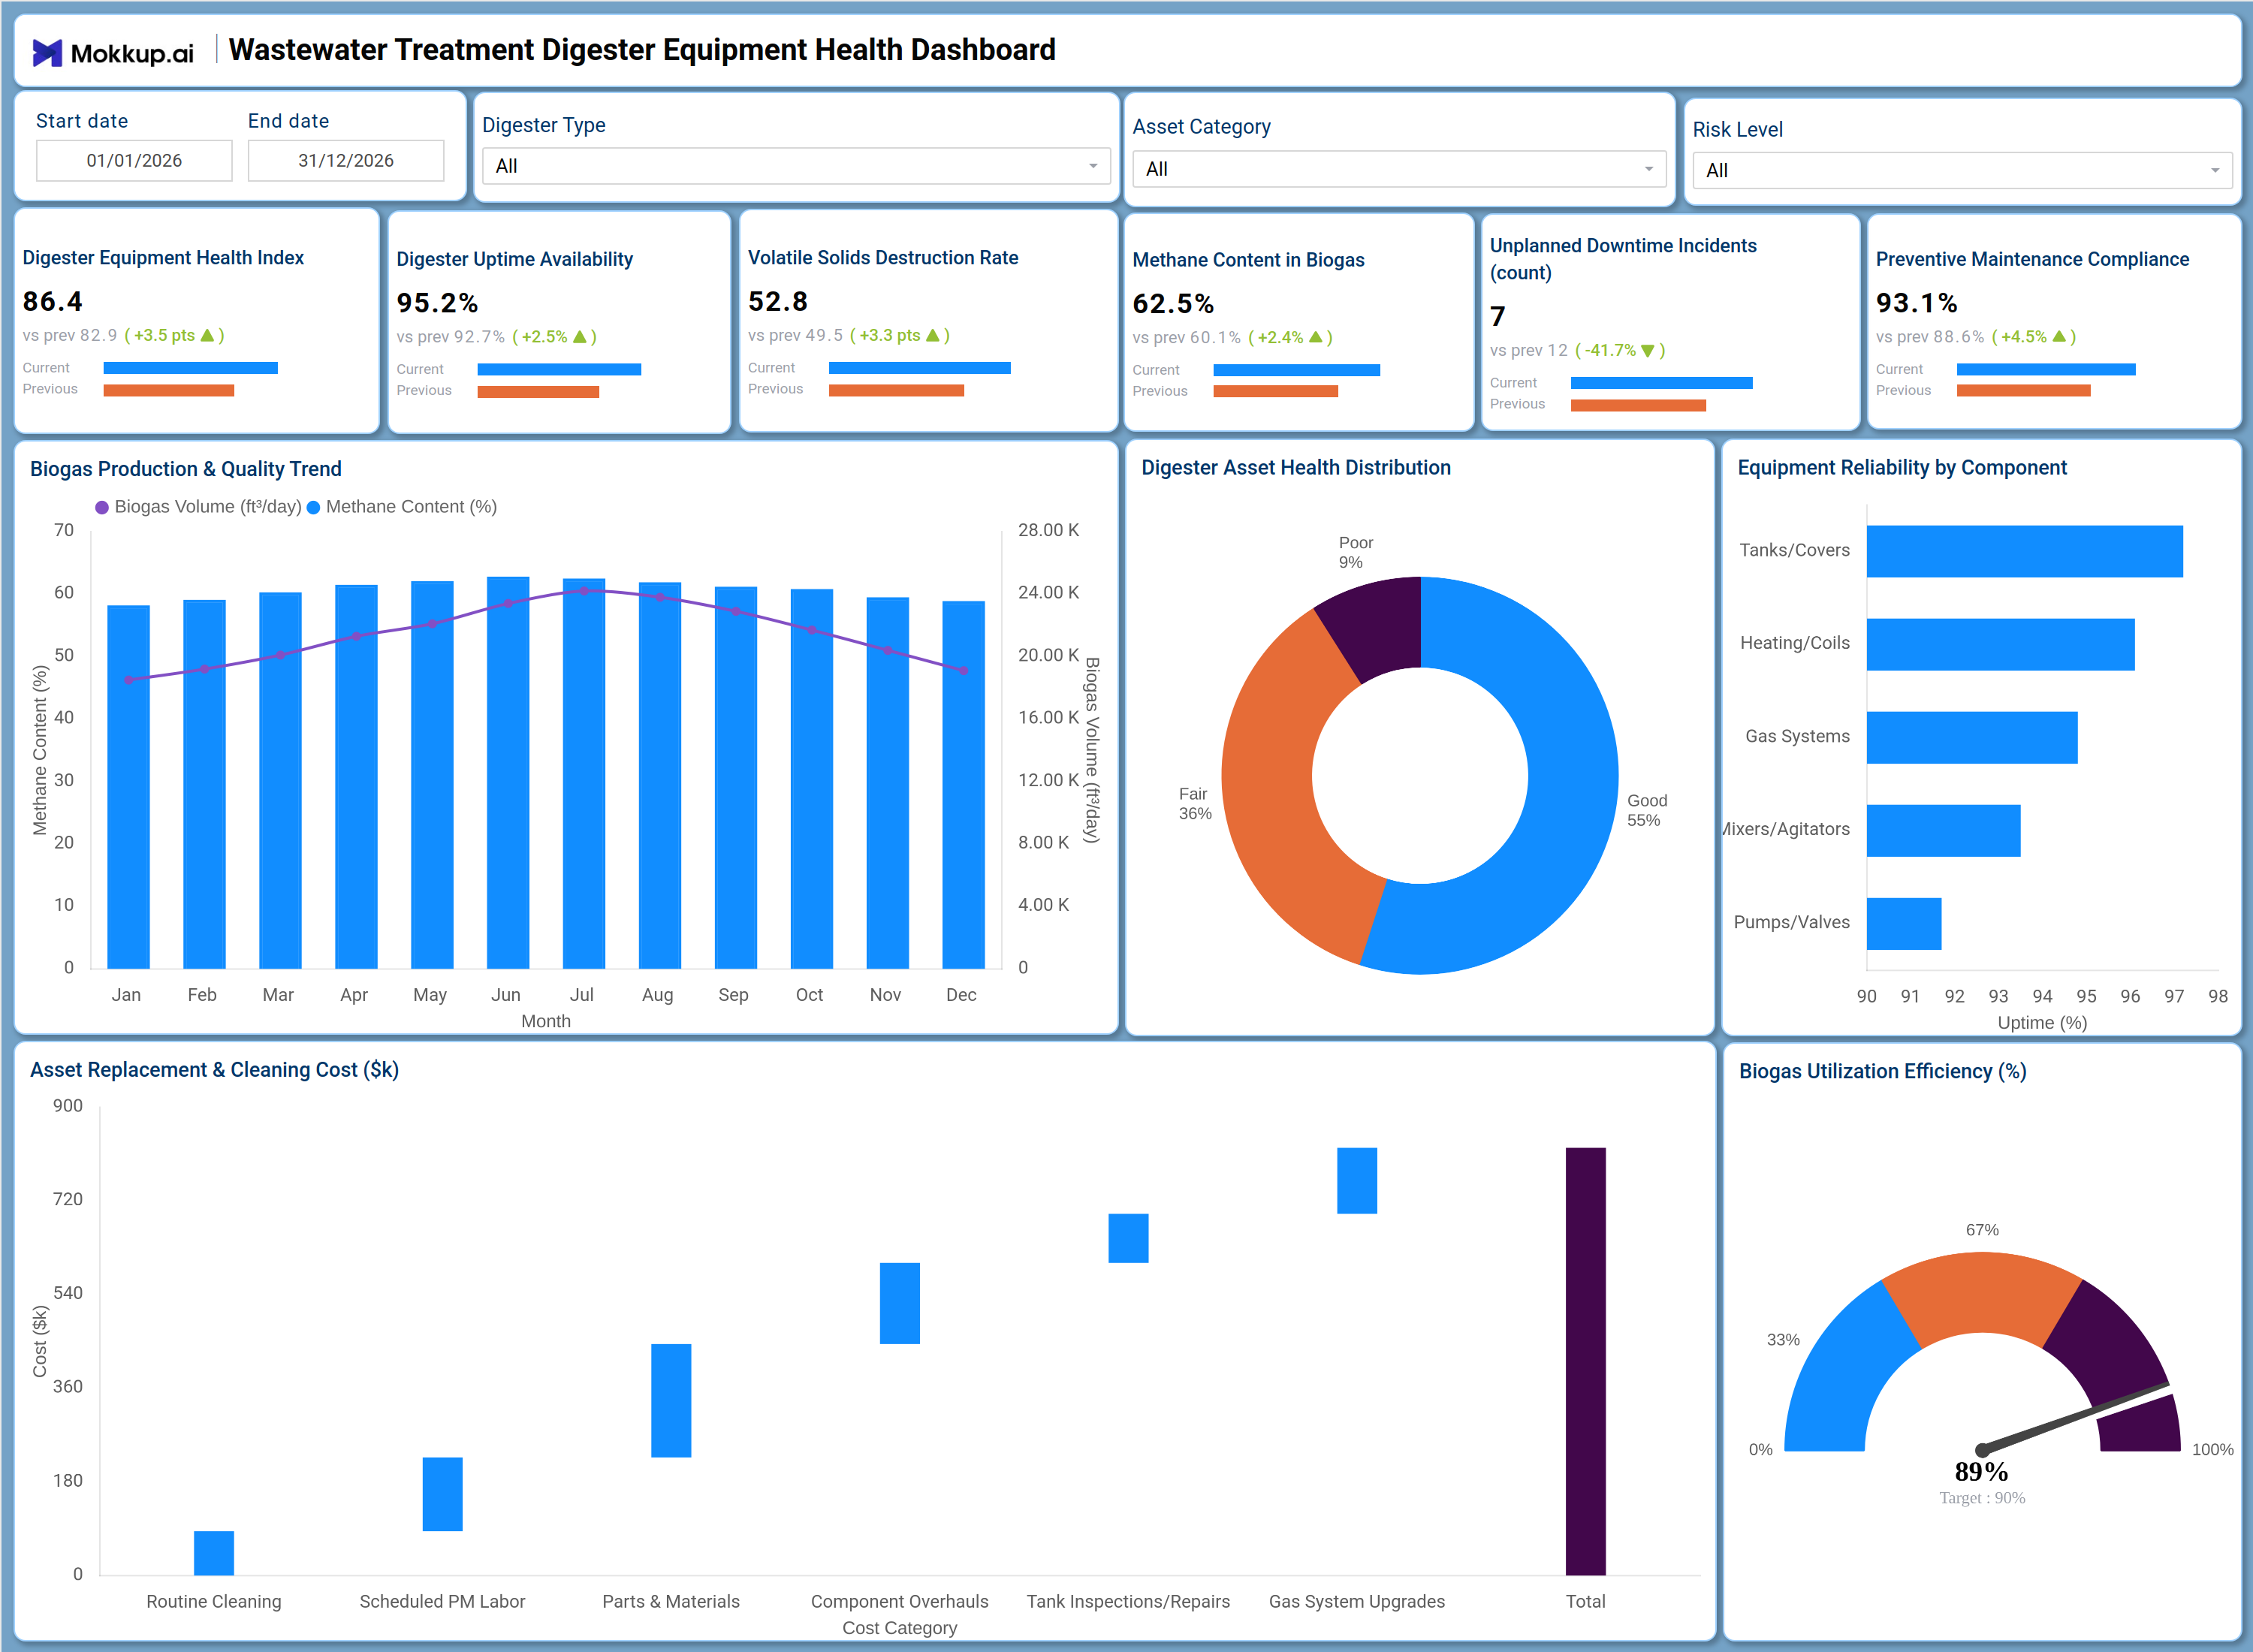
A wastewater plant operations manager opens this dashboard at the start of a weekly maintenance review to understand the overall health status of the facility's digester systems. By scanning the KPI tiles at the top, they can quickly assess whether digester uptime availability and preventive maintenance compliance are trending in the right direction compared to the previous period without digging through individual maintenance logs. The Digester Asset Health Distribution donut chart lets the team see at a glance what proportion of assets are classified as Good, Fair, or Poor, giving them an immediate sense of where to focus inspection efforts.
As the team works through the review, they use the Equipment Reliability by Component horizontal bar chart to compare uptime percentages across Tanks/Covers, Heating/Coils, Gas Systems, Mixers/Agitators, and Pumps/Valves, helping prioritize which component category needs immediate intervention. The Biogas Production & Quality Trend combo chart supports wastewater digester performance monitoring by showing how monthly biogas volume and methane content percentage move together over the year, which helps identify seasonal patterns or equipment-driven dips in gas quality. Combined with the Asset Replacement & Cleaning Cost breakdown and the Biogas Utilization Efficiency gauge, the dashboard gives maintenance planners and plant directors a complete operational picture that supports cost-conscious decisions about equipment upgrades and digester asset lifecycle management.
How to Analyze Data in a Wastewater Treatment Digester Equipment Health Dashboard
Here is how you can analyze data from this dashboard:
- Use the Digester Type filter to isolate performance data for specific digester units and compare equipment health across different system types.
- Monitor the Digester Equipment Health Index KPI tile to detect declining health scores before they translate into unplanned downtime incidents.
- Review the Digester Asset Health Distribution donut chart to identify the share of assets in Poor condition and prioritize corrective maintenance actions.
- Use the Equipment Reliability by Component bar chart to see which component categories — such as Pumps/Valves or Gas Systems — have the lowest uptime percentages.
- Analyze the Biogas Production & Quality Trend chart to track whether methane content in biogas is declining alongside changes in biogas volume output.
- Use the Asset Replacement & Cleaning Cost waterfall chart to identify which cost categories — such as Component Overhauls or Gas System Upgrades — are driving total maintenance spend.
- Filter by Risk Level to focus the dashboard on high-risk assets and align maintenance scheduling with the facilities most in need of intervention.
- Track Preventive Maintenance Compliance over time to measure progress in reducing reactive maintenance and improving scheduled uptime.
Benefits of a Wastewater Treatment Digester Equipment Health Dashboard
The following are the benefits of using this Diigester Uptime Availability Tracking dashboard:
- Centralizes digester uptime availability, methane content in biogas, and equipment reliability data across all digester components in one structured template.
- Supports wastewater digester performance monitoring across multiple asset categories simultaneously, eliminating the need for separate tracking tools.
- Reduces manual data compilation for maintenance and compliance reporting with pre-built KPI tiles and chart layouts.
- Enables component-level analysis of digester asset lifecycle management to guide capital planning and infrastructure replacement decisions.
- Provides a waterfall breakdown of Asset Replacement & Cleaning Cost categories for operational budget planning and cost control.
- Helps maintenance engineers align preventive work orders with actual equipment condition data from the Asset Health Distribution chart.
- Gives plant managers and operations teams a shared view of biogas production quality, tracking, and equipment reliability across the full digester system.
KPIs to Track in a Wastewater Treatment Digester Equipment Health Dashboard
The following key KPIs can be tracked by using this Wastewater Digester Equipment Health dashboard:
- Digester Equipment Health Index: KPIs (Key Performance Indicators) are metrics that track operational performance against targets — this index scores overall digester system health and supports wastewater digester performance monitoring by signaling when equipment condition is declining.
- Digester Uptime Availability (%): Tracks the percentage of scheduled time that digester equipment operates without failure — critical for evaluating digester uptime availability and scheduling planned maintenance windows.
- Volatile Solids Destruction Rate: Quantifies the efficiency of the anaerobic digestion process by measuring how much organic material is broken down — a direct indicator of digester process performance and loading optimization.
- Methane Content in Biogas (%): Measures the concentration of methane in the biogas produced — central to biogas production quality tracking and evaluating whether the digestion process is producing usable gas output.
- Unplanned Downtime Incidents (count): Counts the number of equipment failures that caused unscheduled outages — used to benchmark digester asset lifecycle management improvements and the effectiveness of preventive programs.
- Preventive Maintenance Compliance (%): Tracks what percentage of scheduled preventive maintenance tasks were completed on time — a key indicator of maintenance program discipline and its impact on digester uptime availability.
Frequently Asked Questions
1. What industries benefit most from this Wastewater Treatment Digester Equipment Health Dashboard?
This Methane Content in Biogas Monitoring dashboard is primarily used by municipal wastewater utilities, industrial wastewater treatment facilities, and biogas energy recovery plants. Maintenance engineers, plant operations managers, and sustainability teams all benefit from having digester equipment health and biogas production quality tracking in one place.
2. Can this dashboard track equipment reliability across different component categories?
Yes. The Equipment Reliability by Component chart displays uptime percentages for Tanks/Covers, Heating/Coils, Gas Systems, Mixers/Agitators, and Pumps/Valves separately. This allows maintenance teams to identify which component categories are underperforming and prioritize targeted inspections.
3. How does the Digester Asset Health Distribution chart work?
The Digester Asset Health Distribution is a donut chart that categorizes all monitored digester assets into Good, Fair, or Poor health status segments. Teams can use it to quickly assess the proportion of at-risk assets and direct maintenance resources toward components showing Fair or Poor conditions before failures occur.