
What is an Operational Excellence Assessment Dashboard?
An operational excellence assessment dashboard for enterprise performance is a data-driven tool used to evaluate how effectively an organization performs across key operational capabilities such as process efficiency, customer operations, digital systems, risk compliance, workforce productivity, and technology reliability. It consolidates performance metrics, maturity scores, and improvement trends into a unified interface to support continuous improvement initiatives. This operational excellence KPI monitoring and assessment dashboard enables organizations to measure capability maturity, identify underperforming areas, and benchmark performance across regions, business segments, and operational dimensions. It combines performance analytics with root cause insights, allowing decision-makers to move from performance tracking to targeted action planning. As a business process efficiency operational excellence dashboard, it supports structured assessments, operational audits, and performance optimization strategies at scale.
How to Create an Operational Excellence Assessment Dashboard
You don't need to build your report from scratch, just start with a ready-to-use dashboard template from Mokkup. Add in your data and export it however you like. Here's how to do it:
1. Create or Log in to Your Mokkup Account
Start by signing up on Mokkup.ai using your email. If you already have an account, just log in, and you'll be good to go.
2. Choose and Customize Your Dashboard Template
Find the Operational Excellence Assessment Dashboard template in the Templates section. Use the drag-and-drop editor to adjust KPIs, edit filters, or add elements based on your data.
3. Export to Your BI Tool
Once your dashboard wireframe is ready, use the BI Tool Export feature to send it directly to Power BI or Tableau for further analysis and enhancements. You can also download the dashboard as a PDF, PNG, or JPEG, embed it on a platform, or invite your team to collaborate.
Note: This is a Pro template. You'll need a Pro subscription on Mokkup to use and customize this dashboard wireframe. Upgrade anytime to unlock full access.
Operational Excellence Assessment Dashboard Example
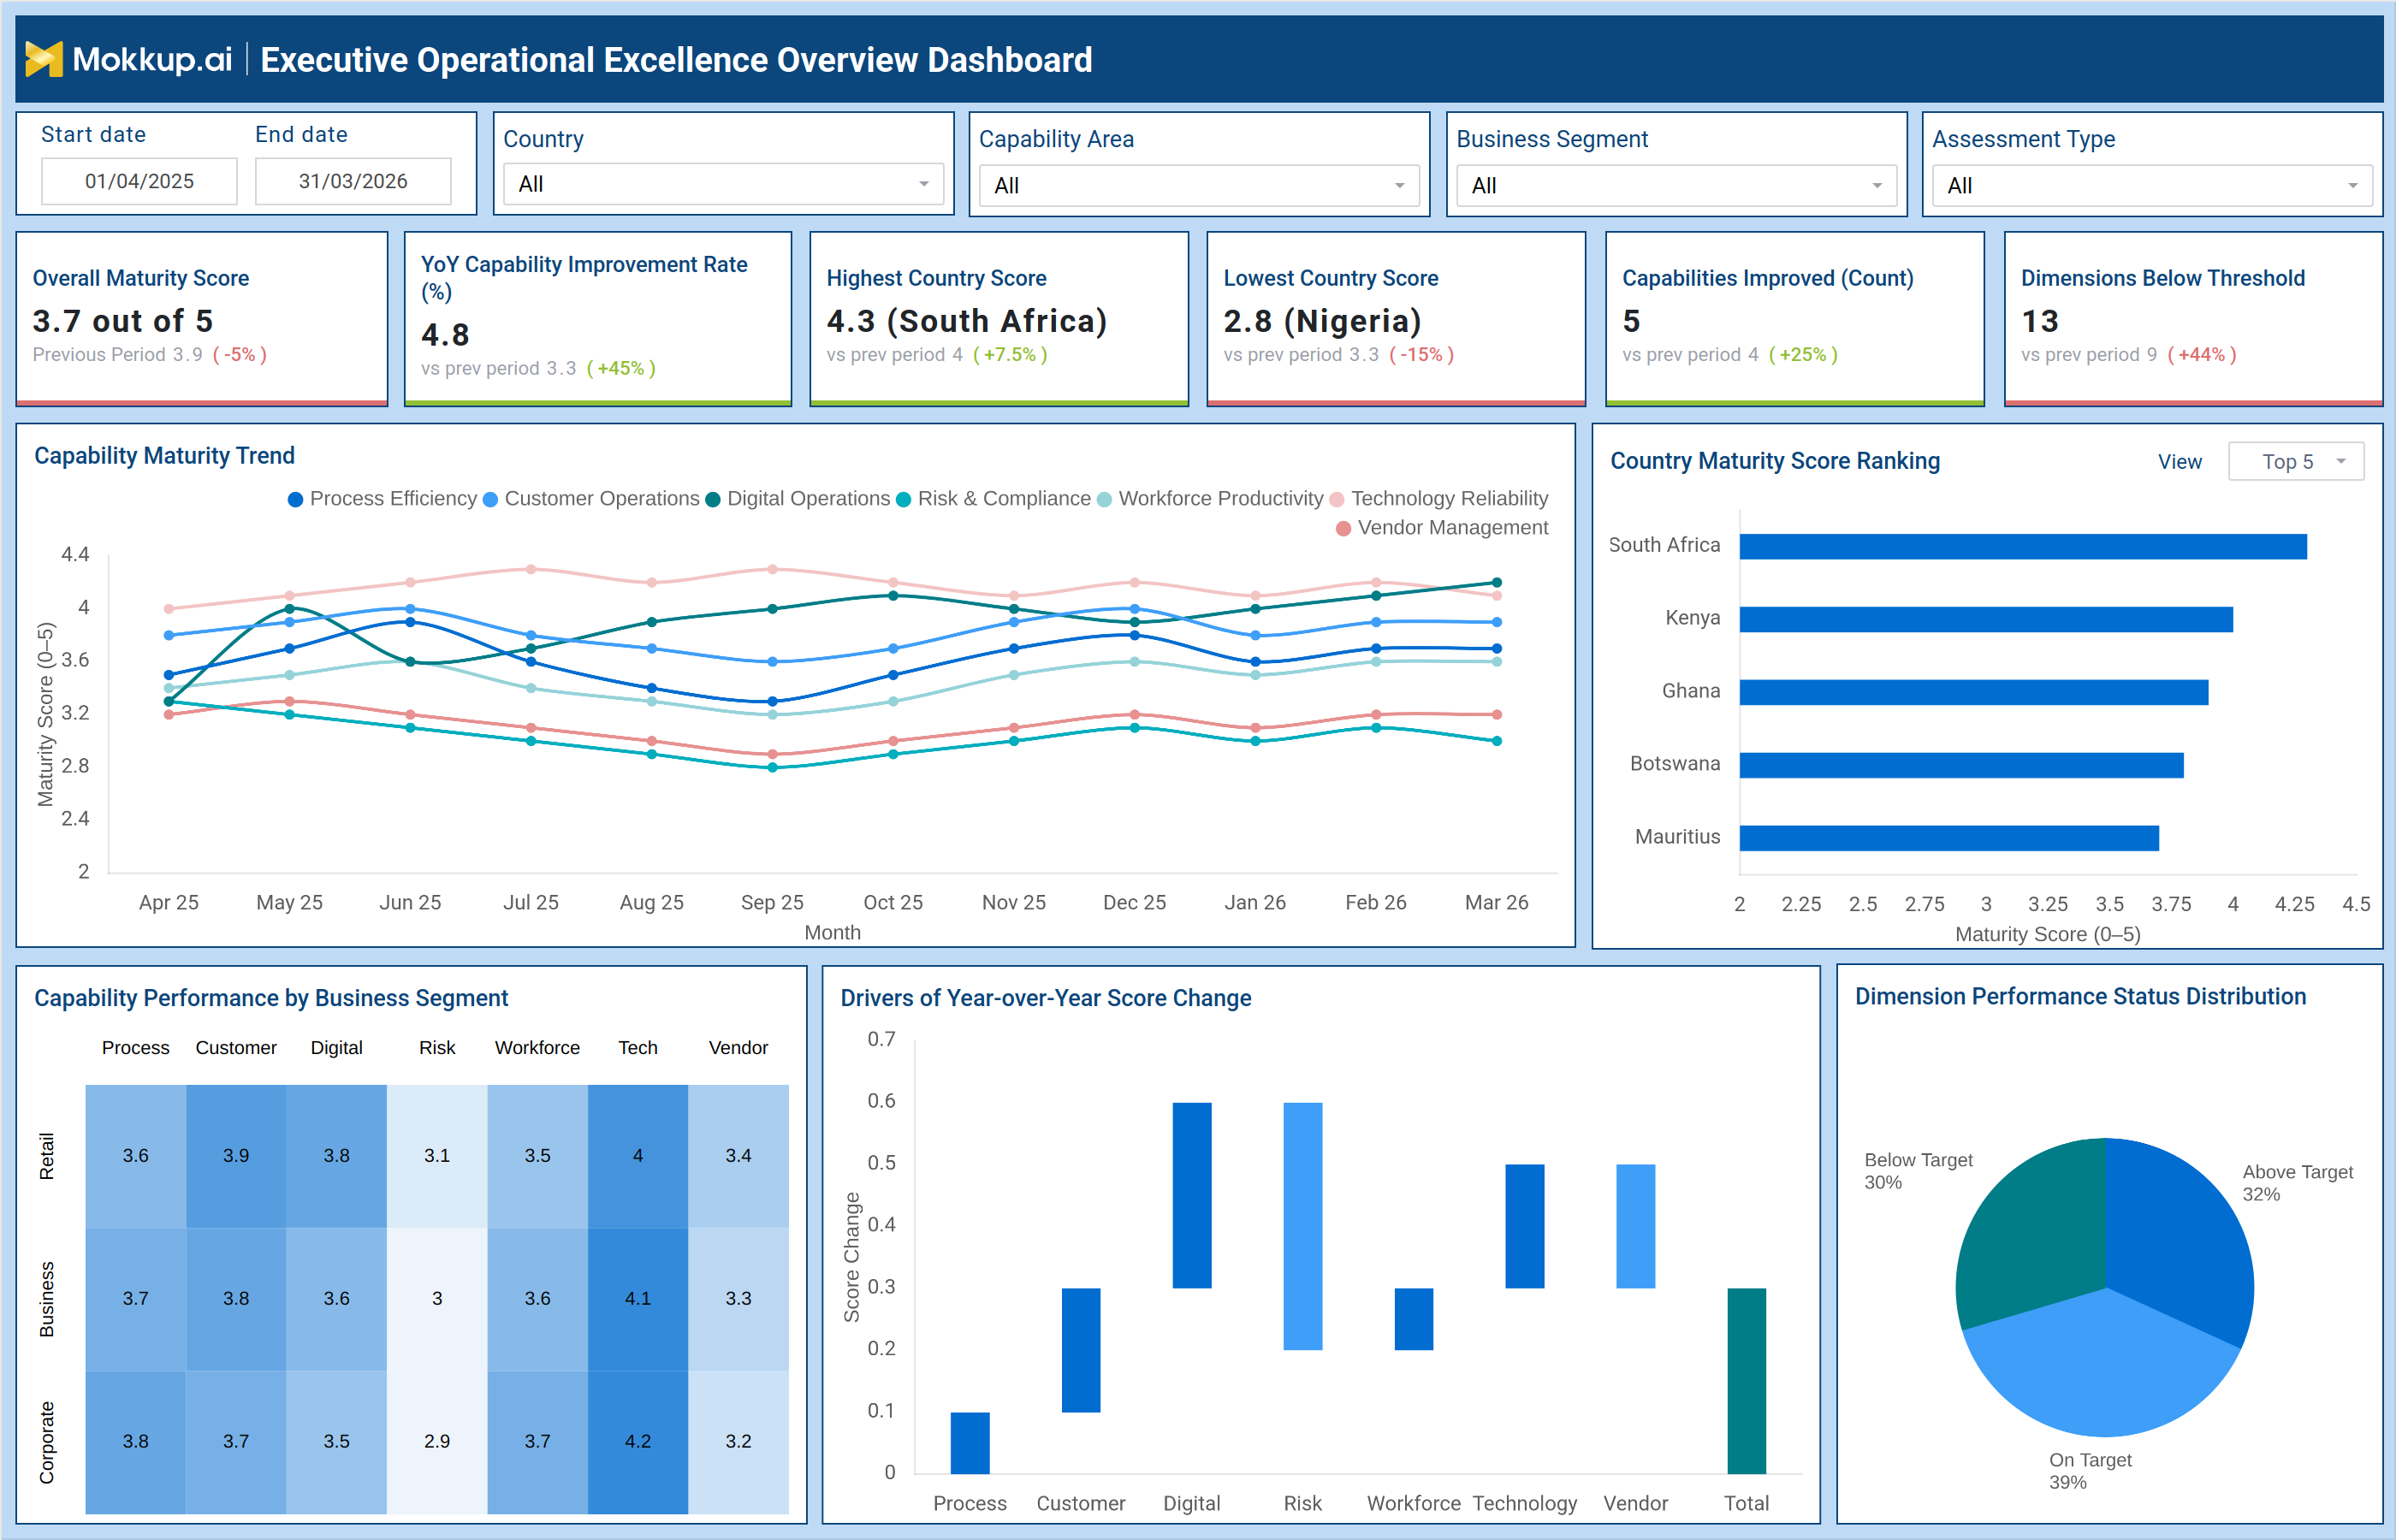
A typical operational excellence performance benchmarking dashboard provides a high-level view of enterprise maturity along with detailed diagnostics. For example, the dashboard may show an overall maturity score of 3.7 out of 5, indicating moderate operational performance. At the same time, a year-over-year improvement rate of 4.8% highlights ongoing progress. Country-level benchmarking shows performance variation, with top-performing regions scoring above 4.0 and others below 3.0, helping organizations identify geographic gaps. Capability maturity trends across dimensions such as digital operations and risk compliance provide visibility into improvement patterns over time.
The second layer of the dashboard focuses on root cause analysis and action planning. It highlights critical issues such as compliance gaps or process inefficiencies and links them to business impact. Priority action tables identify key problem areas, affected regions, and required actions. Root cause breakdowns categorize issues into system, process, and people-related factors. This integrated approach makes the enterprise operational excellence analytics and insights dashboard actionable by connecting performance measurement with corrective actions and strategic improvement plans.
How to Analyze Data in the Operational Excellence Assessment Dashboard
Here is how you can analyze data from this dashboard:
- Start with the overall maturity score: Assess enterprise-wide operational performance by reviewing the overall maturity score as a baseline indicator of how well the organization is functioning.
- Compare year-over-year improvement rate: Evaluate progress over time by analyzing how the maturity score has improved (or declined) compared to previous years.
- Analyze highest and lowest performing regions: Identify performance gaps by comparing regions to understand where operations are excelling and where they need improvement.
- Review capability maturity trends across dimensions: Track improvement patterns by examining how different capability areas (e.g., processes, systems, workforce) are evolving.
- Evaluate dimensions below threshold: Identify critical weaknesses by focusing on areas that fall below acceptable performance benchmarks.
- Analyze capability performance by business segment: Detect operational differences by comparing performance across different business units or segments.
- Review drivers of score change: Understand improvement or decline factors by analyzing what contributed to changes in maturity scores.
- Examine the priority action table: Identify high-impact issues and required actions by focusing on prioritized recommendations for improvement.
- Analyze root cause breakdown: Determine whether issues stem from systems, processes, or people to ensure targeted problem-solving.
- Track underperforming dimension trends over time: Assess improvement effectiveness by monitoring whether previously weak areas are improving consistently.
Benefits of Operational Excellence Assessment Dashboard
The following are the benefits of using this dashboard:
- Provides a unified view of enterprise operational performance: Offers a consolidated perspective of performance across the organization, enabling stakeholders to understand overall operational health in one place.
- Enables data-driven decision-making for continuous improvement: Supports informed decisions by leveraging data insights to drive ongoing enhancements in processes and performance.
- Identifies underperforming areas across capabilities and regions: Highlights weak spots across different functions and geographies, helping prioritize areas that need attention.
- Supports benchmarking across countries, business units, and dimensions: Allows comparison of performance across multiple entities to identify best practices and performance gaps.
- Improves process efficiency by highlighting operational gaps: Identifies inefficiencies and bottlenecks in processes, enabling targeted improvements.
- Enhances accountability through clear performance tracking: Establishes transparency by tracking performance metrics, ensuring teams are accountable for outcomes.
- Aligns business strategy with operational performance metrics: Ensures that operational activities are directly linked to strategic goals, improving overall business alignment.
- Enables proactive issue resolution through root cause analysis: Helps identify underlying causes of issues early, allowing teams to address problems before they escalate.
- Supports structured operational audits and maturity assessments: Facilitates systematic evaluations of operations to measure maturity levels and ensure compliance with standards.
- Drives long-term operational efficiency and performance optimization: Promotes sustained improvements by continuously refining processes and optimizing performance over time.
KPIs to Track in Operational Excellence Assessment Dashboard
The following key KPIs can be tracked by using this dashboard:
- Overall Maturity Score: Measures overall operational capability maturity across the enterprise
- YoY Capability Improvement Rate: Tracks year-over-year improvement in capability performance
- Highest Country Score: Identifies the top-performing country based on the maturity score
- Lowest Country Score: Highlights the lowest-performing country requiring attention
- Capabilities Improved (Count): Number of capabilities that showed improvement over time
- Dimensions Below Threshold: Count of underperforming dimensions below acceptable levels
- Overall Dimension Health Score: Measures overall health across operational dimensions
- Dimensions Meeting Target: Number of dimensions achieving defined performance thresholds
- Most Critical Issue: Identifies the highest-impact operational issue
- Best Performing Dimension: Highlights the top-performing operational area
- Countries Requiring Attention: Number of countries needing improvement focus
- Fastest Improving Dimension: Tracks the dimension with the highest improvement rate
Frequently Asked Questions
1. What is the purpose of an operational excellence assessment dashboard?
It helps organizations measure, monitor, and improve operational performance across multiple capabilities and business units.
2. Who uses this dashboard?
Executives, operations leaders, performance managers, and strategy teams use it for monitoring and improvement planning.
3. How does this dashboard improve operational efficiency?
It identifies performance gaps and root causes, enabling targeted actions to improve processes and outcomes.