
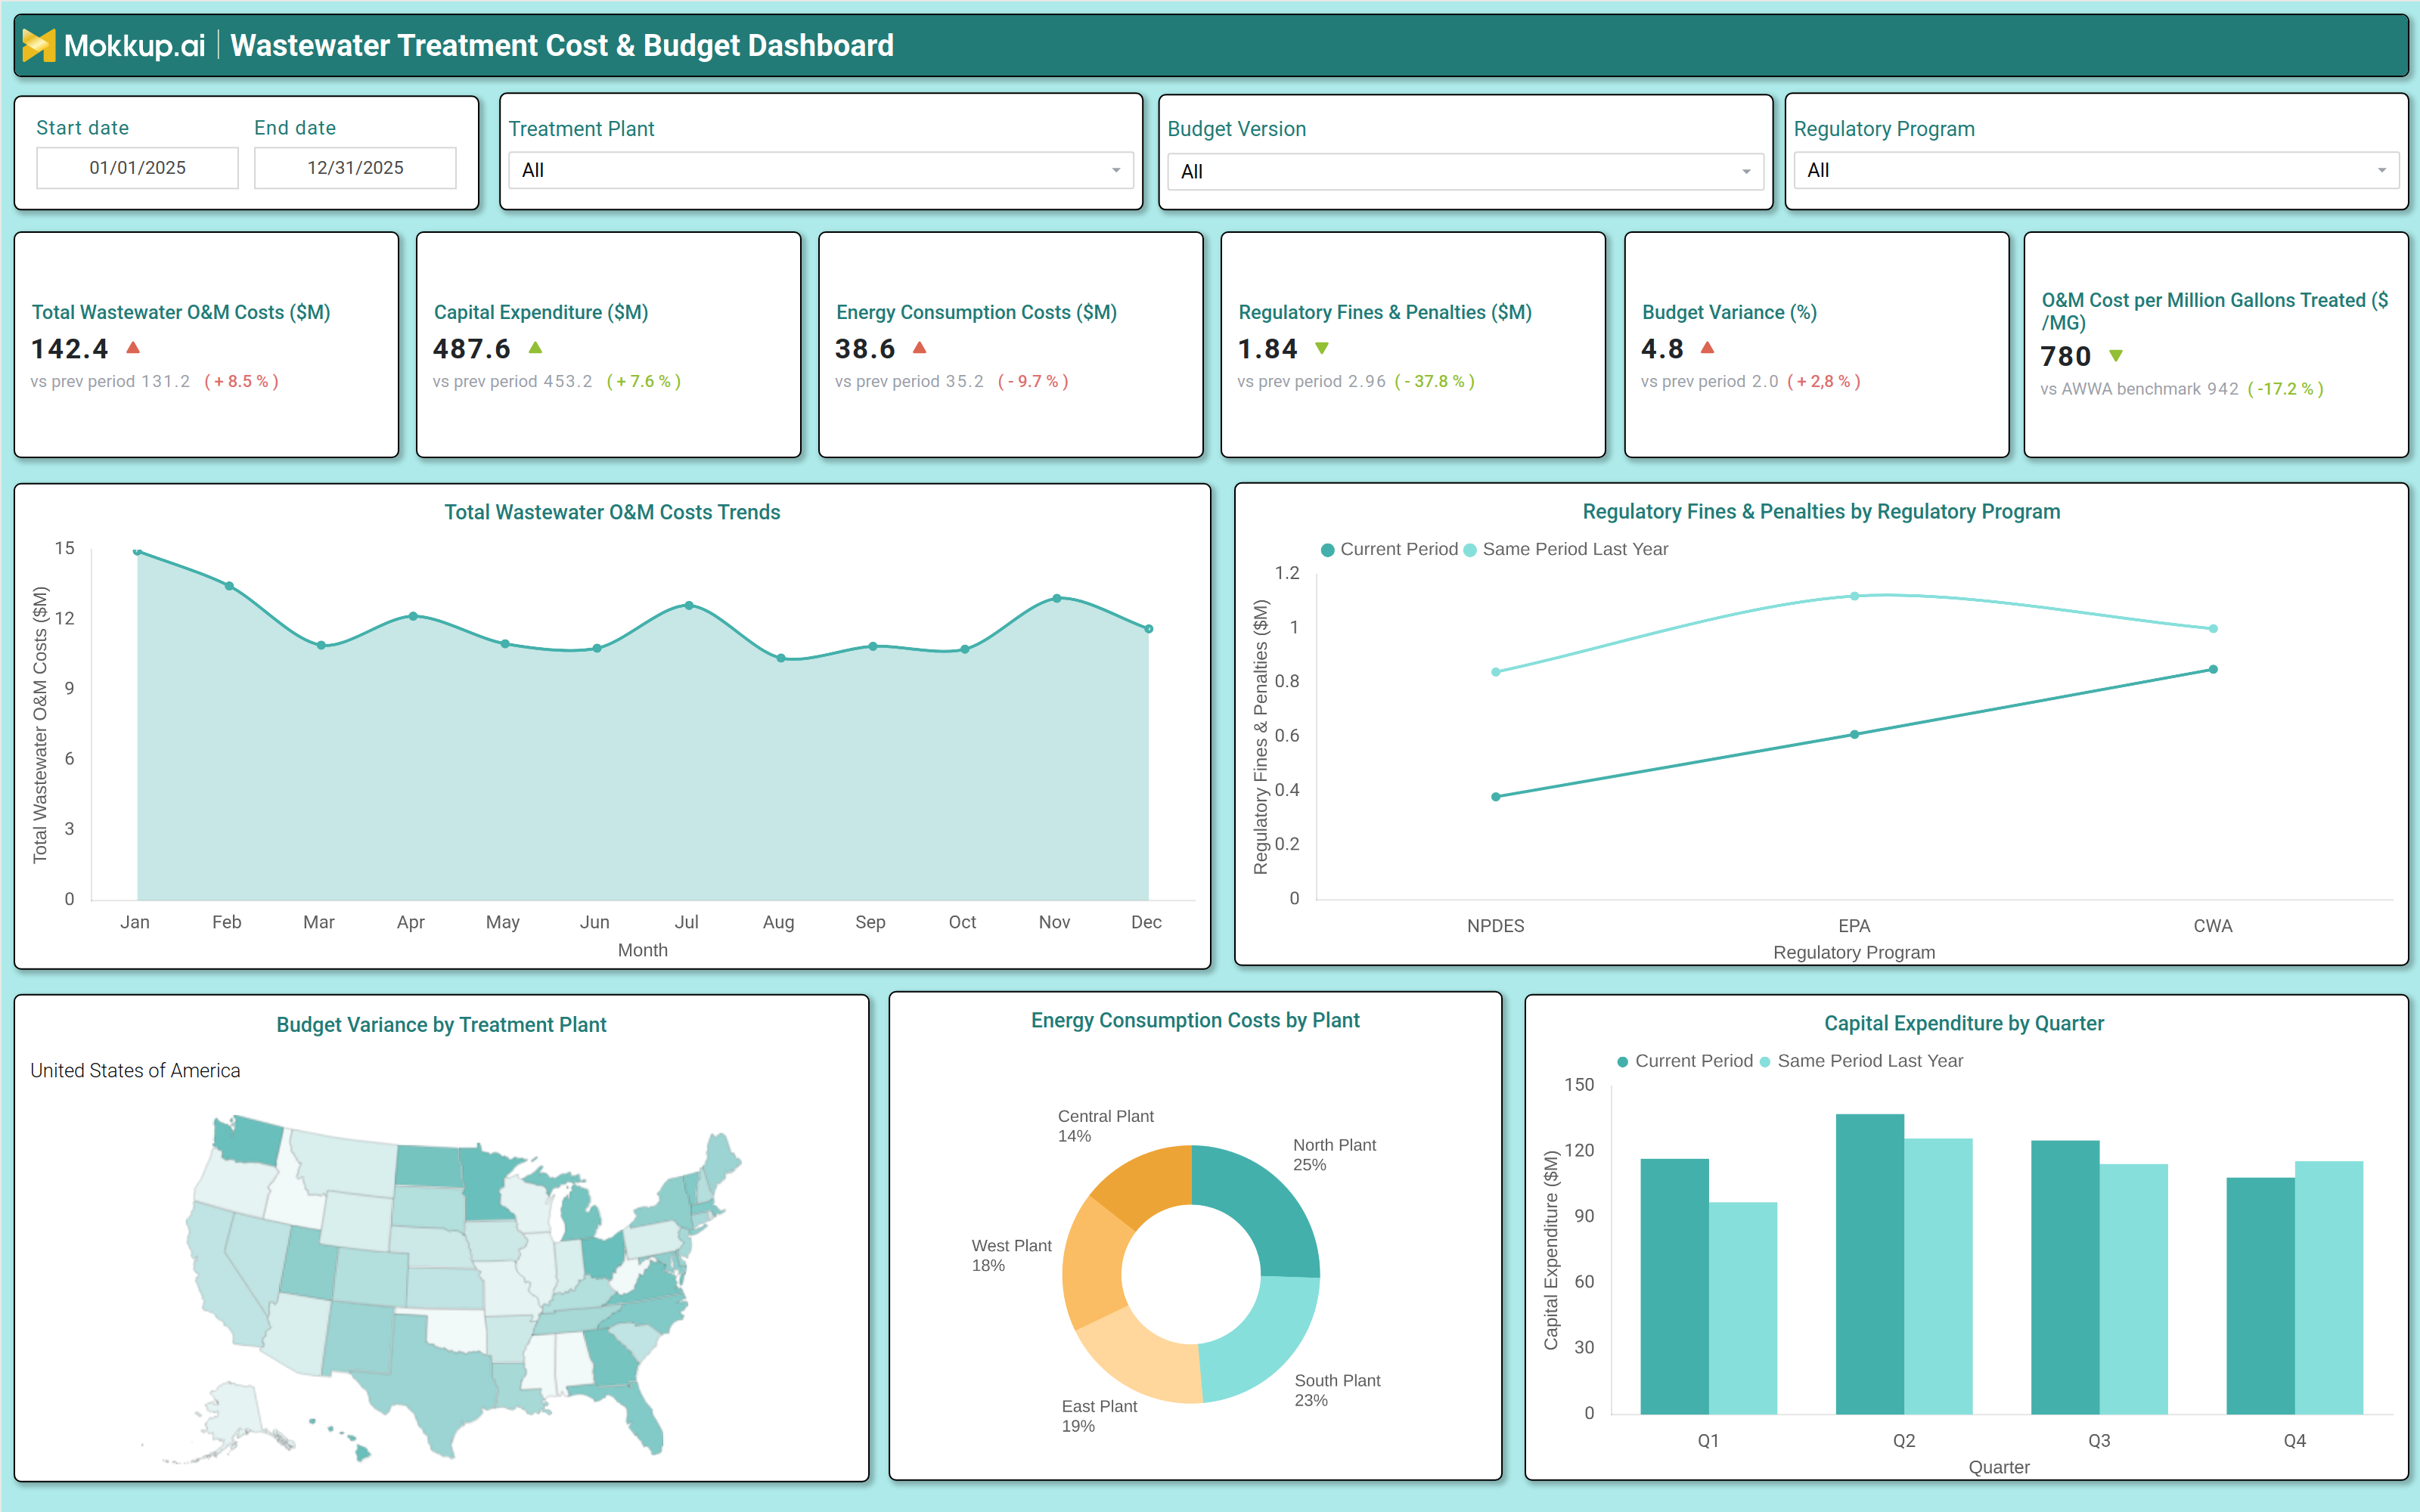
What is a Wastewater Treatment Cost & Budget Dashboard?
A wastewater treatment cost budget dashboard provides finance managers, utility directors, and operations teams with a structured view of how operating costs, capital investments, regulatory penalties, and budget performance are trending across treatment facilities. It tracks KPIs, including total O&M costs, capital expenditures, energy consumption costs, regulatory fines, and budget variance, as well as a normalized O&M cost per million gallons treated to benchmark efficiency against industry standards. Energy consumption cost wastewater treatment metrics sit alongside compliance penalty trends, giving leadership a complete picture of both operational spending and the financial consequences of regulatory exposure. Municipal utilities, regional wastewater authorities, and multi-plant treatment operators use this template to manage cost performance, align capital deployment, and ensure financial oversight keeps pace with operational complexity.
How to Create a Wastewater Treatment Cost & Budget Dashboard
You don’t need to build your report from scratch; just start with a ready-to-use dashboard template from Mokkup. Add in your data and export it however you like. Here’s how to do it:
1. Create or Log in to Your Mokkup Account
Start by signing up on Mokkup.ai using your email. If you already have an account, just log in, and you'll be good to go.
2. Choose and Customize Your Dashboard Template
Find the Wastewater Treatment Cost & Budget Dashboard template in the Templates section. Use the drag-and-drop editor to adjust KPIs, edit filters, or add elements based on your data.
3. Export to Your BI Tool
Once your dashboard wireframe is ready, use the BI Tool Export feature to send it directly to Power BI or Tableau for further analysis and enhancements. You can also download the dashboard as a PDF, PNG, or JPEG, embed it on a platform, or invite your team to collaborate.
Note: This is a Pro template. You'll need a Pro subscription on Mokkup to use and customize this dashboard wireframe. Upgrade anytime to unlock full access.
Wastewater Treatment Cost & Budget Dashboard Example
A finance director and operations manager open this dashboard together at the start of each budget review cycle to assess how actual spending is tracking against plan across the full facility portfolio. The KPI tiles give an immediate read on financial health, whether O&M costs are growing faster than treated volume, whether capital expenditure is on pace with the approved infrastructure plan, and whether regulatory fines have declined from the prior period. The O & M cost per million gallons treated tile is particularly actionable, as it benchmarks the utility's cost efficiency directly against industry standards, allowing leadership to determine whether the organization is operating competitively or where wastewater O&M cost efficiency tracking efforts need to be intensified. Budget managers use the monthly O&M cost trend chart to identify whether spending is seasonal and predictable or whether specific months are generating cost spikes that require investigation.
When a mid-year cost surge appears, the Treatment Plant filter narrows the view to isolate whether a single facility is driving the anomaly, enabling targeted conversations with plant managers rather than broad budget interventions. The Budget Variance by Treatment Plant map extends this analysis geographically, showing which plant locations are consistently running over budget and where financial controls may need to be tightened. Compliance and finance teams rely on the regulatory fines penalties wastewater compliance view to monitor whether NPDES, EPA, and CWA program fines are declining relative to the same period last year.
A reduction in penalties signals that operational investments in compliance are paying off, while a rising fine under a specific regulatory program tells the team exactly where to focus remediation resources before the next inspection cycle. Capital planning teams use the quarterly CAPEX comparison chart to assess whether infrastructure investment is being deployed on schedule relative to prior-year pacing, supporting budget variance treatment plant analysis and cash flow management across project portfolios. The energy cost breakdown by plant helps procurement and operations leaders understand which facilities are generating the highest energy spend, informing power procurement strategy, equipment upgrade prioritization, and demand management programs across the treatment network.
How to Analyze Data in a Wastewater Treatment Cost & Budget Dashboard
Here is how you can analyze data from this dashboard:
- Use the Treatment Plant filter to isolate O&M costs, energy spend, and budget variance for a specific facility and compare it against the portfolio-wide average.
- Review the Total Wastewater O&M Costs Trends area chart to identify months where operating costs spiked above the baseline and investigate labor, chemical, or maintenance factors behind the increase.
- Monitor the O&M Cost per Million Gallons Treated KPI for wastewater O&M cost efficiency tracking, comparing current period performance against the AWWA benchmark to assess cost competitiveness.
- Analyze the Regulatory Fines & Penalties by Regulatory Program line chart for regulatory fines, penalties, wastewater compliance trends, identifying whether NPDES, EPA, or CWA programs are driving current penalty exposure.
- Compare the Budget Variance by Treatment Plant map for budget variance treatment plant analysis, identifying which plant locations are consistently running over budget and require financial control reviews.
- Investigate the Energy Consumption Costs by Plant donut chart to determine which facilities, North, South, East, West, or Central Plant, are contributing the largest share of total energy spend.
- Filter by Budget Version to compare actual spending against approved budget scenarios and assess which version best reflects current operational realities.
- Track the Capital Expenditure by Quarter grouped bar chart to assess whether infrastructure investment pacing is aligned with prior-year deployment and flag quarters where capital expenditure wastewater utility planning targets are at risk.
Benefits of a Wastewater Treatment Cost & Budget Dashboard
The following are the benefits of using this dashboard:
- Centralizes O&M costs, capital expenditure, energy spend, and regulatory fines across all treatment plants in one structured financial performance template.
- Supports wastewater O&M cost efficiency tracking across facilities, budget versions, and regulatory programs from a single dashboard view.
- Reduces manual data compilation for budget review and financial reporting with pre-built KPI tiles and chart layouts covering operating costs, capital, and compliance penalties.
- Enables plant-level budget variance treatment plant analysis by mapping financial overruns geographically and filtering by facility for targeted financial control discussions.
- Provides a donut chart breakdown of energy consumption costs by plant for procurement strategy planning and demand management prioritization.
- Helps finance and compliance teams align with regulatory penalty reduction goals without rebuilding cost performance reports from scratch each reporting cycle.
- Gives utility directors and operations managers a shared view of cost efficiency, capital deployment, and regulatory financial exposure across the treatment portfolio.
KPIs to Track in a Wastewater Treatment Cost & Budget Dashboard
The following key KPIs can be tracked by using this dashboard:
- Total Wastewater O&M Costs ($M): At the core of any wastewater treatment cost budget dashboard, measures all operating and maintenance expenditures across the facility network, the primary indicator of cost trajectory and operational spending control.
- Capital Expenditure ($M): Tracks total infrastructure investment deployed across treatment plants, essential for capital expenditure wastewater utility planning and quarterly spend-versus-plan comparison against approved budgets.
- Energy Consumption Costs ($M): Quantifies the total cost of energy consumed across all treatment operations, supporting energy consumption cost wastewater treatment benchmarking and procurement optimization across plant locations.
- Regulatory Fines & Penalties ($M): Measures the total financial penalties incurred under NPDES, EPA, and CWA programs the key metric for regulatory fines penalties wastewater compliance cost management and risk reduction reporting.
- Budget Variance (%): Evaluates the percentage deviation between actual spending and budgeted amounts across the portfolio, the primary indicator for budget variance treatment plant analysis and financial accountability reviews.
- O&M Cost per Million Gallons Treated ($/MG): Tracks the normalized cost of treating each million gallons of wastewater enabling wastewater O&M cost efficiency tracking against AWWA industry benchmarks and cross-facility performance comparison.
Frequently Asked Questions
1. What teams use a Wastewater Treatment Cost & Budget Dashboard?
This dashboard is used by utility finance managers, operations directors, capital planning teams, regulatory compliance officers, and executive leadership at municipal wastewater utilities and multi-site treatment authorities.
2. How does this dashboard help reduce regulatory fines and penalties?
By tracking fines under NPDES, EPA, and CWA programs in a single trend chart with prior-year comparison, compliance teams can identify which regulatory programs are generating increasing penalty exposure and direct remediation investments to those areas before the next inspection cycle.
3. Can this dashboard compare energy costs across individual treatment plants?
Yes, the Energy Consumption Costs by Plant donut chart breaks down total energy spending across all named facilities North, South, East, West, and Central Plant enabling procurement and operations teams to identify which sites are generating the highest energy costs and prioritize efficiency upgrades accordingly.