
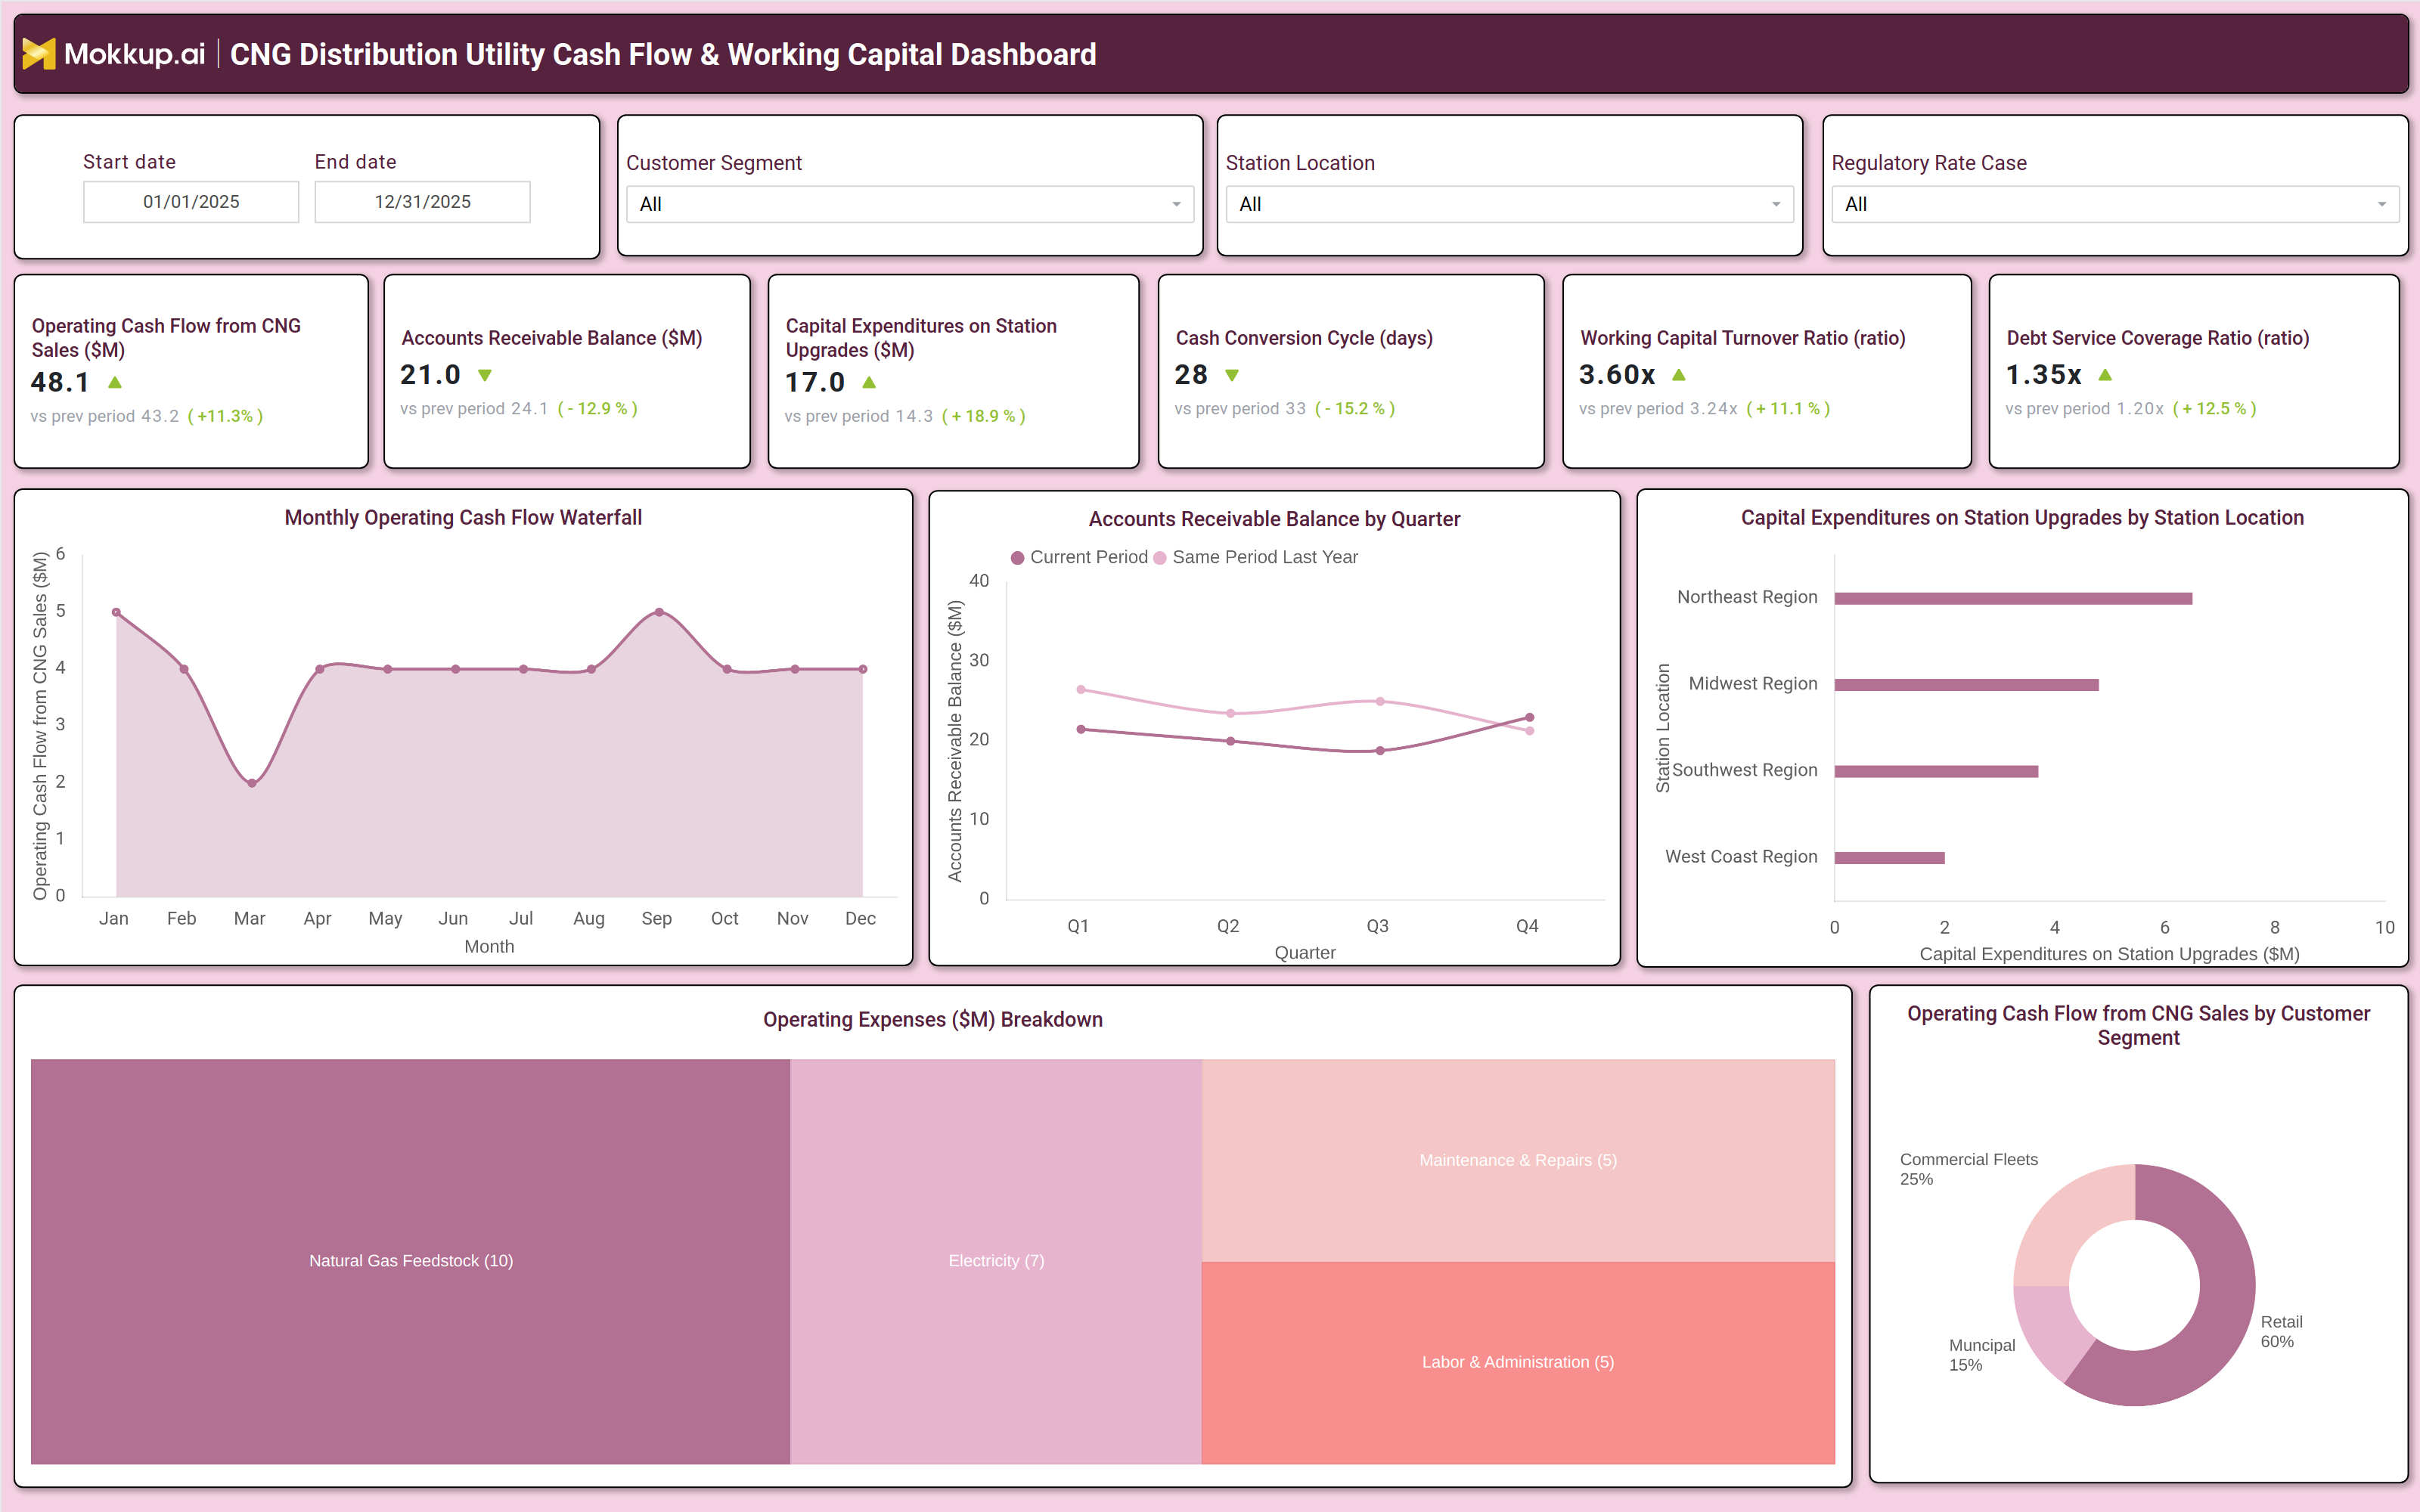
What is a CNG Distribution Utility Cash Flow & Working Capital Dashboard?
A CNG distribution utility cash flow & working capital dashboard is a financial analytics tool designed to monitor, analyze, and optimize the financial health of natural gas and CNG distribution operations. It consolidates key financial metrics, including cash inflows, outflows, working capital levels, and liquidity ratios, into a single interface. This dashboard helps utility managers, financial analysts, and executives track revenue cycles, manage operational expenses, and ensure sufficient working capital for fuel procurement, infrastructure maintenance, and fleet operations.
By integrating data from accounting systems, fuel procurement records, and distribution logs, this dashboard provides insights into financial performance. It enables utilities to identify cash flow bottlenecks, optimize working capital allocation, and make data-driven decisions to improve profitability and operational efficiency.
How to Create a CNG Distribution Utility Cash Flow & Working Capital Dashboard
You don’t need to build your report from scratch, just start with a ready-to-use CNG Distribution Utility Cash Flow & Working Capital dashboard template from Mokkup. Add in your data and export it however you like. Here’s how to do it:
1. Create or Log in to Your Mokkup Account
Start by signing up on Mokkup.ai using your email. If you already have an account, just log in, and you’ll be good to go.
2. Choose and Customize Your Dashboard Template
Find the CNG Distribution Utility Cash Flow & Working Capital Dashboard template in the Templates section. Use the drag and drop editor to adjust KPIs, edit filters, or add elements based on your data.
3. Export to Your BI Tool
Once your dashboard wireframe is ready, use the BI Tool Export feature to send it directly to Power BI or Tableau for further analysis and enhancements. You can also download the dashboard as a PDF, PNG, or JPEG, embed it on a platform, or invite your team to collaborate.
Note: This is a Pro template. You’ll need a Pro subscription on Mokkup to use and customize this dashboard wireframe. Upgrade anytime to unlock full access.
CNG Distribution Utility Cash Flow & Working Capital Dashboard Example
A well-structured CNG distribution financial performance dashboard includes interactive filters for date ranges, regions, pipeline materials, and financial metrics. Key performance tiles display critical data such as cash flow from operations, working capital turnover ratio, days sales outstanding (DSO), and fuel procurement costs. Trend charts compare current financial performance against previous periods, highlighting improvements or declines in cash flow stability. Department-level breakdowns show working capital distribution across fueling stations, pipeline maintenance, and fleet operations.
A geographic heatmap visualizes cash flow efficiency by region, while expense breakdowns by category (e.g., fuel costs, labor, maintenance) help identify cost-saving opportunities. Together, these components create a day's sales outstanding tracker for CNG that provides a comprehensive view of financial health, enabling better liquidity management and strategic planning.
How to Analyze Data in a CNG Distribution Utility Cash Flow & Working Capital Dashboard
Here is how you can analyze data from this natural gas utility working capital dashboard:
- Liquidity Assessment: Monitor cash flow from operations to evaluate financial stability and sustainability.
- Working Capital Efficiency: Track working capital turnover ratio to assess how effectively short-term assets are utilized.
- Receivables Analysis: Analyze days sales outstanding (DSO) to measure collection efficiency and revenue cycles.
- Cost Optimization Review: Review fuel procurement costs to identify cost-saving opportunities in the supply chain.
- Regional Performance Comparison: Compare regional cash flow performance to detect inefficiencies across distribution networks.
- Department-Level Allocation: Assess working capital by department to optimize resource allocation.
- Expense Trend Monitoring: Evaluate expense trends to control operational costs and improve margins.
- Benchmarking Analysis: Benchmark performance against industry standards to ensure competitiveness.
Benefits of a CNG Distribution Utility Cash Flow & Working Capital Dashboard
The following are the benefits of using this dashboard:
- Centralized Financial Visibility: Consolidates cash flow and working capital data into a single view.
- Improved Liquidity Management: Enables better tracking of cash inflows and outflows.
- Optimized Capital Allocation: Enhances use of working capital across operations.
- Cost Control: Identifies high-cost areas in procurement and distribution.
- Data-Driven Financial Planning: Supports informed investment and budgeting decisions.
- Risk Reduction: Detects cash flow bottlenecks early.
- Accurate Reporting: Improves financial reporting with automated data integration.
- Profitability Improvement: Aligns financial strategy with operational needs.
KPIs to Track in a CNG Distribution Utility Cash Flow & Working Capital Dashboard
The following key KPIs can be tracked by using this fuel procurement cost monitoring dashboard:
- Cash Flow from Operations ($): Measures net cash generated from core distribution activities.
- Working Capital Turnover Ratio (x): Indicates how efficiently working capital is used to generate revenue.
- Days Sales Outstanding (DSO) (Days): Tracks the average time taken to collect payments from customers.
- Fuel Procurement Cost per Unit ($/MMBtu): Monitors fuel acquisition expenses to optimize supply chain costs.
- Operating Expense Ratio (%): Compares operational costs to revenue to assess financial efficiency.
- Current Ratio (x): Evaluates short-term liquidity by comparing current assets to current liabilities.
- Cash Conversion Cycle (Days): Measures the time taken to convert inventory and receivables into cash.
Frequently Asked Questions
Q1. What is a CNG distribution utility cash flow dashboard used for?
It helps utilities monitor cash flow, manage working capital, and optimize financial performance for fuel distribution and fleet operations.
Q2. What data sources feed into this CNG financial performance dashboard?
Accounting systems, fuel procurement records, distribution logs, and financial management software.
Q3. How does this utility cash flow analytics dashboard improve financial decision-making?
By providing insights into cash flow, working capital, and expense trends, enabling better financial planning.