
What Is a Wastewater Treatment Contingency Dashboard?
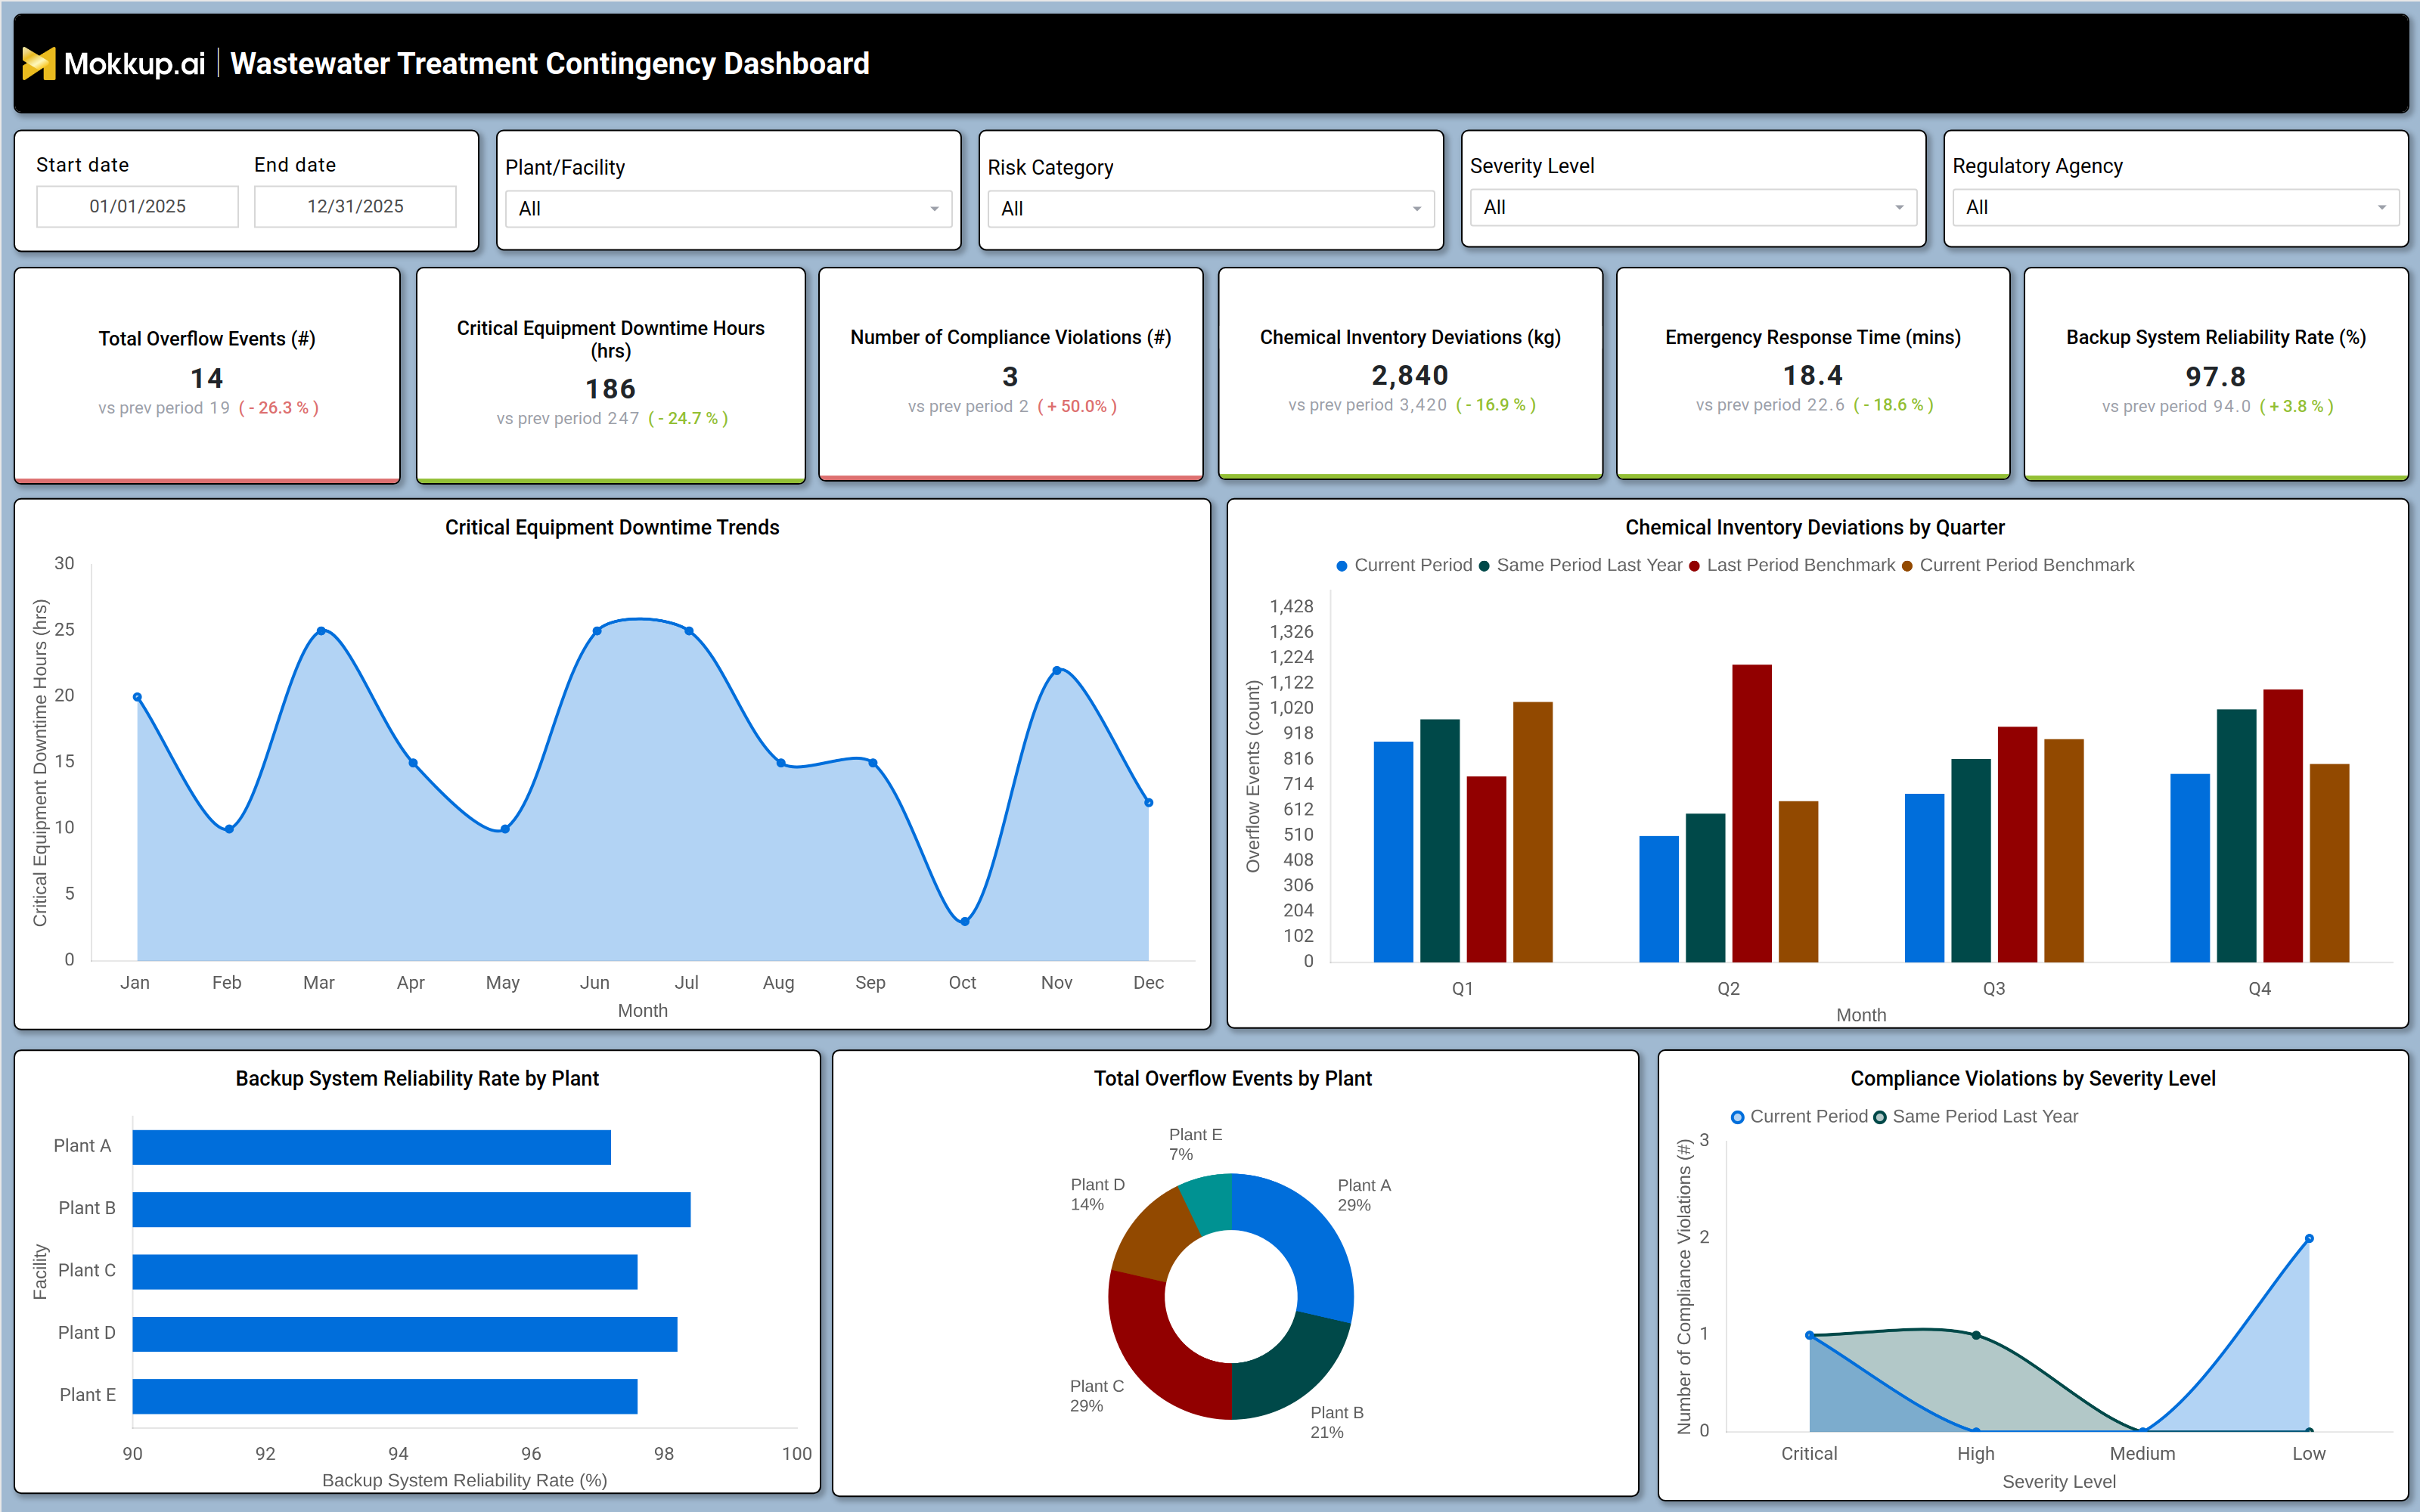
A wastewater treatment contingency dashboard is a data-driven analytics tool designed to help water utilities monitor risks, track operational disruptions, and plan emergency responses. It consolidates key performance indicators (KPIs) such as overflow events, equipment downtime, compliance violations, and chemical inventory deviations into a single interface. By providing wastewater system failure risk management tools, this dashboard enables utility managers to detect vulnerabilities early, optimize backup systems, and maintain regulatory compliance. It serves as a backup system reliability dashboard for wastewater treatment plant preparedness, ensuring that utilities can respond swiftly to crises like equipment failures, chemical shortages, or environmental incidents.
How to Create a Wastewater Treatment Contingency Dashboard
You don't need to build your report from scratch, just start with a ready-to-use dashboard template from Mokkup. Add in your data and export it however you like. Here's how to do it:
1. Create or Log in to Your Mokkup Account
Start by signing up on Mokkup.ai using your email. If you already have an account, just log in, and you'll be good to go.
2. Choose and Customize Your Dashboard Template
Find the Wastewater Treatment Contingency Dashboard template in the Templates section. Use the drag-and-drop editor to adjust KPIs, edit filters, or add elements based on your data.
3. Export to Your BI Tool
Once your dashboard wireframe is ready, use the BI Tool Export feature to send it directly to Power BI or Tableau for further analysis and enhancements. You can also download the dashboard as a PDF, PNG, or JPEG, embed it on a platform, or invite your team to collaborate.
Note: This is a Pro template. You'll need a Pro subscription on Mokkup to use and customize this dashboard wireframe. Upgrade anytime to unlock full access.
Wastewater Treatment Contingency Dashboard Example
A typical wastewater treatment contingency dashboard includes interactive filters for date ranges, treatment plants, risk categories, severity levels, and regulatory agencies. Key metrics displayed in performance tiles include total overflow events, critical equipment downtime hours, compliance violations, chemical inventory deviations, emergency response time, and backup system reliability rates. Trend charts compare current performance against historical benchmarks, highlighting improvements or deteriorations in system resilience. A chemical inventory deviation by quarter chart helps utilities track supply chain stability, while a backup system reliability rate by plant visualization identifies weak points in infrastructure. The dashboard also provides compliance violations by severity level breakdown, allowing managers to prioritize high-risk issues. Together, these components form a chemical inventory deviation dashboard that ensures operational continuity and regulatory adherence.
How to Analyze Data in a Wastewater Treatment Contingency Dashboard
Here is how you can analyze data from this dashboard:
- Monitor Total Overflow Events: Track the number of overflow incidents to assess system capacity limitations, identify recurring failure points, and improve infrastructure reliability.
- Track Critical Equipment Downtime: Monitor downtime of essential equipment to detect maintenance gaps, reduce operational disruptions, and support proactive asset management.
- Review Compliance Violations by Severity: Analyze regulatory violations based on severity levels to prioritize corrective actions, minimize risks, and avoid financial or legal penalties.
- Analyze Chemical Inventory Deviations: Monitor fluctuations in chemical inventory levels to prevent treatment process interruptions caused by shortages or supply chain issues.
- Measure Emergency Response Time: Evaluate the speed and effectiveness of incident response activities to improve operational readiness and strengthen crisis management capabilities.
- Compare Backup System Reliability Rates: Assess the reliability of backup systems across multiple plants to enhance infrastructure resilience and ensure continuity during failures.
- Benchmark Performance Against Historical Data: Compare current operational performance with historical trends to identify signs of system improvement, degradation, or recurring issues.
- Use Risk Category Filters: Categorize and prioritize high-impact risks such as equipment failures, chemical shortages, or regulatory noncompliance for more focused risk mitigation efforts.
Benefits of a Wastewater Treatment Contingency Dashboard
The following are the benefits of using this dashboard:
- Enhances Risk Visibility: Consolidates critical operational and compliance KPIs into a centralized wastewater treatment emergency response dashboard for improved monitoring and risk assessment.
- Improves Emergency Preparedness: Supports contingency planning and rapid response strategies to effectively manage water utility disruptions and emergency situations.
- Reduces Compliance Risks: Tracks regulatory violations and compliance metrics to ensure adherence to environmental and wastewater treatment standards.
- Optimizes Chemical Inventory Management: Monitors chemical stock levels and usage patterns to prevent shortages that could disrupt treatment processes.
- Strengthens Infrastructure Resilience: Evaluates backup system reliability and infrastructure performance to ensure operational continuity during critical failures.
- Supports Data-Driven Decision-Making: Provides actionable insights that help utility managers improve wastewater contingency planning and long-term operational sustainability.
- Minimizes Downtime: Identifies potential equipment failure risks early to support preventive maintenance and reduce unplanned operational interruptions.
- Enables Proactive Crisis Response: Delivers real-time infrastructure resilience insights that help teams respond quickly and effectively to operational emergencies and system disruptions.
KPIs to Track in a Wastewater Treatment Contingency Dashboard
The following key KPIs can be tracked by using this dashboard:
- Total Overflow Events (#): Measures the number of untreated wastewater discharges, indicating system capacity issues.
- Critical Equipment Downtime (Hrs): Tracks the duration of essential equipment failures, impacting treatment efficiency.
- Number of Compliance Violations (#): Counts regulatory breaches, helping utilities avoid fines and legal risks.
- Chemical Inventory Deviations (kg): Monitors discrepancies in chemical stock levels, preventing treatment process failures.
- Emergency Response Time (mins): Measures how quickly teams address disruptions, reflecting operational readiness.
- Backup System Reliability Rate (%): Evaluates the effectiveness of redundant systems in maintaining operations during failures.
Frequently Asked Questions
1. How does a wastewater infrastructure resilience dashboard improve utility resilience?
It provides risk monitoring, enabling utilities to detect failures early, optimize backup systems, and maintain compliance.
2. Who should use a wastewater infrastructure resilience tracking dashboard?
Utility managers, environmental compliance teams, operations directors, and emergency response coordinators.
3. Can this wastewater treatment emergency response dashboard help with regulatory reporting?
Yes, it tracks compliance violations and ensures utilities meet environmental standards.