What is a Hydroelectric Power Plant Inventory & Vendor Efficiency Dashboard?
A Hydroelectric Power Plant Inventory & Vendor Efficiency Dashboard is a centralized digital platform used to monitor spare parts availability, inventory health, and supplier performance across hydroelectric facilities. It combines inventory tracking data with procurement and vendor efficiency metrics to ensure uninterrupted plant operations. By integrating stock levels, reorder thresholds, lead times, supplier delivery performance, and quality scores, the dashboard supports effective hydro plant spare inventory planning and risk mitigation. This hydroelectric plant inventory dashboard enables maintenance, procurement, and operations teams to maintain asset readiness while reducing stockouts, excess inventory, and supplier dependency risks.
How to Create a Hydroelectric Power Plant Inventory & Vendor Efficiency Dashboard
You don’t need to build your report from scratch, just start with a ready-to-use dashboard template from Mokkup. Add in your data and export it however you like. Here’s how to do it:
1. Create or Log in to Your Mokkup Account
Start by signing up on Mokkup.ai using your email. If you already have an account, just log in, and you’ll be good to go.
2. Choose and Customize Your Dashboard Template
Find the Hydroelectric Power Plant Inventory & Vendor Efficiency Dashboard template in the Templates section. Use the drag-and-drop editor to adjust KPIs, edit filters, or add elements based on your data.
3. Export to Your BI Tool
Once your dashboard wireframe is ready, use the BI Tool Export feature to send it directly to Power BI or Tableau for further analysis and enhancements. You can also download the dashboard as a PDF, PNG, or JPEG, embed it on a platform, or invite your team to collaborate.
Note: This is a Pro template. You’ll need a Pro subscription on Mokkup to use and customize this dashboard wireframe. Upgrade anytime to unlock full access.
Hydroelectric Power Plant Inventory & Vendor Efficiency Dashboard Example
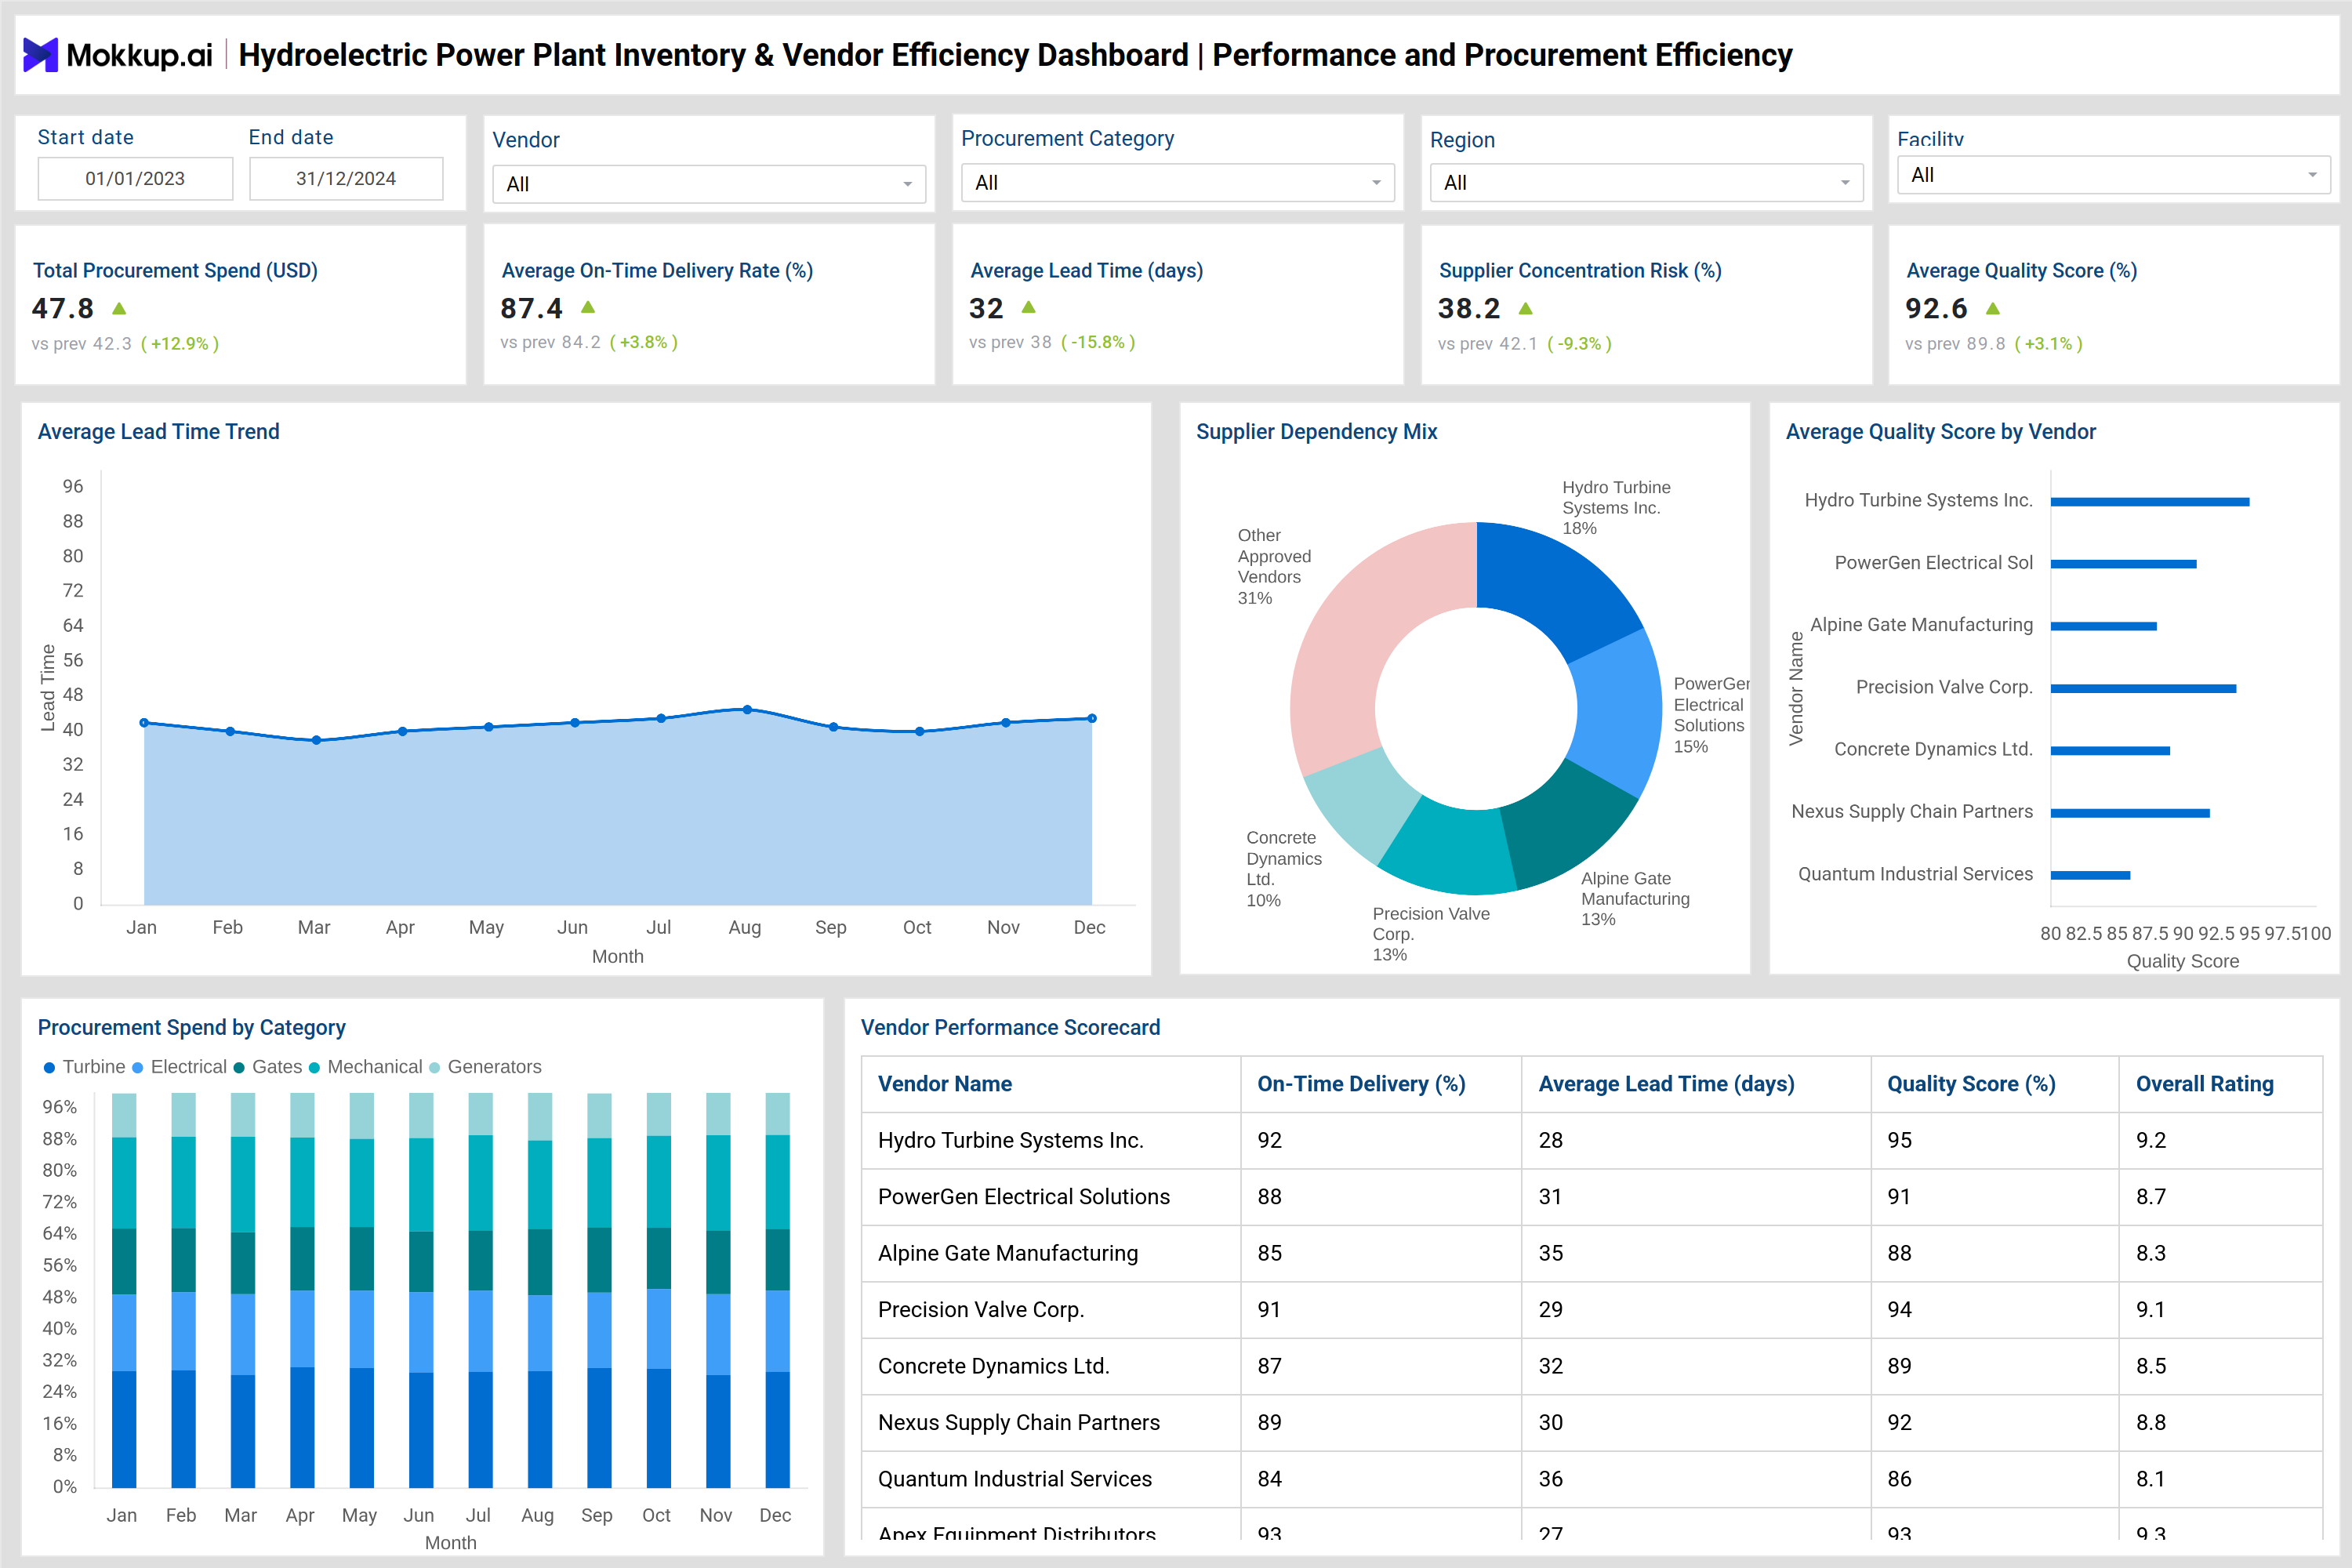
You can build a Hydroelectric Power Plant Inventory & Vendor Efficiency Dashboard using the modules shown in the reference images to manage both inventory health and vendor performance in a single view. The dashboard typically opens with high-level KPIs such as total inventory SKUs, critical spares availability, items below reorder levels, stockout incidents year-to-date, total inventory value, and maintenance spare readiness. These indicators provide an immediate snapshot of hydro power plant inventory status and operational readiness.The inventory health section visualizes inventory turnover trends, stock status distribution, and inventory counts by spare category, including turbine spares, generator spares, hydraulic systems, gates and hoists, electrical components, and control systems.
Detailed SKU-level tables display current stock, reorder points, unit cost, days in stock, and asset status, enabling precise hydroelectric spare parts dashboard analysis.The vendor efficiency section extends visibility into procurement performance by tracking average lead times, on-time delivery rates, supplier concentration risk, and quality scores. Visuals such as lead time trends, supplier dependency mix, procurement spend by category, and vendor scorecards help teams assess hydro plant vendor performance and identify sourcing risks. Together, these views create a complete hydropower inventory management system that connects inventory readiness with supplier reliability.
How to Analyze Hydroelectric Power Plant Inventory & Vendor Efficiency Dashboard
Here is how you can analyze data from this dashboard:
- Review critical spares availability to ensure essential components meet maintenance and operational demand.
- Monitor items below reorder levels to prevent stockouts that could delay repairs or outages.
- Analyze inventory turnover trends to identify slow-moving or excess stock.
- Track stock status distribution to assess the balance between in-stock, critical, and obsolete inventory.
- Compare inventory by spare category to prioritize high-risk plant assets such as turbines and generators.
- Evaluate average procurement lead time trends to detect supplier delays or logistics issues.
- Assess on-time delivery rates to measure supplier reliability and contract performance.
- Review supplier concentration risk to reduce dependency on single vendors.
- Use vendor quality scores to align procurement decisions with long-term asset reliability.
- Cross-check maintenance spare readiness to confirm support for planned outages and inspections.
Benefits of Hydroelectric Power Plant Inventory & Vendor Efficiency Dashboard
The following are the benefits of using this dashboard:
- Improves visibility into hydro plant spare inventory across all asset categories.
- Reduces unplanned downtime by ensuring critical spares are available when needed.
- Strengthens procurement planning through accurate lead time and delivery performance tracking.
- Minimizes inventory carrying costs by identifying excess or obsolete stock.
- Enhances vendor accountability using standardized performance scorecards.
- Lowers supply chain risk by monitoring supplier dependency and concentration.
- Supports data-driven maintenance planning and outage readiness.
- Improves coordination between operations, maintenance, and procurement teams.
- Enables faster decision-making during equipment failures or emergency repairs.
- Creates a scalable hydropower supply chain dashboard for multi-site operations.
KPIs to Track in Hydroelectric Power Plant Inventory & Vendor Efficiency Dashboard
The following key KPIs can be tracked by using this dashboard:
- Total Inventory SKUs – Measures the total number of spare parts managed across the plant.
- Critical Spares Availability (%) – Tracks the availability of spares required for critical assets.
- Items Below Reorder Level (count) – Identifies spares that need immediate replenishment.
- Stockout Incidents YTD (count) – Monitors inventory failures that impact maintenance or operations.
- Total Inventory Value ($) – Shows the financial value of inventory held at the facility.
- Maintenance Spare Readiness (%) – Indicates preparedness for scheduled maintenance activities.
- Inventory Turnover Rate – Measures how efficiently spare parts are consumed and replenished.
- Average Procurement Lead Time (days) – Tracks the time taken to receive ordered spares.
- On-Time Supplier Delivery Rate (%) – Evaluates supplier reliability and delivery performance.
- Supplier Concentration Risk (%) – Assesses dependency on key vendors for critical components.
- Average Supplier Quality Score (%) – Measures supplier quality consistency across deliveries.
- Procurement Spend by Category – Analyzes spend distribution across hydro plant asset group
Frequently Asked Questions
1. Why is an inventory and vendor efficiency dashboard important for hydroelectric plants?
It ensures spare availability, reduces downtime risk, and improves procurement efficiency through real-time visibility.
2. What type of inventory does this dashboard track?
It tracks turbine, generator, hydraulic, electrical, control system, and mechanical spares.
3. How does the dashboard improve vendor management?
It evaluates suppliers using lead time, delivery performance, quality scores, and dependency risk metrics.
4. Can this dashboard support multiple hydroelectric facilities?
Yes, filters allow analysis by location, region, vendor, and spare category across plants.
5. Does it help with planned maintenance and outages?
Yes, maintenance spare readiness metrics ensure parts availability before scheduled activities.