What is a Wind Power Plant Procurement & Inventory Management Dashboard?
A Wind Power Plant Procurement & Inventory Management Dashboard is a centralized analytics tool that tracks procurement cycle performance, supplier reliability, spare parts availability, and inventory turnover across onshore and offshore wind operations. It supports end-to-end visibility of purchasing activities, warehouse stock levels, and component-level performance. The dashboard helps operations, maintenance, and supply chain teams streamline planning, reduce critical spare shortages, improve supplier on-time delivery, and control material costs. By integrating data from ERP systems, procurement platforms, and turbine maintenance logs, it provides a view of supply chain health and operational risks for wind power generation sites.
How to Create a Wind Power Plant Procurement & Inventory Management Dashboard
You don’t need to build your report from scratch, just start with a ready to use dashboard template from Mokkup. Add in your data and export it however you like. Here’s how to do it:
1. Create or Log in to Your Mokkup Account
Start by signing up on Mokkup.ai using your email. If you already have an account, just log in, and you’ll be good to go.
2. Choose and Customize Your Dashboard Template
Find the Wind Power Plant Procurement & Inventory Management Dashboard template in the Templates section. Use the drag and drop editor to adjust KPIs, edit filters, or add elements based on your data.
3. Export to Your BI Tool
Once your dashboard wireframe is ready, use the BI Tool Export feature to send it directly to Power BI or Tableau for further analysis and enhancements. You can also download the dashboard as a PDF, PNG, or JPEG, embed it on a platform, or invite your team to collaborate.
Note: This is a Pro template. You’ll need a Pro subscription on Mokkup to use and customize this dashboard wireframe. Upgrade anytime to unlock full access.
Wind Power Plant Procurement & Inventory Management Dashboard Example
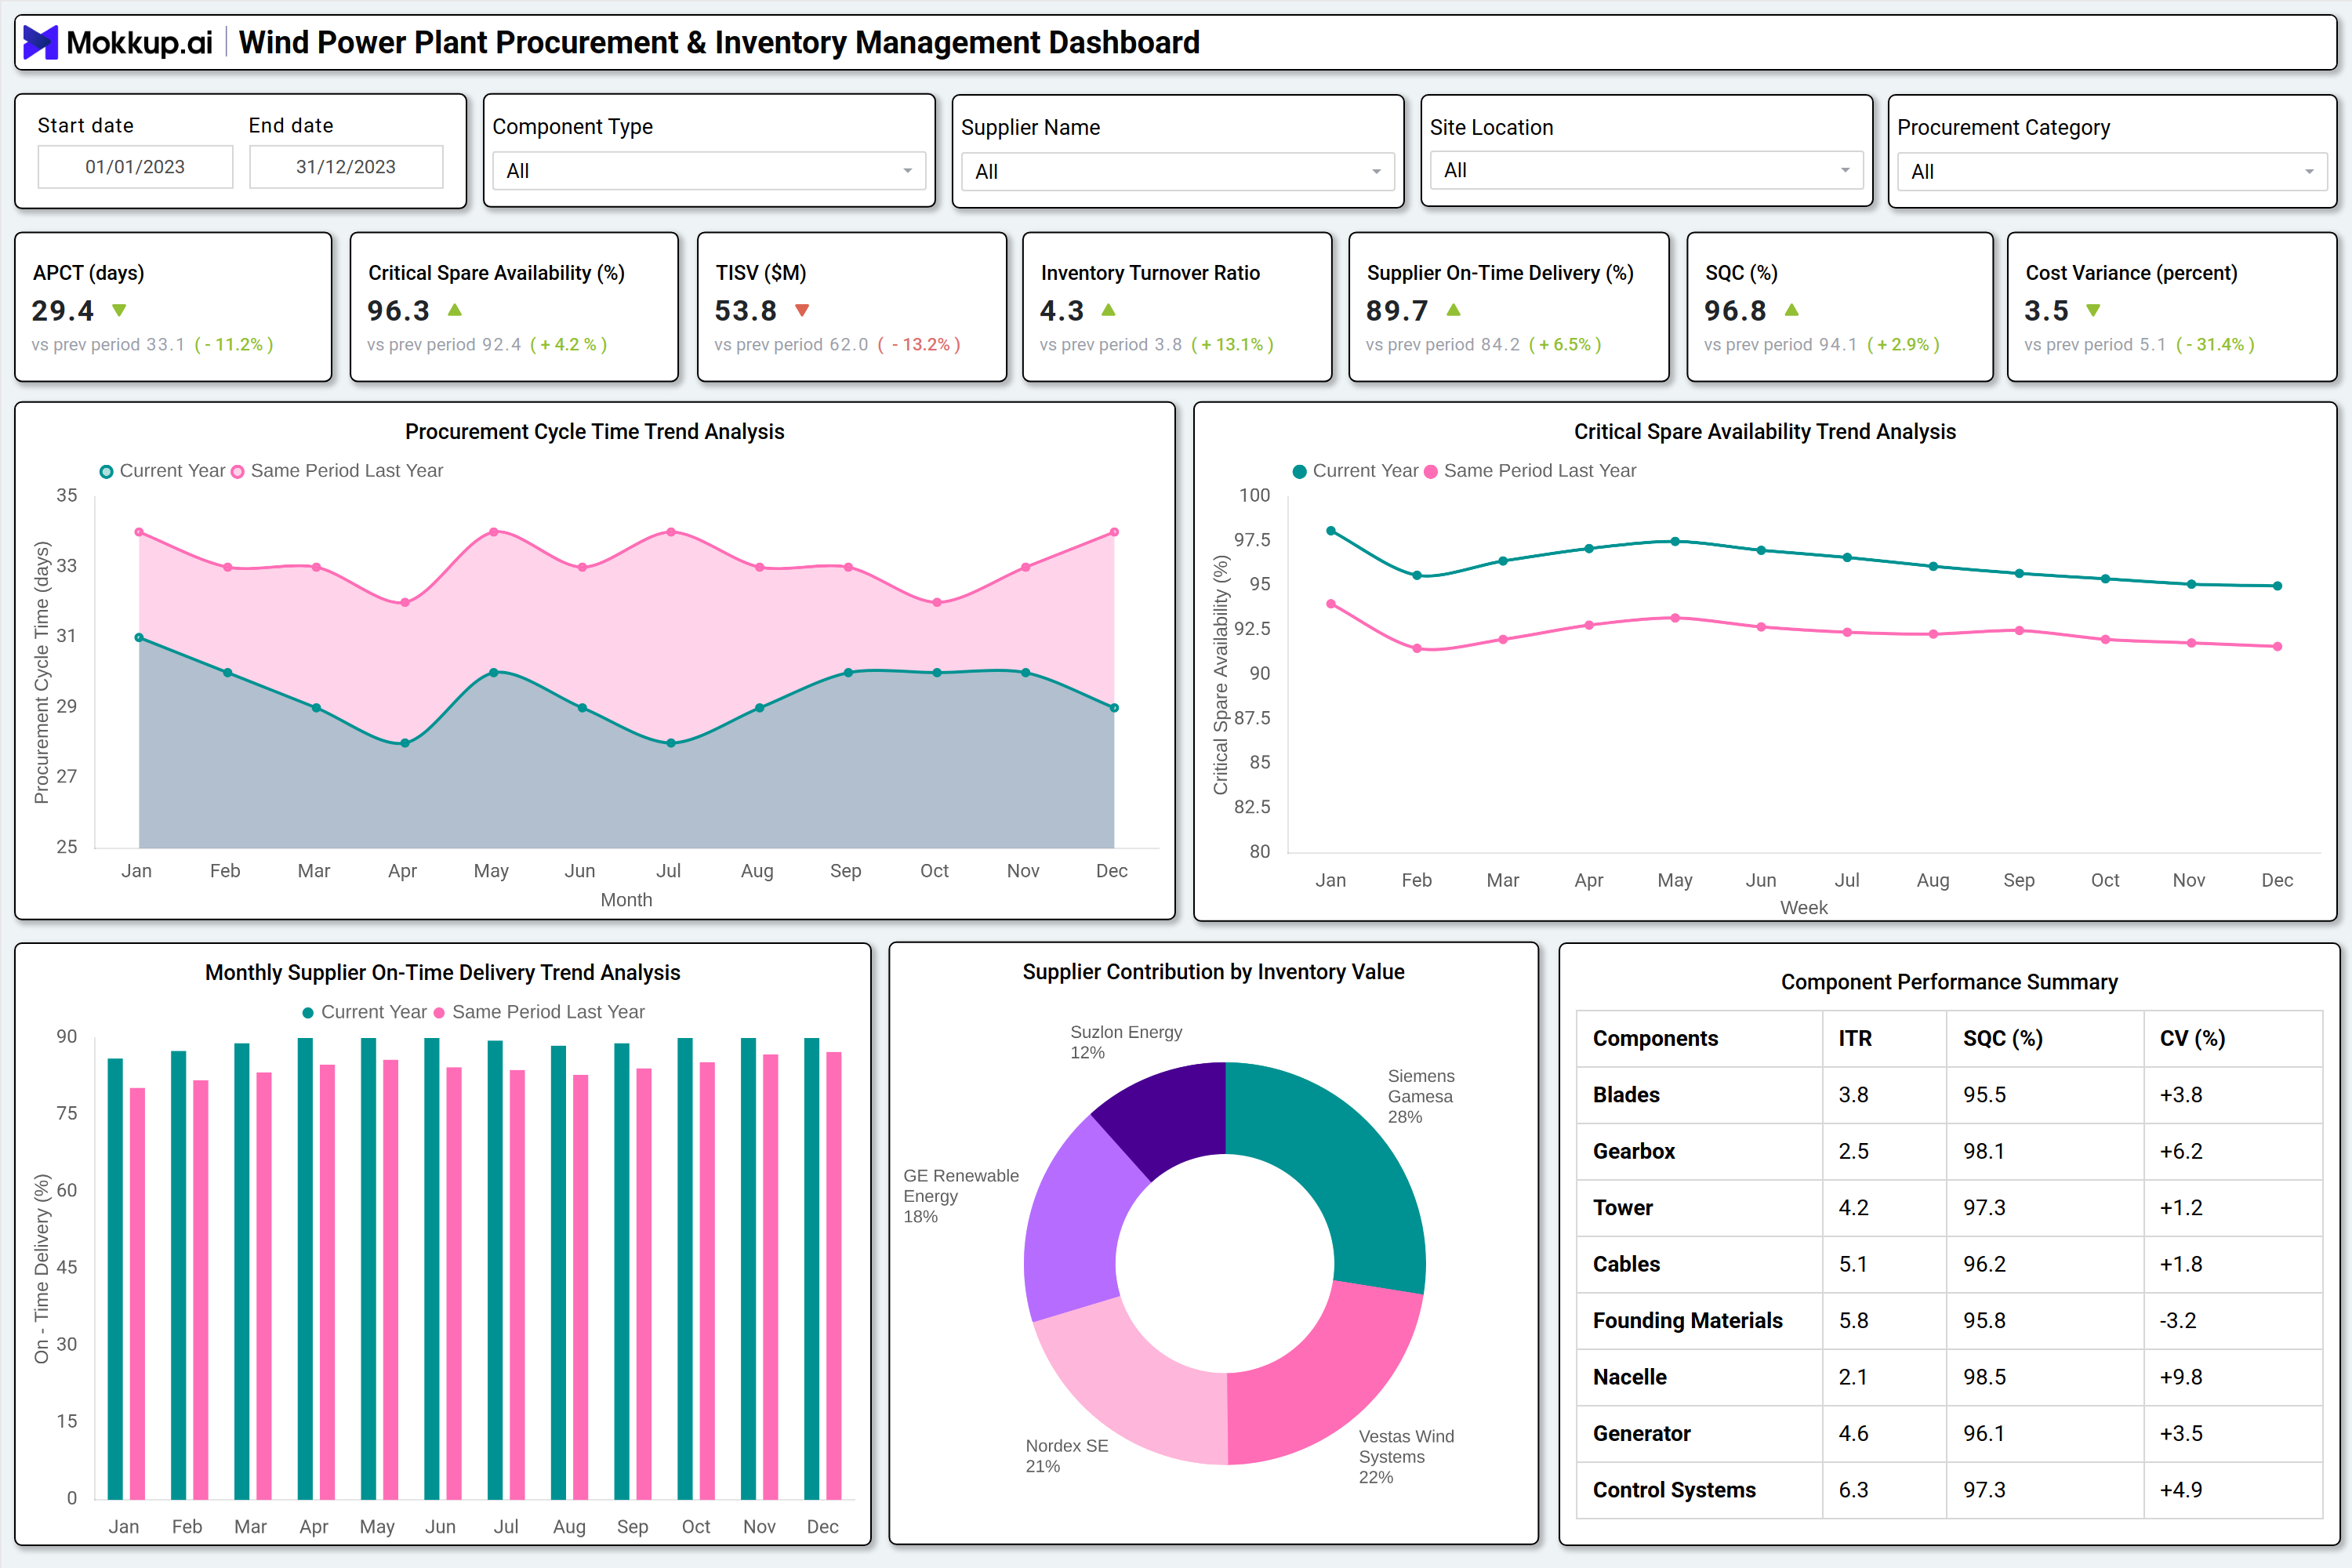
The sample dashboard displayed above shows an end-to-end procurement tracking dashboard for wind energy operations. It presents a clear view of cycle times, spare availability, purchase spend, supplier performance, and inventory movements. Trend charts help compare current performance against the same period last year, making it easier to detect delays or improvements. A donut chart visualizes the supplier's contribution to total inventory value, helping to identify dependency on key suppliers. Component-level metrics such as Inventory Turnover Ratio (ITR), Supplier Quality Compliance (SQC), and Cost Variance provide operational insights into turbine blades, gearboxes, nacelles, cables, and other critical components. This supports data-driven decision-making and efficient materials planning across wind power generation sites.
How to Analyze Data in a Wind Power Plant Procurement & Inventory Management Dashboard
Here is how you can analyze data from this dashboard:
- Average Procurement Cycle Time (APCT): Evaluate how quickly procurement requests move from initiation to fulfillment. Longer cycles often signal upstream delays, approval bottlenecks, or supplier inefficiencies.
- Critical Spare Availability: Monitor the availability of essential turbine spares to prevent downtime caused by unexpected part shortages proactively.
- Total Inventory Stock Value (TISV): Understand overall capital locked in inventory and identify overstocking risks or excessive value concentration in specific warehouses.
- Inventory Turnover Ratio (ITR): Measures how efficiently inventory is consumed over time to identify slow-moving or obsolete components.
- Supplier On-Time Delivery (OTD): Track delivery performance trends to assess supplier reliability and adherence to contractual timelines.
- Supplier Quality Compliance (SQC): Compare quality compliance across suppliers to uncover discrepancies that could impact turbine performance and long-term reliability.
- Cost Variance (CV%): Analyze deviations between planned and actual procurement costs to identify budget overruns, pricing issues, or negotiation gaps.
- Component-Level KPIs: Review KPIs for turbine-specific materials, such as blades, generators, and control systems, to detect operational and maintenance risks early.
- Year-over-Year (YoY) Trends: Use YoY comparisons to identify recurring seasonal procurement bottlenecks or sustained performance improvements.
- Supplier Contribution to Inventory Value: Assess the contribution of each supplier to the total inventory value to reduce over-dependence on specific manufacturers.
Benefits of a Wind Power Plant Procurement & Inventory Management Dashboard
The following are the benefits of using this dashboard:
- End-to-End Procurement Visibility: Provides a centralized view of procurement activities across multiple wind power sites.
- Reduced Critical Spare Shortages: Enables proactive tracking of spare availability, minimizing unplanned turbine downtime.
- Improved Supplier Performance Management: Strengthens supplier accountability through continuous monitoring of delivery and quality metrics.
- Better Cost Control: Helps identify procurement inefficiencies and cost variances before they impact budgets.
- Optimized Inventory Planning: Supports smarter planning for turbines and balance-of-plant components.
- Elimination of Manual Tracking: Consolidates procurement and inventory data into a single digital dashboard, reducing errors and effort.
- Stronger Operational Continuity: Ensures the right materials are available at the right time to maintain uninterrupted operations.
- Data-Driven Decision Making: Enhances strategic decisions using trend analysis, supplier insights, and inventory optimization metrics.
KPIs to Track in a Wind Power Plant Procurement & Inventory Management Dashboard
The following key KPIs can be tracked by using this dashboard:
- Average Procurement Cycle Time (APCT) : Measures how long it takes to complete a procurement cycle.
- Critical Spare Availability (%): Indicates availability of high-priority components required for turbine uptime.
- Total Inventory Stock Value (TISV): Represents total warehouse stock cost across materials and spare parts.
- Inventory Turnover Ratio (ITR): Tracks how often inventory is used and replenished.
- Supplier On Time Delivery (%): Evaluates the reliability of suppliers in meeting delivery timelines.
- Supplier Quality Compliance (SQC%): Measures the percentage of materials received without defects.
- Cost Variance (CV%): Indicates the deviation between the planned and actual procurement costs.
Frequently Asked Questions
1. Who uses a Wind Power Plant Procurement & Inventory Management Dashboard?
Supply chain teams, O&M managers, procurement specialists, plant managers, and reliability engineers use this dashboard for operational decision-making.
2. How does this dashboard help reduce turbine downtime?
By monitoring critical spare availability, delivery performance, and procurement delays, it prevents interruptions caused by missing components.
3. Can this dashboard be used for both onshore and offshore wind plants?
Yes. It supports procurement and inventory operations for both onshore and offshore wind power generation sites.