
What is a Wastewater Collection Workforce Productivity and Performance Dashboard?
A Wastewater Collection Workforce Productivity and Performance Dashboard is a centralized analytics tool designed to give utility managers, supervisors, and operations directors a unified view of how field crews are performing across service zones, shifts, and skill categories. By consolidating data on crew activity, time allocation, and task completion into a single interface, it eliminates the guesswork that often plagues labor-intensive field operations. Organizations focused on wastewater collection workforce productivity dashboard solutions are increasingly turning to visual analytics to replace fragmented spreadsheets and static reports. The dashboard spans every dimension of workforce management that matters in a wastewater collection environment. It surfaces how efficiently employees are deployed through metrics like workforce utilization percentage, productive hours, and average jobs per crew figures that directly reflect operational throughput.
How to Create a Wastewater Collection Workforce Productivity and Performance Dashboard
You don’t need to build your report from scratch; just start with a ready-to-use dashboard template from Mokkup. Add in your data and export it however you like. Here’s how to do it:
1. Create or Log in to Your Mokkup Account
Start by signing up on Mokkup.ai using your email. If you already have an account, just log in, and you'll be good to go.
2. Choose and Customize Your Dashboard Template
Find the Wastewater Collection Workforce Productivity and Performance Dashboard template in the Templates section. Use the drag-and-drop editor to adjust KPIs, edit filters, or add elements based on your data.
3. Export to Your BI Tool
Once your dashboard wireframe is ready, use the BI Tool Export feature to send it directly to Power BI or Tableau for further analysis and enhancements. You can also download the dashboard as a PDF, PNG, or JPEG, embed it on a platform, or invite your team to collaborate.
Note: This is a Pro template. You'll need a Pro subscription on Mokkup to use and customize this dashboard wireframe. Upgrade anytime to unlock full access.
Wastewater Collection Workforce Productivity and Performance Dashboard Example
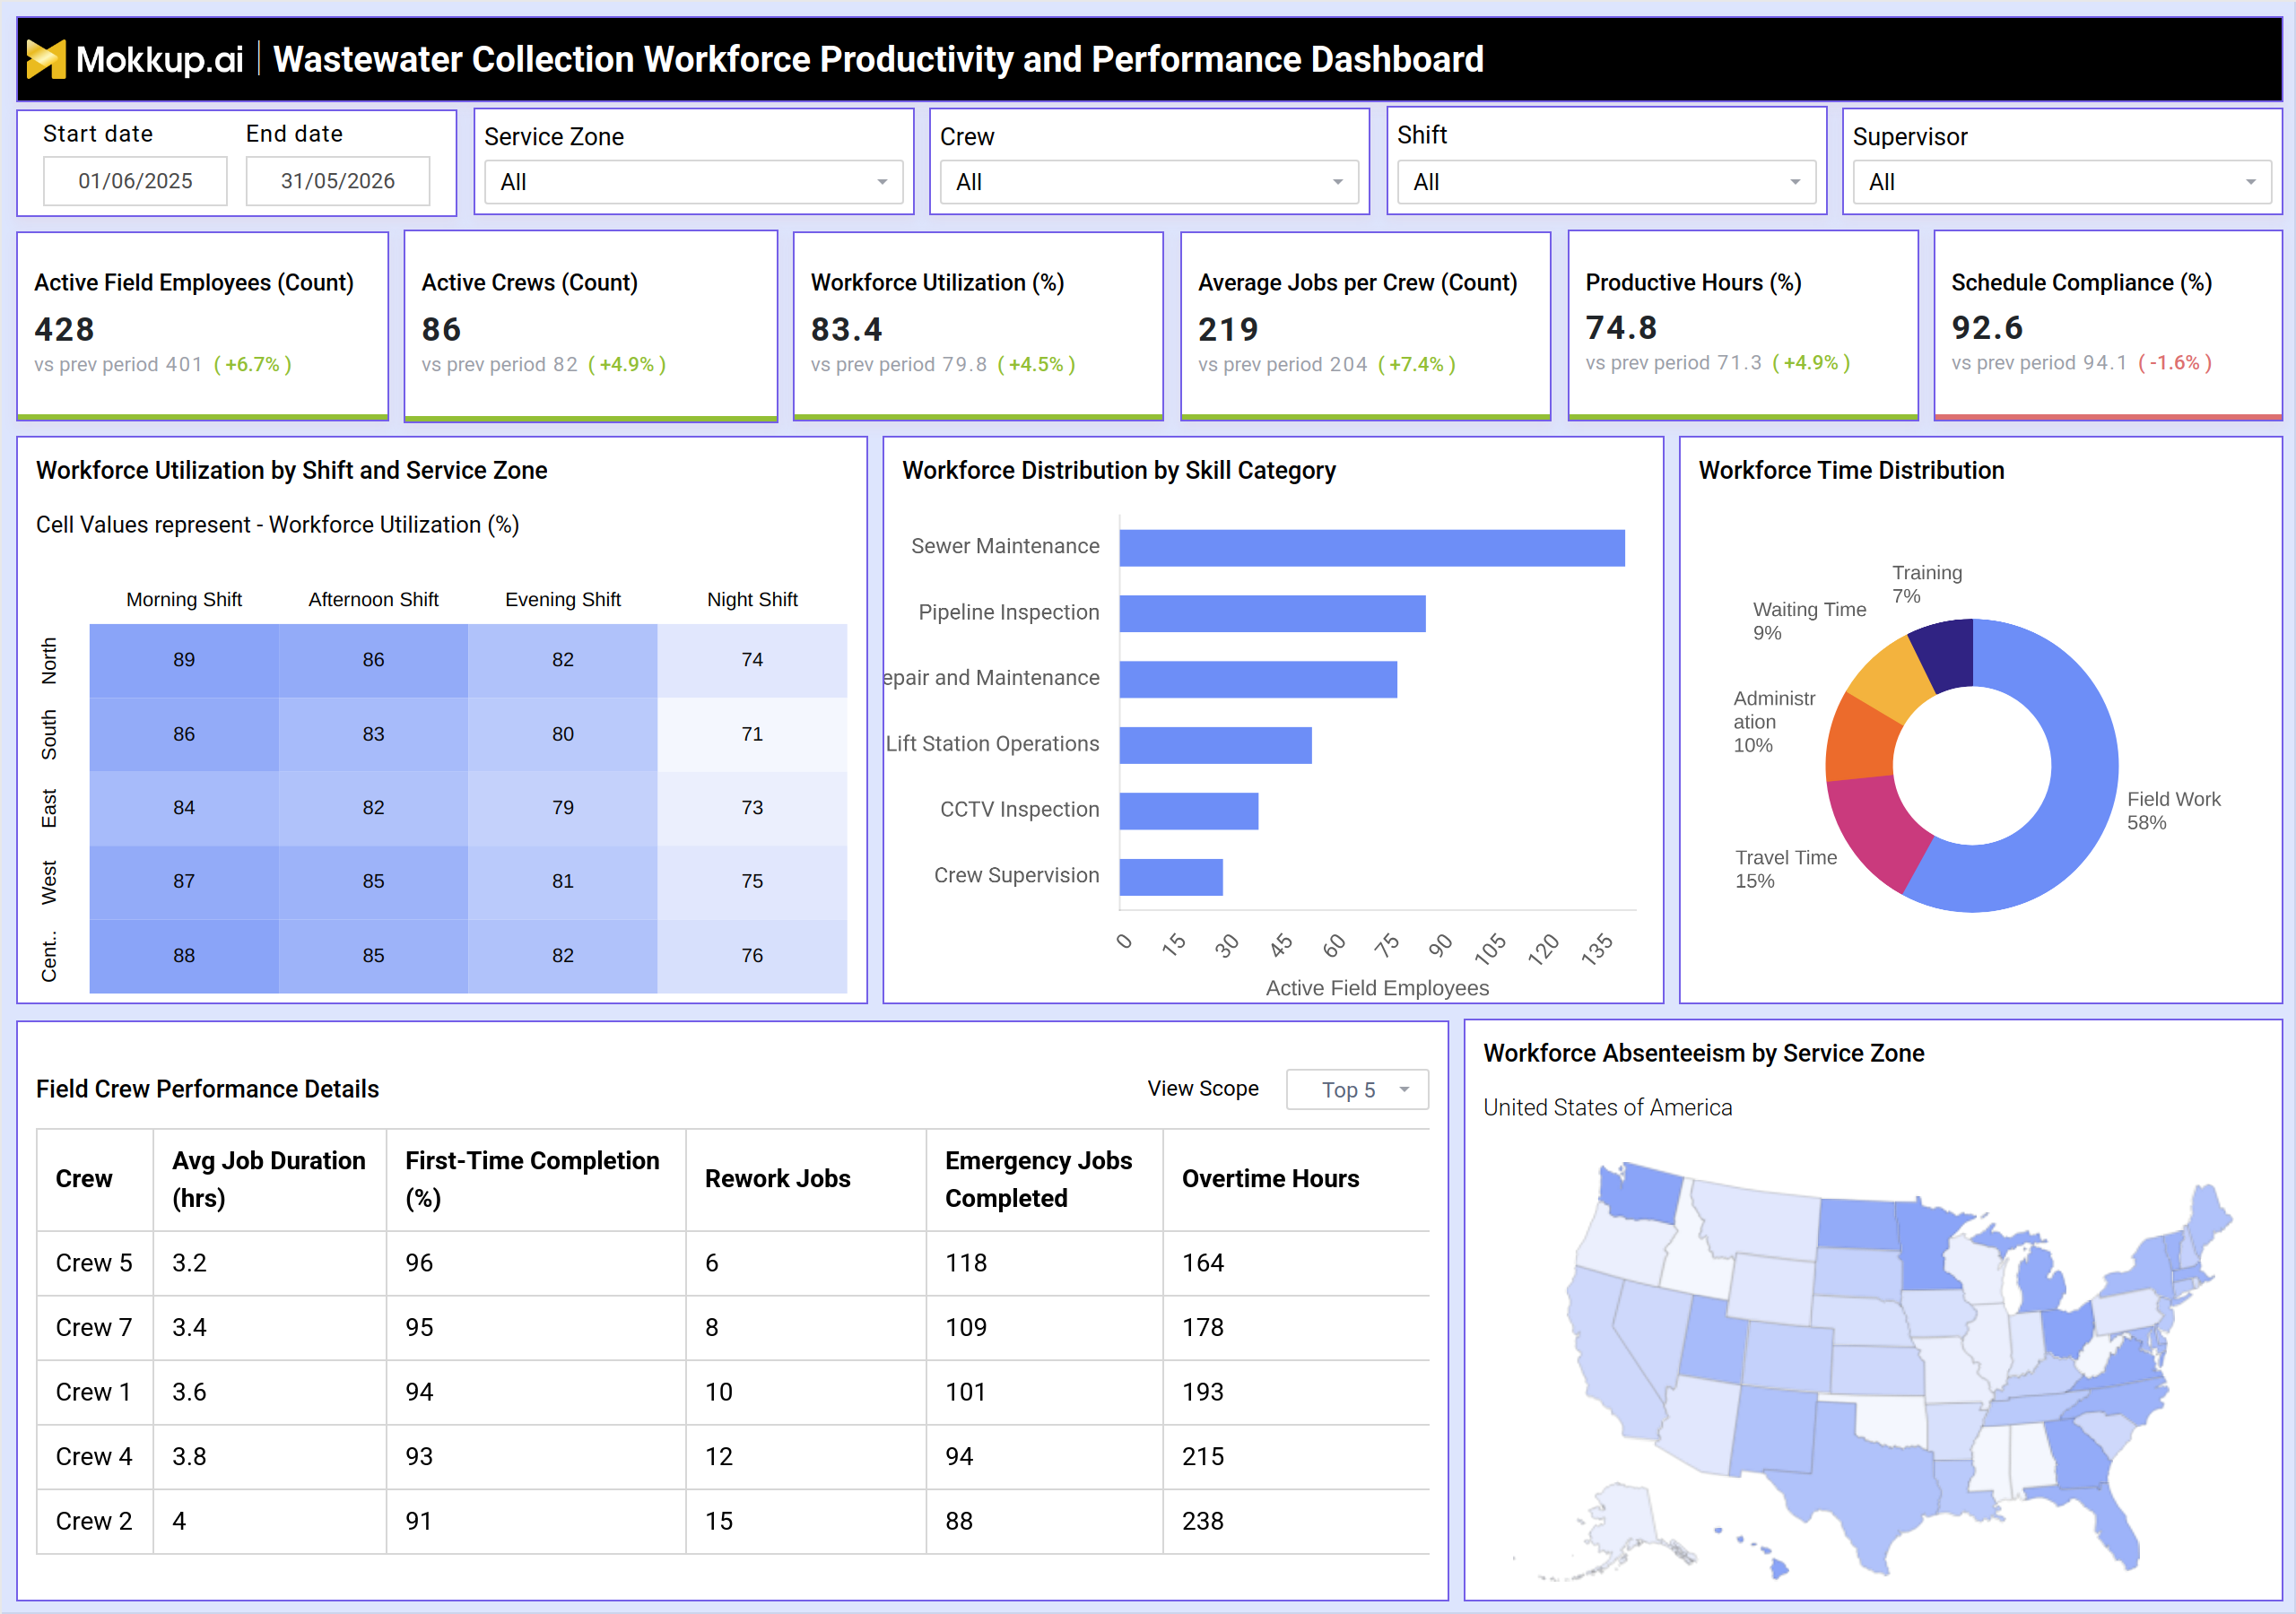
A wastewater collection workforce productivity dashboard delivers both headline staffing metrics and deep operational diagnostics in one view. KPI tiles surface Active Field Employees, Workforce Utilization, and Productive Hours, while a zone-shift heatmap flags where wastewater crew schedule compliance metrics are falling short. The Field Crew Performance Details table tracks first-time completion rates, rework jobs, and overtime — core inputs for sewer crew performance tracking software — alongside a skill distribution chart that shows whether headcount across Sewer Maintenance, Pipeline Inspection, Lift Station Operations, and CCTV Inspection matches incoming demand.
The final two views connect attendance to outcomes. The Absenteeism by Service Zone map supports pipeline inspection workforce absenteeism tracking geographically, while the Time Distribution chart quantifies non-productive hours for lift station operations workforce analytics teams — together making field employee utilization monitoring in wastewater environments actionable rather than observational.
How to Analyze Data in a Wastewater Collection Workforce Productivity and Performance Dashboard
Here is how you can analyze data from this dashboard:
- Use the shift and service zone utilization matrix to identify low-performing zone-shift combinations and prioritize crew redeployment.
- Compare Productive Hours percentage against Workforce Utilization to determine whether low utilization reflects absenteeism or time lost to non-field activities.
- Filter the Field Crew Performance Details table by supervisor or service zone to isolate accountability and track sewer crew performance tracking patterns at a team level.
- Cross-reference the Workforce Time Distribution donut chart with the absenteeism map to distinguish between time-loss driven by attendance gaps versus operational inefficiencies like excessive travel or waiting time.
- Use the Workforce Distribution by Skill Category bar chart to verify that crew skill mix aligns with current work order volume across pipeline inspection, lift station operations, and maintenance categories.
- Monitor Schedule Compliance percentage over time across shifts to identify whether compliance issues are shift-specific or systemic across the organization.
- Apply date range and crew filters simultaneously to isolate performance patterns for specific time periods or individual crews before escalating or rewarding.
Benefits of a Wastewater Collection Workforce Productivity and Performance Dashboard
The following are the benefits of using this dashboard:
- Provides a single source of truth for workforce utilization, crew deployment, and time distribution across all service zones and shifts.
- Reduces reliance on manual reporting by automatically surfacing key performance indicators in a visual, filterable interface.
- Enables faster root-cause analysis when productivity dips — connecting absenteeism data, utilization rates, and crew-level performance in one view.
- Supports better workforce planning by exposing skill category gaps and helping managers align crew composition with operational demand.
- Improves accountability at the crew and supervisor level through transparent performance data on first-time completion, rework, and overtime.
- Strengthens schedule compliance monitoring by making deviation patterns visible across shifts, zones, and time periods.
- Helps organizations pursuing field employee utilization monitoring in wastewater to benchmark performance and make data-backed staffing decisions
KPIs to Track in a Wastewater Collection Workforce Productivity and Performance Dashboard
The following key KPIs can be tracked by using this dashboard:
- Active Field Employees (Count): The total number of field employees currently active and on duty; this baseline figure is essential for contextualizing all other utilization and productivity metrics.
- Active Crews (Count): The number of crews currently deployed in the field; tracking this alongside Active Field Employees helps identify whether crews are adequately staffed or running below optimal size.
- Workforce Utilization (%): The percentage of the workforce actively engaged in productive or assigned work relative to total available capacity; a core metric for assessing how well labor resources are being used across zones and shifts in a wastewater collection workforce productivity dashboard context.
- Average Jobs per Crew: The mean number of jobs completed per crew during a given period; this metric helps compare crew output and flag whether certain crews are absorbing disproportionate workloads or underperforming relative to peers.
- Productive Hours (%): The share of total work hours spent on direct field work activities versus time lost to travel, administration, waiting, or training; central to sewer crew performance tracking and to identifying where time efficiency improvements are possible.
- Schedule Compliance (%): The percentage of jobs or activities completed according to the planned schedule; low compliance indicates scheduling, staffing, or logistics issues that need investigation, particularly important in lift station operations workforce analytics where response timing is critical.
Frequently Asked Questions
1. What types of organizations benefit most from a Wastewater Collection Workforce Productivity and Performance Dashboard?
Municipal utilities, water resource recovery facilities, and regional wastewater authorities with field crews spread across multiple service zones benefit most. Any organization managing sewer maintenance, CCTV inspection, or pipeline inspection workforce absenteeism tracking at scale will find the visibility into crew-level performance and utilization especially valuable.
2. How does the Workforce Utilization by Shift and Service Zone matrix help with staffing decisions?
The matrix allows managers to compare utilization rates across every combination of shift and geographic zone simultaneously, making it easy to identify where crews are underdeployed or overburdened. This directly informs redeployment decisions, shift scheduling adjustments, and resource prioritization without requiring separate analysis for each zone.
3. Can the dashboard support operational decisions during a shift?
The Field employee utilization monitoring wastewater dashboard is designed to support both ongoing monitoring and post-shift review, with filters for start date, end date, crew, shift, and supervisor enabling managers to narrow the view to current conditions. By tracking Active Field Employees, Schedule Compliance, and crew-level performance details, supervisors can identify and act on deviations during a shift rather than waiting for end-of-day reporting.