
What is a Wastewater Collection Spares & Materials Supply Chain Dashboard?
A wastewater collection spares and materials supply chain dashboard is a structured visual tool that consolidates inventory, procurement, and supplier data for the maintenance of wastewater collection infrastructure into a single, trackable interface. It gives supply chain managers, asset managers, and procurement teams a unified view of spare parts availability, inventory health, and purchasing activity across warehouses and material categories. By centralizing wastewater infrastructure spare parts inventory management into one screen, the dashboard removes the need to monitor procurement systems, warehouse records, and supplier data independently.
This dashboard is built for operations where stockouts, emergency procurement, and supplier lead time variability directly affect the reliability of collection network assets — including pumps, valves, pipes, electrical components, and civil network materials. It connects inventory performance metrics to the supply chain conditions that drive them, including purchase type distribution, aging stock, and materials at critical supply risk. The wastewater collection materials procurement spend analysis view gives procurement leads visibility into how spend is distributed across planned, contract, and emergency purchases, while the critical material supply risk tracking wastewater network table ensures that high-risk items remain in view before coverage gaps escalate into service disruptions.
How to Create a Wastewater Collection Spares & Materials Supply Chain Dashboard
You don't need to build your report from scratch; just start with a ready-to-use dashboard template from Mokkup. Add in your data and export it however you like. Here's how to do it:
1. Create or Log in to Your Mokkup Account
Start by signing up on Mokkup.ai using your email. If you already have an account, just log in, and you'll be good to go.
2. Choose and Customize Your Dashboard Template
Find the Wastewater Collection Spares & Materials Supply Chain Dashboard template in the Templates section. Use the drag-and-drop editor to adjust KPIs, edit filters, or add elements based on your data.
3. Export to Your BI Tool
Once your dashboard wireframe is ready, use the BI Tool Export feature to send it directly to Power BI or Tableau for further analysis and enhancements. You can also download the dashboard as a PDF, PNG, or JPEG, embed it on a platform, or invite your team to collaborate.
Note: This is a Pro template. You'll need a Pro subscription on Mokkup to use and customize this dashboard wireframe. Upgrade anytime to unlock full access.
Wastewater Collection Spares & Materials Supply Chain Dashboard Example
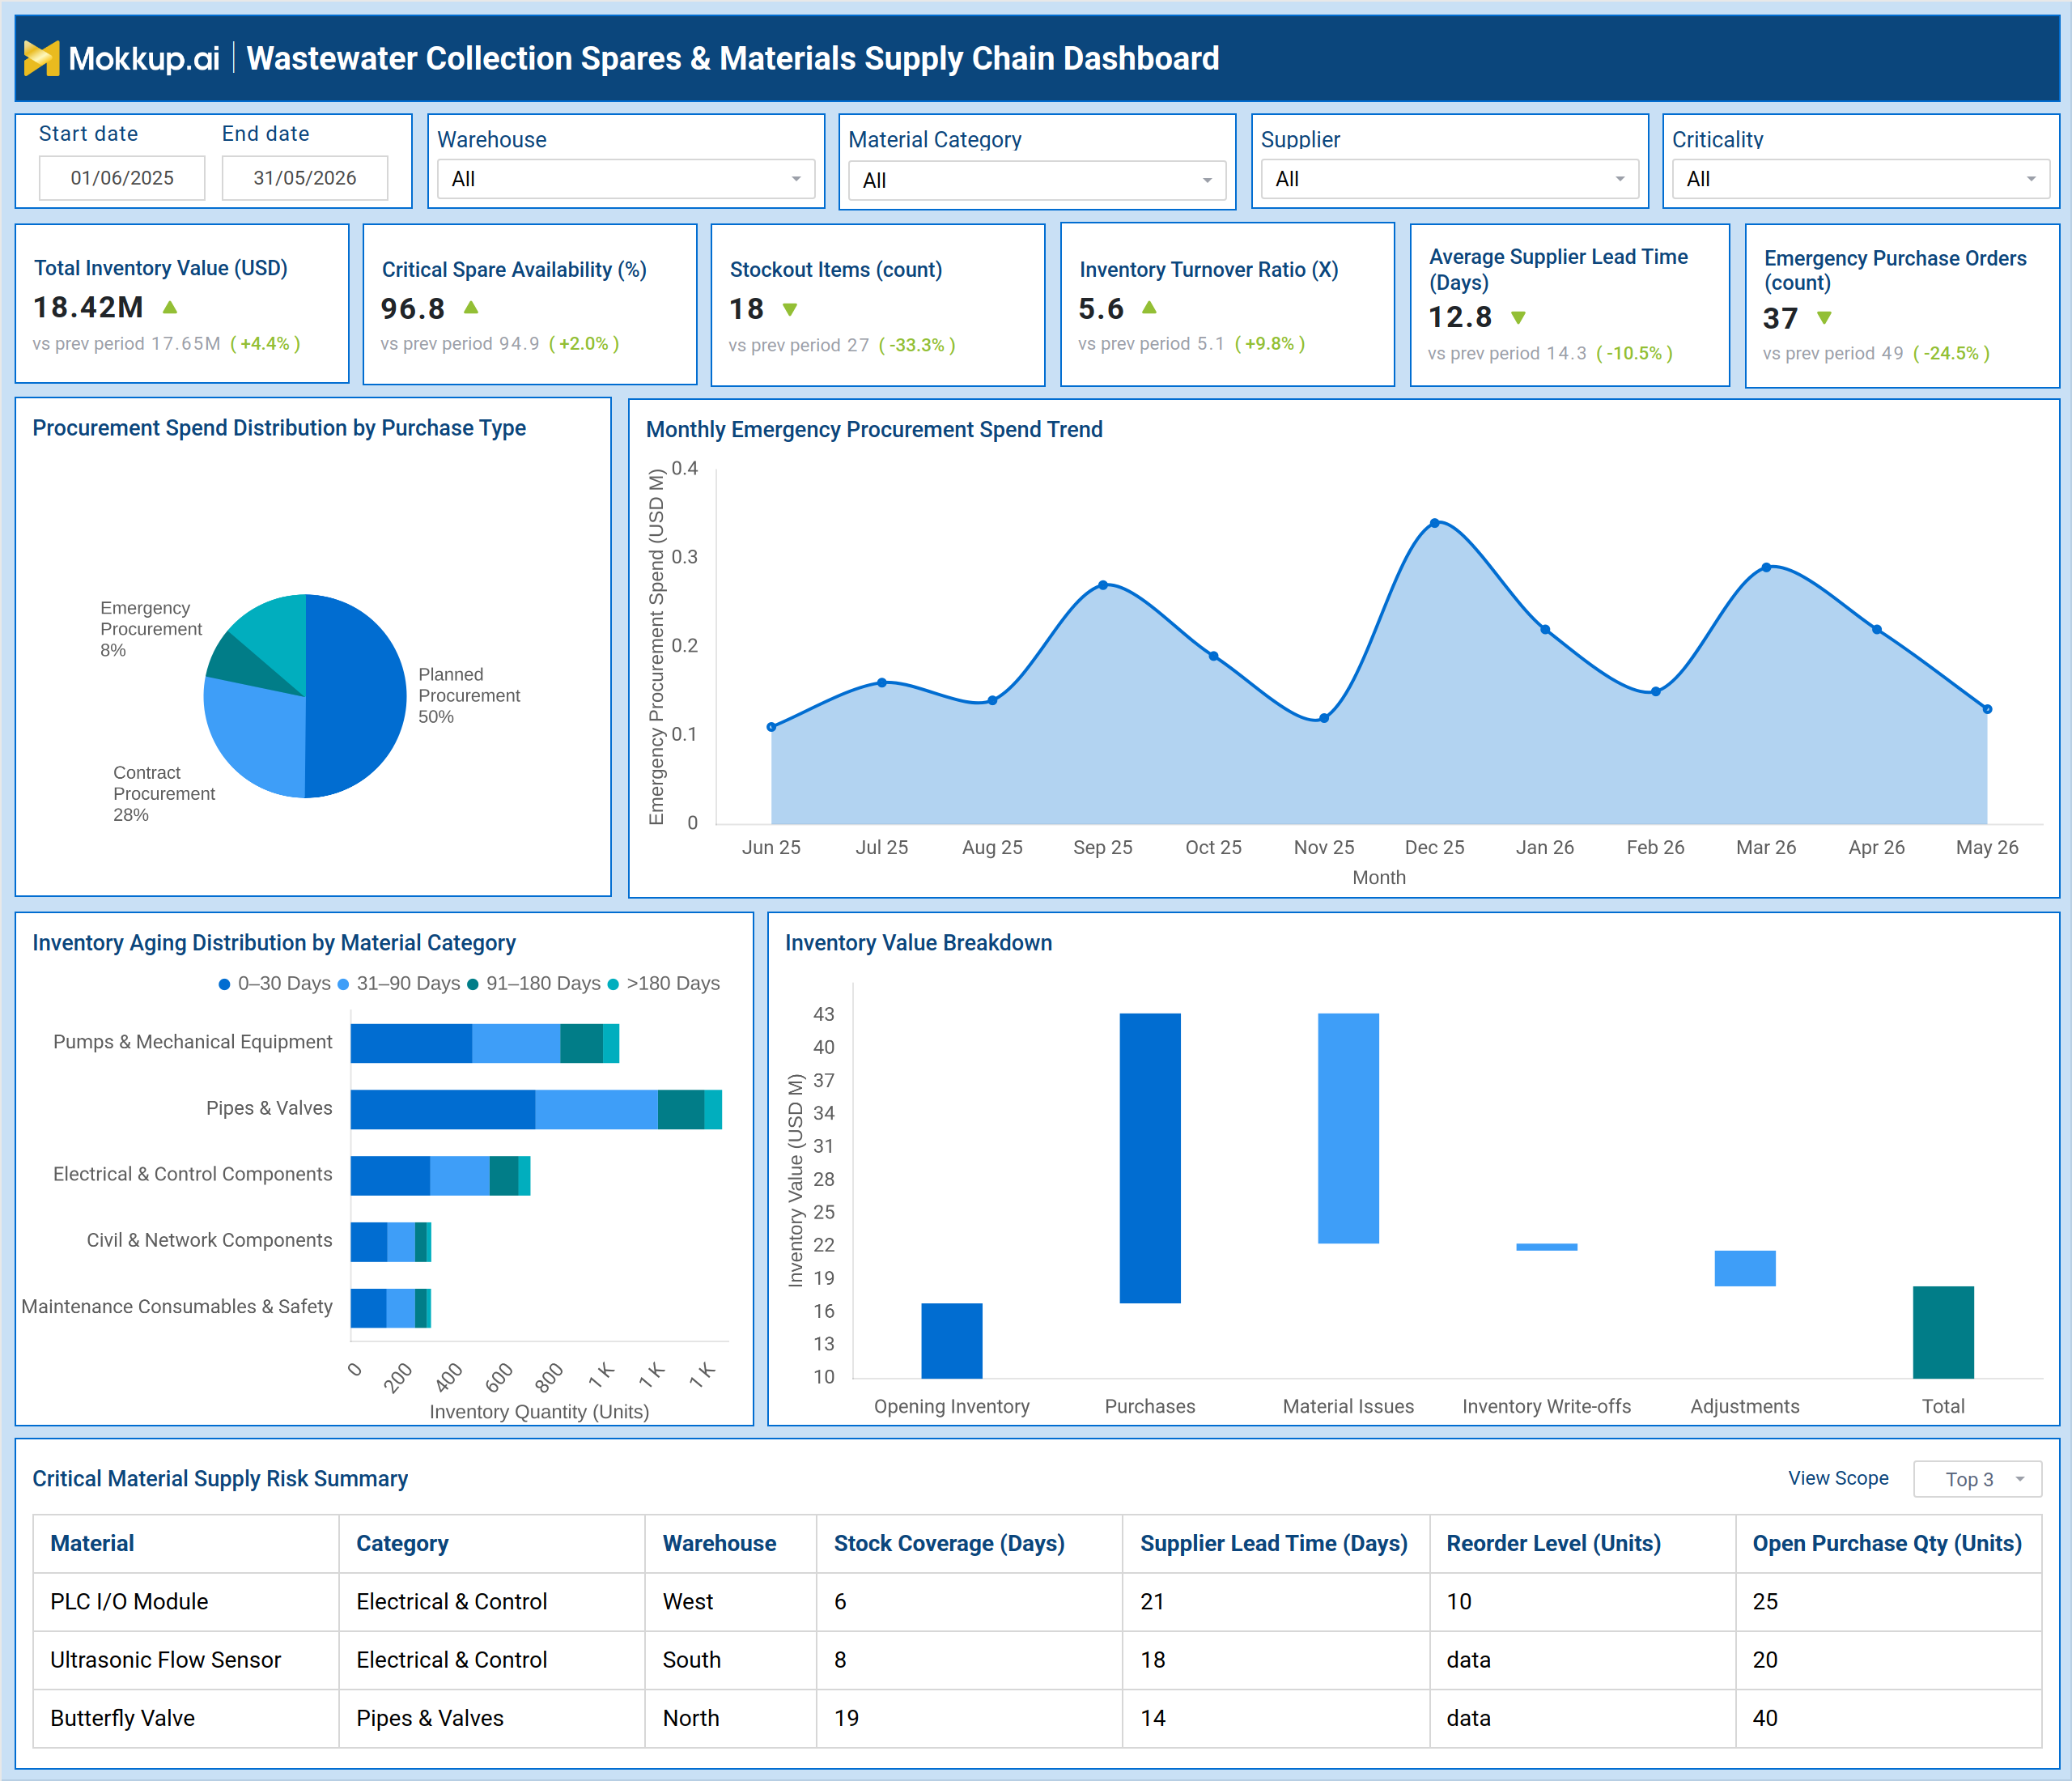
A supply chain manager opens this dashboard at the start of a review cycle to determine whether critical spare parts for the wastewater collection network are adequately stocked, whether procurement spend is aligned with planned purchasing patterns, and whether any materials are approaching stockout risk. The central question is immediate: are inventory levels sufficient to support maintenance activity, and is the balance between planned, contract, and emergency procurement spending staying within acceptable limits? Filters for warehouse, material category, supplier, and criticality allow the manager to focus on the most operationally sensitive segment of inventory before examining broader supply chain trends. This wastewater collection materials procurement spend analysis view is the starting point for any spend governance review.
From the KPI overview, the team can assess total inventory value, the proportion of critical spares with confirmed availability, the current stockout count, and the inventory turnover ratio. When the emergency purchase order count rises or average supplier lead time extends, the team can use the material category and supplier filters to narrow the root cause — whether the pressure is on a specific warehouse, a high-criticality category such as pumps and mechanical equipment, or a supplier whose lead times have grown beyond acceptable thresholds. The emergency procurement spend trend chart reinforces this by showing how unplanned purchasing costs have moved month over month, making it possible to assess whether emergency spend is isolated to a single period or forming a consistent pattern. The inventory aging distribution by material category chart gives warehouse managers visibility into which categories carry the highest proportion of long-duration stock. The critical material supply risk tracking wastewater network table at the bottom of the screen gives the clearest picture of where supply continuity is most vulnerable — showing stock coverage days, supplier lead time, reorder level, and open purchase quantity for each flagged material, making supplier lead time visibility for wastewater spare parts a continuous operational process rather than a periodic review exercise.
How to Analyze Data in a Wastewater Collection Spares & Materials Supply Chain Dashboard
Here is how you can analyze data from this dashboard:
- Supply Chain Health KPI Monitoring – Review key inventory KPIs to assess overall supply chain performance and identify priority areas
- Procurement Spend Distribution – Analyze planned, contract, and emergency procurement spending to identify purchasing inefficiencies
- Emergency Procurement Trends – Track emergency purchasing costs to identify recurring or increasing unplanned spending
- Inventory Aging by Material Category – Monitor aging inventory across material categories to identify slow-moving or obsolete stock
- Inventory Value Breakdown – Analyze inventory movements to understand changes in stock value and identify write-offs or discrepancies
- Critical Material Supply Risk Assessment – Compare stock coverage with supplier lead times to identify potential supply shortages
- Targeted Inventory and Procurement Analysis – Filter data by warehouse, supplier, material category, and criticality to analyze specific supply chain segments
Benefits of a Wastewater Collection Spares & Materials Supply Chain Dashboard
The following are the benefits of using this dashboard:
- Unified Inventory Visibility – Consolidate spare parts inventory across warehouses and material categories into a single view for easier monitoring
- Reduced Emergency Procurement – Improve stockout visibility and supplier lead time tracking to enable proactive reordering and minimize emergency purchases
- Better Inventory Planning – Monitor inventory aging to identify slow-moving or obsolete stock and optimize inventory levels
- Improved Procurement Governance – Track planned, contract, and emergency purchases to strengthen spending control and procurement discipline
- Faster Supply Risk Response – Centralize stock coverage, lead times, reorder levels, and open purchase orders to quickly identify critical material risks
- Simplified Inventory Reconciliation – Track inventory movements through a value breakdown to improve reconciliation and audit readiness
- Enhanced Supplier Performance Management – Monitor supplier lead times and compare vendor performance to improve procurement efficiency
KPIs to Track in a Wastewater Collection Spares & Materials Supply Chain Dashboard
The following key KPIs can be tracked by using this dashboard:
- Key Performance Indicators (KPIs) are quantifiable metrics that measure how effectively a process or operation is achieving its defined objectives. In wastewater collection supply chain operations, KPIs help procurement and inventory teams assess stock health, supplier reliability, and purchasing efficiency.
- Total Inventory Value (USD): Measures the aggregate monetary value of all spare parts and materials held in stock across warehouses, reflecting the capital tied up in inventory at any given point
- Critical Spare Availability (%): Tracks the proportion of designated critical spare parts that are currently available in stock, indicating how well the supply chain is protecting operational continuity for the wastewater collection network
- Stockout Items (count): Counts the number of distinct material items currently at zero stock, highlighting immediate supply gaps that could delay maintenance or repair work
- Inventory Turnover Ratio (X): Measures how frequently the total inventory is consumed and replenished over the selected period, with higher values indicating more efficient stock utilization relative to holding levels
- Average Supplier Lead Time (Days): Tracks the mean time between placing a purchase order and receiving the goods from suppliers, directly informing safe reorder point calculations and supply risk assessment
- Emergency Purchase Orders (count): Counts the number of purchase orders raised outside normal planned or contract procurement cycles, serving as a proxy indicator for inventory planning effectiveness and reactive procurement frequency
Frequently Asked Questions
1. What makes a wastewater collection spares and materials supply chain dashboard useful for procurement teams?
It combines inventory health, procurement spend patterns, and supplier lead time data into a single filterable view so teams can identify supply risks without pulling reports from separate systems. The critical material supply risk table makes it possible to act on coverage gaps before they become stockouts.
2. How does wastewater collection materials procurement spend analysis support spend governance?
By breaking procurement spend into planned, contract, and emergency purchase types, the dashboard makes it measurable how much of total spend is unplanned. Teams can track this distribution over time and take corrective action when emergency procurement begins consuming a disproportionate share of the budget.
3. How does supplier lead time visibility for wastewater spare parts reduce supply chain risk?
Monitoring average supplier lead time as a headline KPI, alongside per-material lead times in the risk summary table, allows teams to compare lead time against current stock coverage days for each critical item. When coverage falls below lead time, procurement can be triggered immediately rather than discovered during a maintenance event.