What is a Bioenergy Power Plant Supply Chain Dashboard?
A Bioenergy Power Plant Supply Chain Dashboard Template is a centralized analytics tool used by utilities and biomass power plants to monitor, control, and optimize the end-to-end flow of biomass fuel from suppliers to storage and plant consumption. It combines operational logistics, inventory execution, and strategic procurement metrics into a single interface.
The dashboard wireframe provides visibility into biomass feedstock supply chain performance, including inbound deliveries, inventory days on hand, fuel quality parameters, logistics cost, and supplier reliability. By integrating biomass feedstock inventory tracking with procurement and transport data, operators can ensure continuous fuel availability, reduce supply disruptions, and maintain stable plant operations.
How to Create a Bioenergy Power Plant Supply Chain Dashboard
You don’t need to build your report from scratch, just start with a ready-to-use Bioenergy Power Plant Supply Chain dashboard template from Mokkup. Add in your data and export it however you like. Here’s how to do it:
1. Create or Log in to Your Mokkup Account
Start by signing up on Mokkup.ai using your email. If you already have an account, just log in, and you’ll be good to go.
2. Choose and Customize Your Dashboard Template
Find the Bioenergy Power Plant Supply Chain Dashboard template in the Templates section. Use the drag-and-drop editor to adjust KPIs, edit filters, or add elements based on your data.
3. Export to Your BI Tool
Once your dashboard wireframe is ready, use the BI Tool Export feature to send it directly to Power BI or Tableau for further analysis and enhancements. You can also download the dashboard as a PDF, PNG, or JPEG, embed it on a platform, or invite your team to collaborate.
Note: This is a Pro template. You’ll need a Pro subscription on Mokkup to use and customize this dashboard wireframe. Upgrade anytime to unlock full access.
Bioenergy Power Plant Supply Chain Dashboard Example
You can build a biomass feedstock logistics dashboard using two core modules: tactical logistics and inventory execution, and strategic procurement and supply assurance. The tactical view focuses on daily operations, displaying KPIs such as current fuel inventory days on hand, total inbound biomass deliveries, average delivery transport time, and logistics costs. Visual trends show how inventory levels fluctuate over time and whether fuel availability aligns with plant demand.The inventory section highlights stock status distribution across available, reserved, degraded, and waste categories, helping teams assess usable biomass volumes. Delivery breakdowns by transport mode provide insight into truck, tractor-trailer, and rail dependency, while inventory loss analysis tracks moisture damage, microbial degradation, and handling losses.
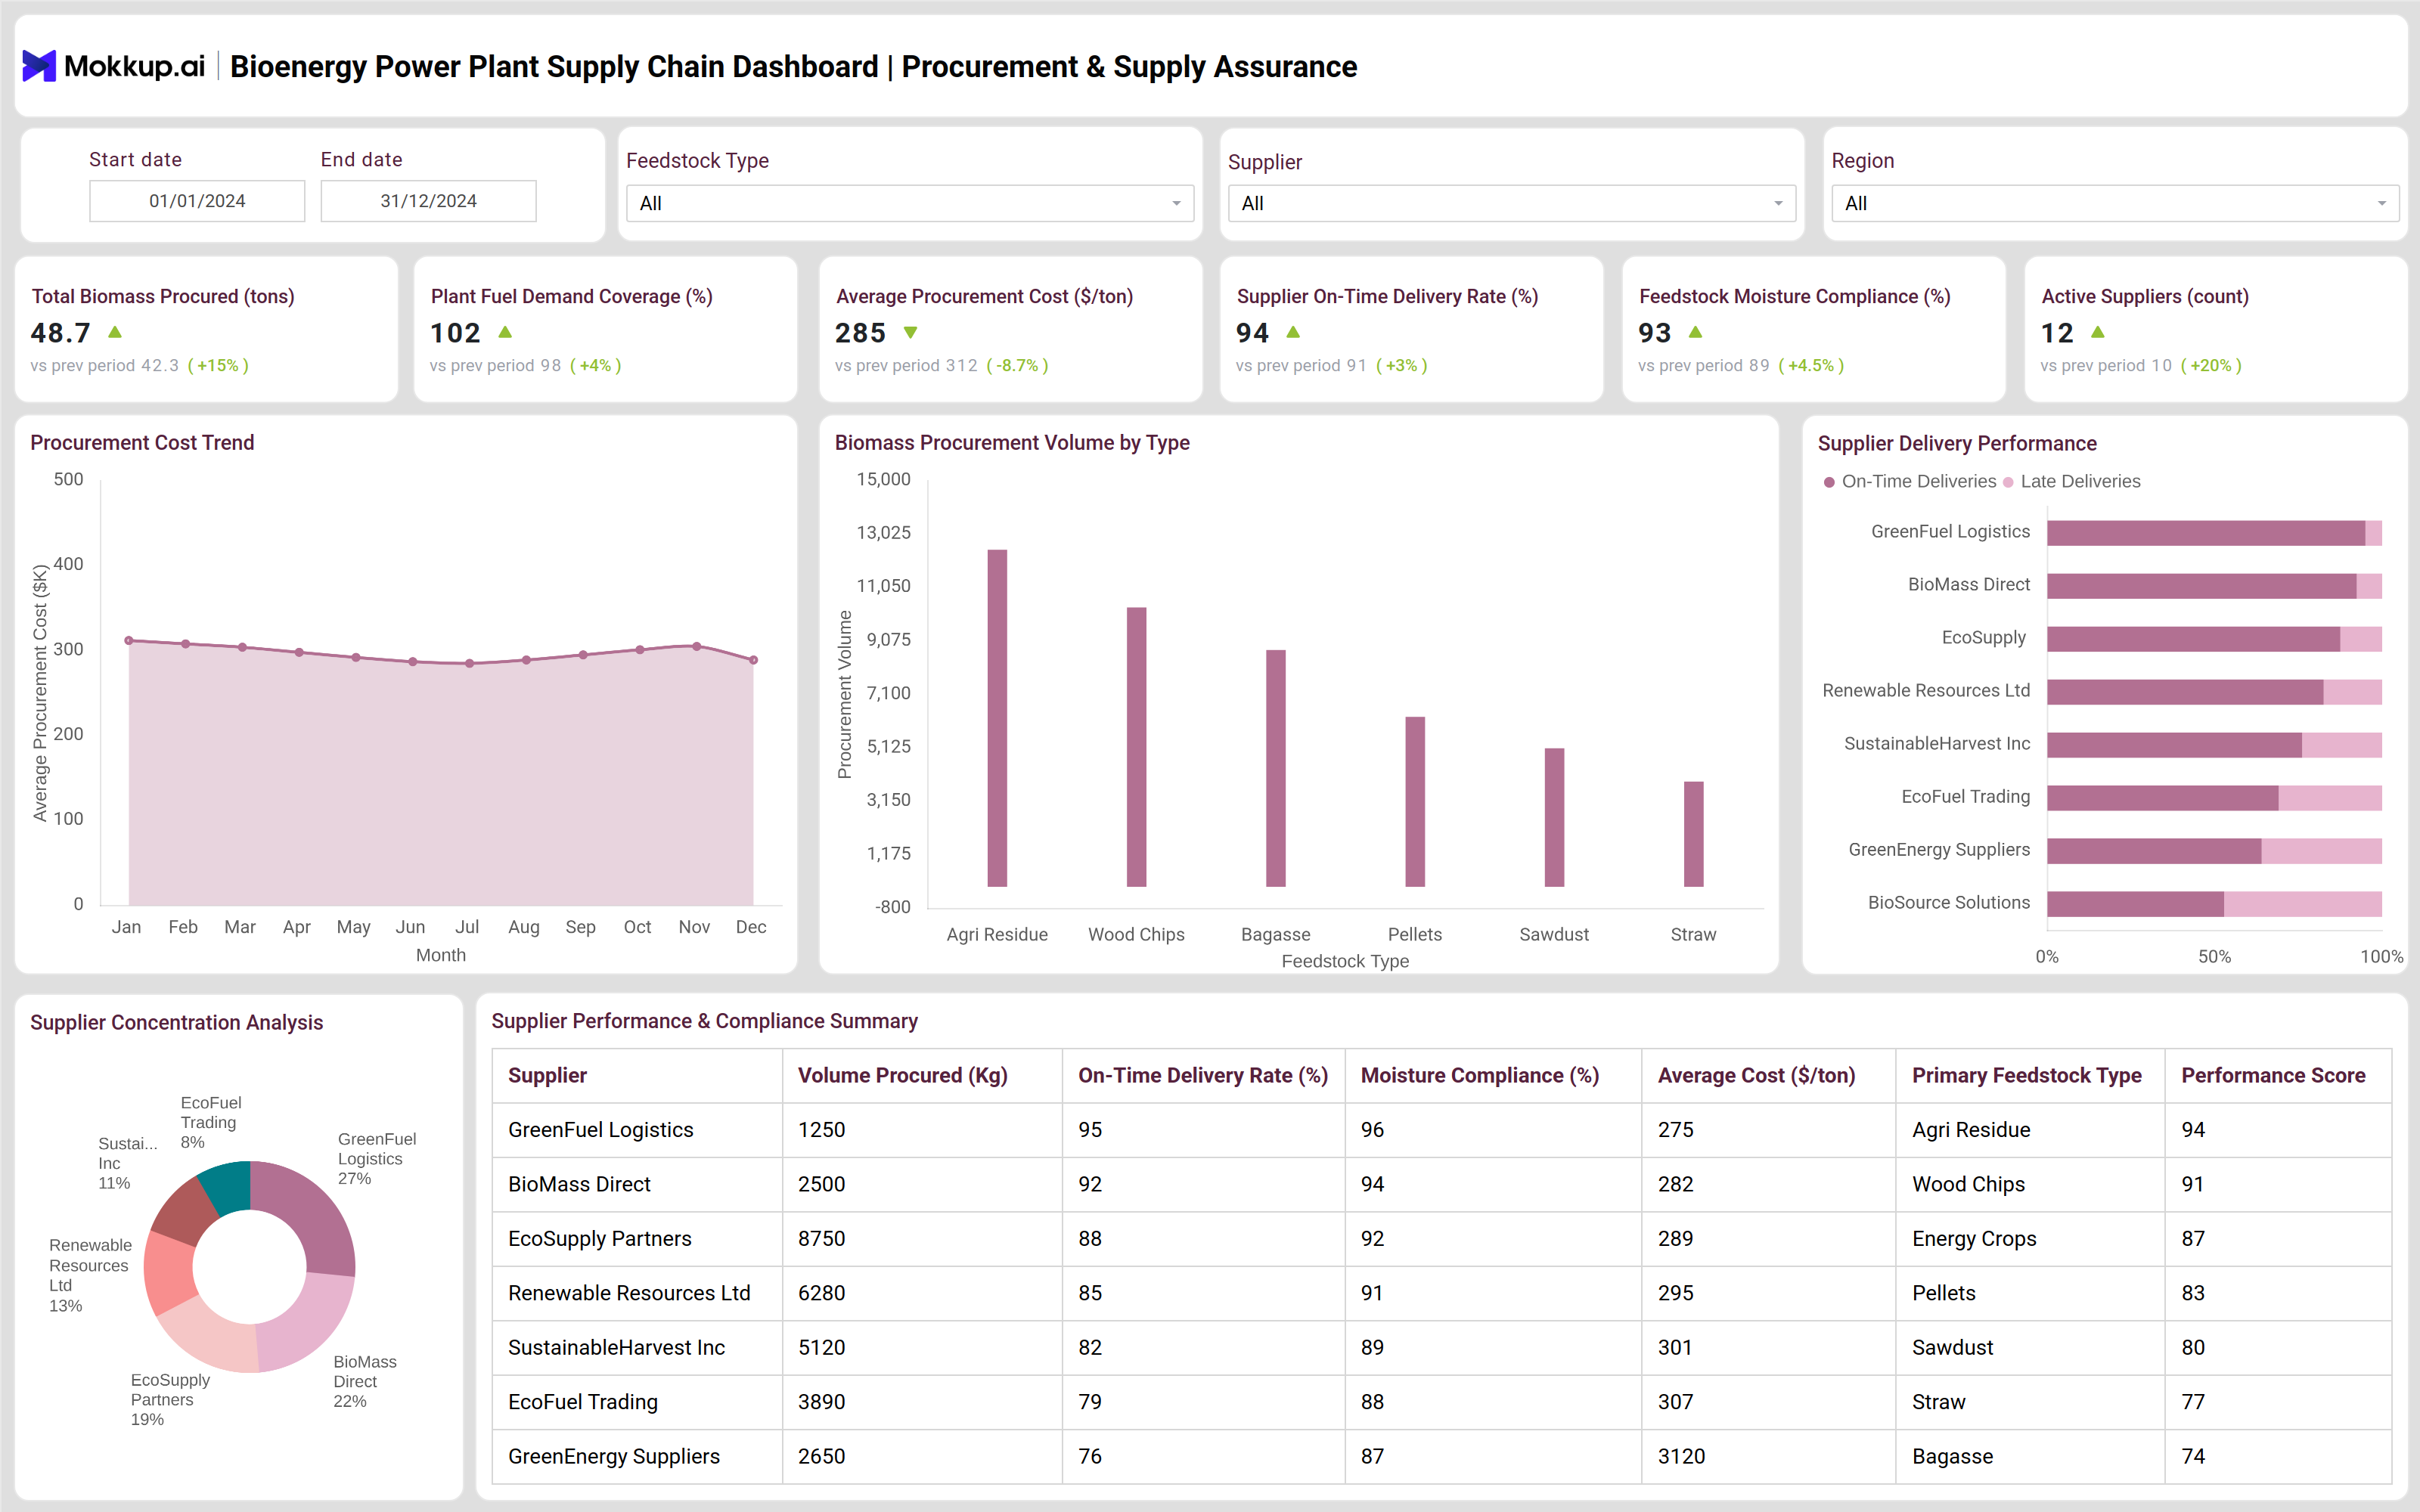
Detailed delivery logs capture supplier, quantity, transport duration, moisture levels, and receipt status to support biomass fuel supply monitoring.The strategic procurement view extends visibility into total biomass procured, plant fuel demand coverage, supplier on-time delivery rates, feedstock moisture compliance, and procurement costs. Supplier performance charts compare delivery reliability and quality, while procurement volume by feedstock type enables planners to balance cost, availability, and fuel quality across agri-residue, wood chips, pellets, and other biomass sources.
How to Analyze Bioenergy Power Plant Supply Chain Dashboard
Here is how you can analyze data from this dashboard:
- Fuel Inventory Buffer Assessment: Review fuel inventory days on hand to ensure sufficient buffer stock against supply disruptions.
- Supply vs Consumption Balance: Track inbound biomass deliveries against consumption to identify supply-demand gaps early.
- Inventory Quality Monitoring: Analyze inventory status distribution to detect degraded or unusable feedstock at an early stage.
- Logistics Mode Optimization: Compare deliveries by transport mode to optimize logistics cost and delivery timelines.
- Fuel Quality Trend Analysis: Monitor moisture content trends to maintain combustion efficiency and fuel quality.
- Loss Root Cause Identification: Evaluate inventory loss categories to reduce waste from storage, handling, or spoilage issues.
- Supplier Performance Tracking: Assess supplier on-time delivery rates and moisture compliance to manage vendor risk.
- Procurement Cost Control: Analyze procurement cost trends to control fuel expenses without impacting availability.
Benefits of Bioenergy Power Plant Supply Chain Dashboard
The following are the benefits of using this dashboard:
- Improved Feedstock Visibility: Improves biomass feedstock availability tracking across logistics and storage stages.
- Reduced Fuel Shortage Risk: Aligns inventory levels with plant demand forecasts to prevent shortages.
- Data-Driven Procurement Decisions: Enhances biomass supply chain analytics for informed sourcing and contracting.
- Lower Fuel Losses: Minimizes losses caused by moisture, degradation, and handling inefficiencies.
- Optimized Logistics Costs: Reduces transport and handling costs through delivery mode and timing analysis.
- Stronger Supplier Accountability: Strengthens supplier management using performance and compliance metrics.
- Stable Power Generation: Supports consistent generation by ensuring steady fuel quality and supply volume.
KPIs to Track in Bioenergy Power Plant Supply Chain Dashboard
The following key KPIs can be tracked by using this dashboard:
- Fuel Inventory Days on Hand: Measures how long current biomass stock can sustain plant operations.
- Total Inbound Biomass Deliveries: Tracks the volume of biomass received from suppliers.
- Average Delivery Transport Time: Indicates logistics efficiency and delivery reliability.
- Inventory Status Distribution: Shows the proportion of usable, reserved, degraded, and waste feedstock.
- Inventory Loss Percentage: Quantifies biomass losses due to moisture, degradation, or handling.
- Plant Fuel Demand Coverage: Measures how well procured biomass meets operational fuel requirements.
- Supplier On-Time Delivery Rate: Evaluates supplier reliability in meeting delivery schedules.
- Feedstock Moisture Compliance: Tracks adherence to acceptable moisture thresholds for fuel quality.
- Average Procurement Cost per Ton: Monitors fuel cost efficiency across suppliers and feedstock types.
Frequently Asked Questions
Q1. What is the purpose of a Bioenergy Power Plant Supply Chain Dashboard?
It provides end-to-end visibility into biomass fuel procurement, logistics, inventory, and supplier performance to ensure reliable plant operations.
Q2. Who uses a Bioenergy Power Plant Supply Chain Dashboard?
Operations managers, supply chain planners, procurement teams, and plant managers in biomass power facilities.
Q3. How does the dashboard support biomass fuel supply monitoring?
It tracks deliveries, inventory levels, moisture quality, and consumption trends in real time.
Q4. Can this dashboard help reduce biomass fuel losses?
Yes, by identifying degradation, moisture damage, and handling losses early.
Q5. Is the dashboard suitable for multi-supplier biomass procurement?
Yes, it compares supplier performance, cost, and quality across multiple feedstock sources.