
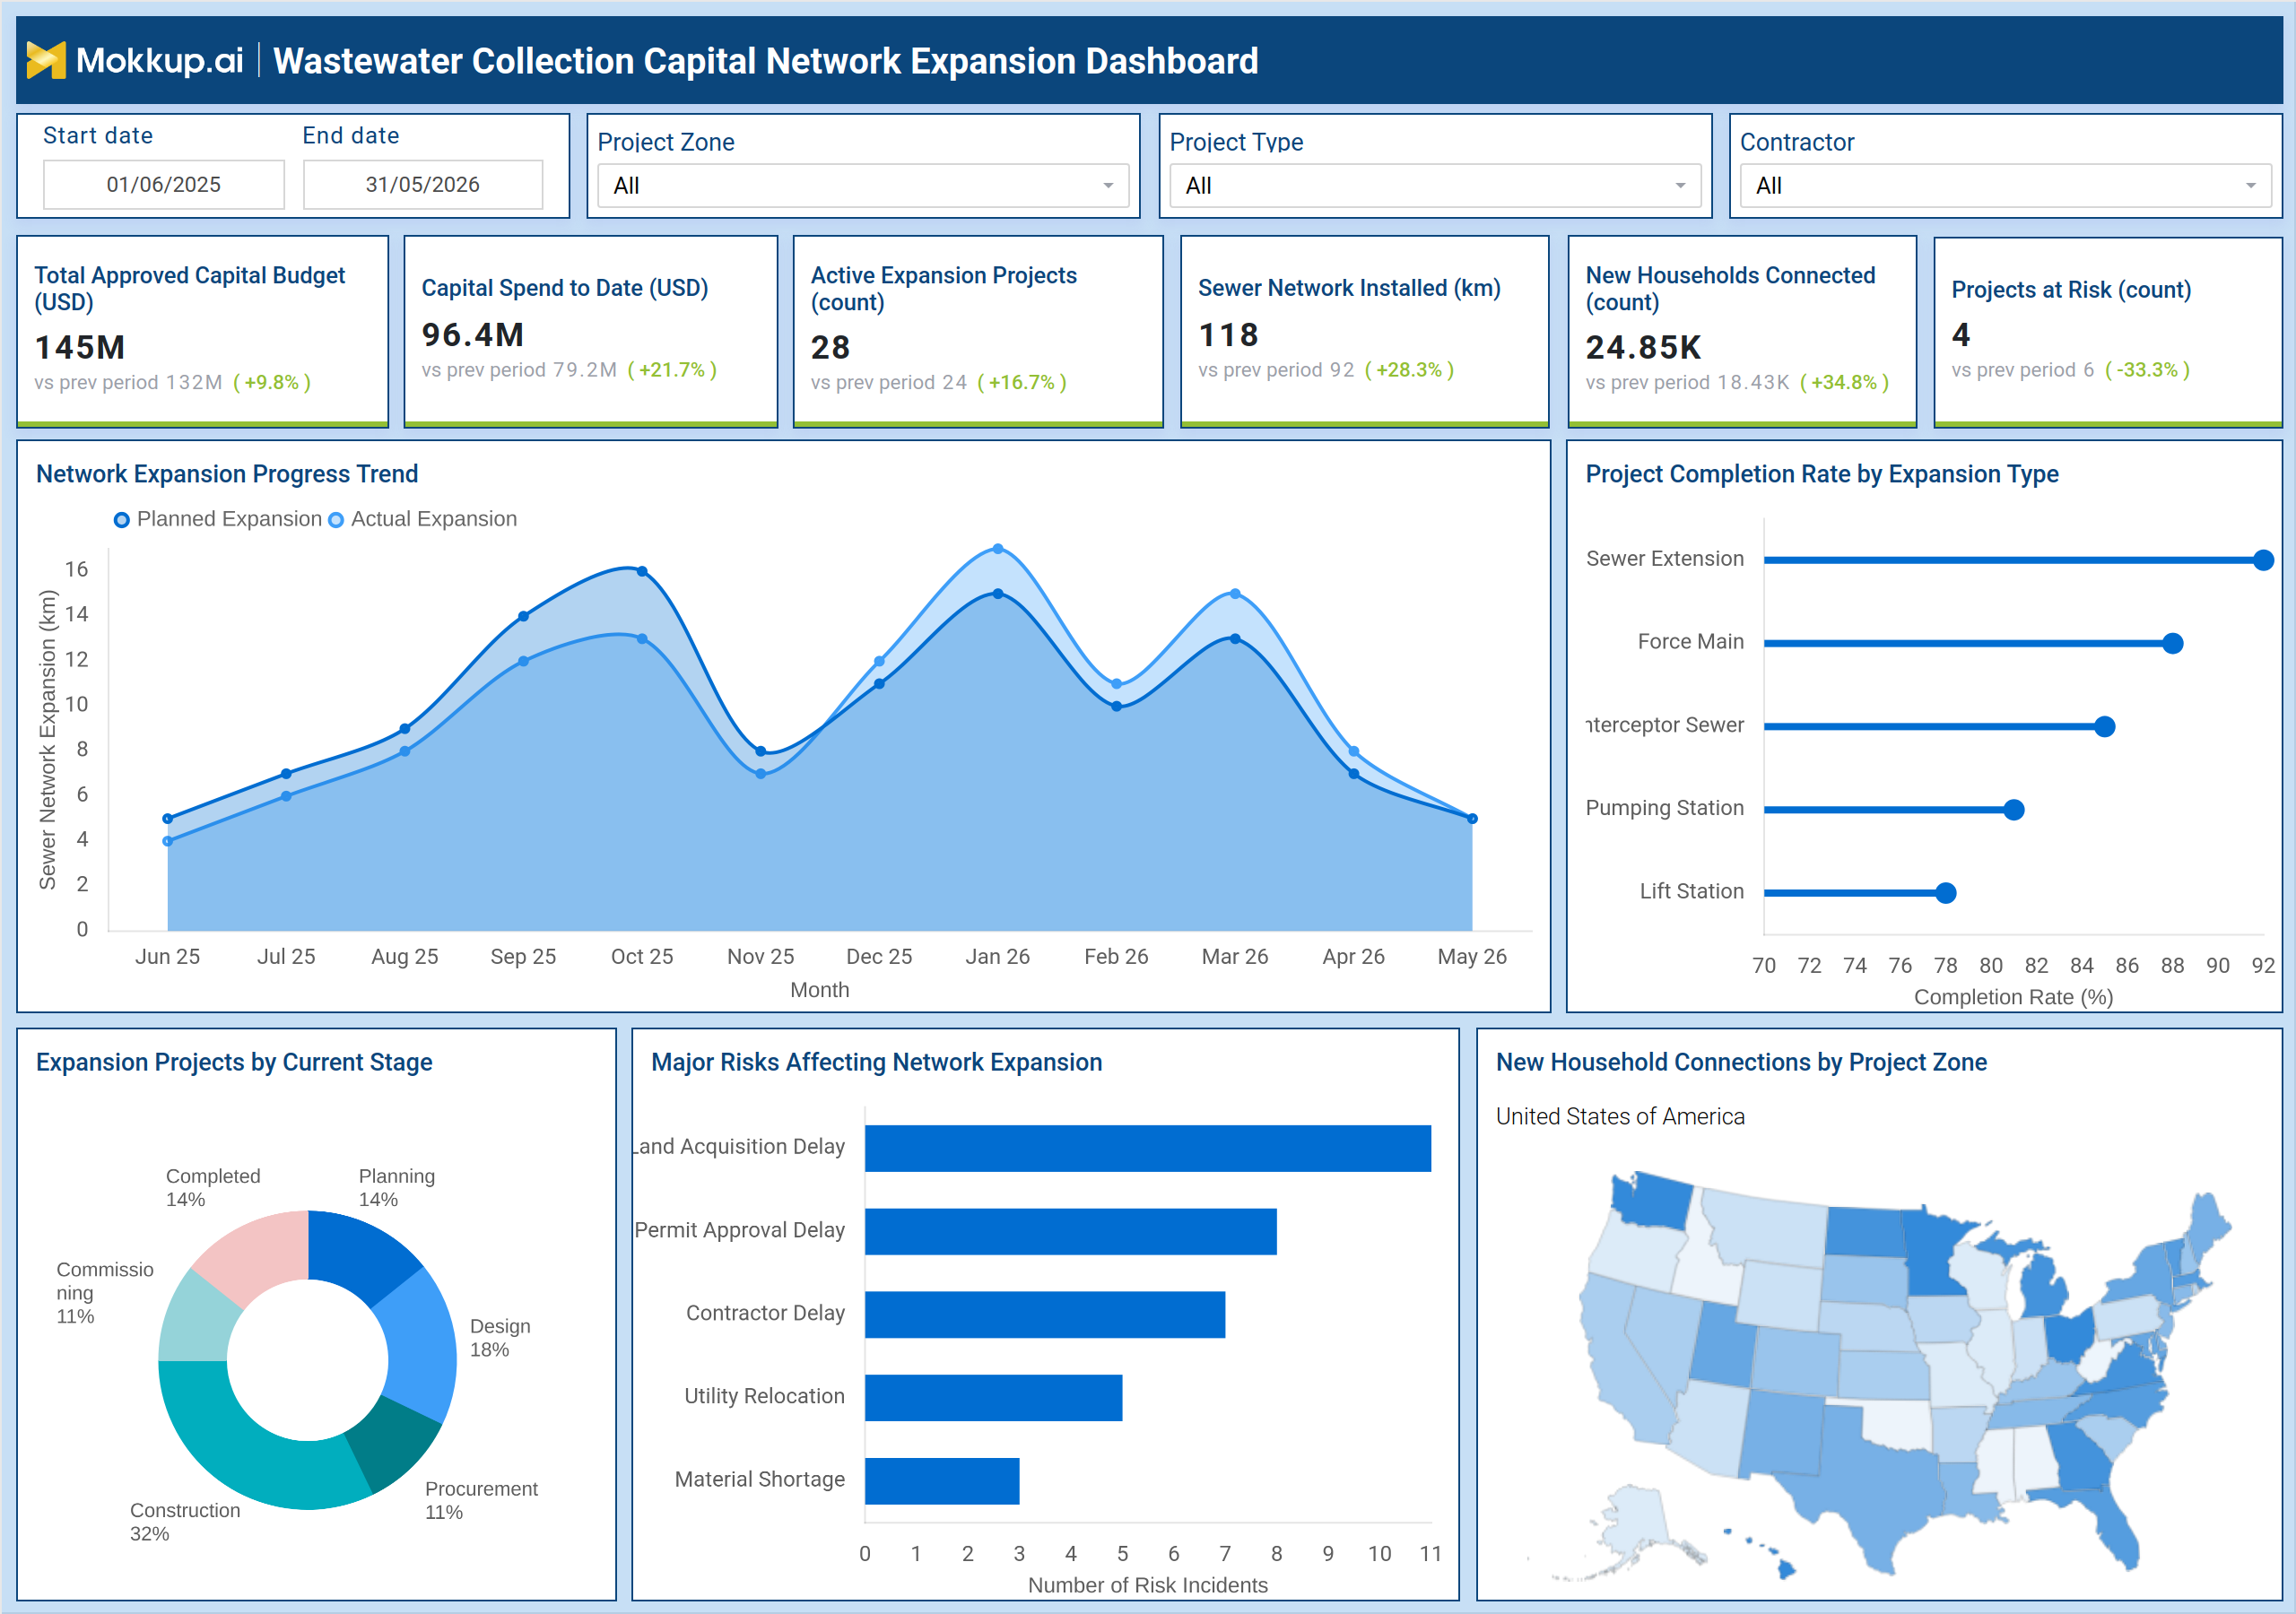
What is a Wastewater Collection Capital Network Expansion Dashboard?
The Wastewater Collection Capital Network Expansion Dashboard is a purpose-built analytics template for municipal utility managers, capital project teams, and infrastructure planners overseeing the growth of the sewer network. It consolidates approved budgets, active expansion projects, installation milestones, and risk incidents into one structured view that functions as a complete municipal wastewater project management dashboard. At its core, it uses wastewater collection network expansion tracking to enable teams to move beyond isolated reports and gain a coordinated picture of their full capital program. From sewer network expansion KPI monitoring to mapping new household connections by project zone, it supports the entire decision chain from executive oversight to field-level planning. The dashboard surfaces progress and risk simultaneously, making it an essential tool in any sewer infrastructure capital budget dashboard toolkit for utilities managing large-scale, multi-project programs.
How to Create a Wastewater Collection Capital Network Expansion Dashboard
You don't need to build your report from scratch; just start with a ready-to-use dashboard template from Mokkup. Add in your data and export it however you like. Here's how to do it:
1. Create or Log in to Your Mokkup Account
Start by signing up on Mokkup.ai using your email. If you already have an account, just log in, and you'll be good to go.
2. Choose and Customize Your Dashboard Template
Find the Wastewater Collection Capital Network Expansion Dashboard template in the Templates section. Use the drag-and-drop editor to adjust KPIs, edit filters, or add elements based on your data.
3. Export to Your BI Tool
Once your dashboard wireframe is ready, use the BI Tool Export feature to send it directly to Power BI or Tableau for further analysis and enhancements. You can also download the dashboard as a PDF, PNG, or JPEG, embed it on a platform, or invite your team to collaborate.
Note: This is a Pro template. You'll need a Pro subscription on Mokkup to use and customize this dashboard wireframe. Upgrade anytime to unlock full access.
Wastewater Collection Capital Network Expansion Dashboard Example
A capital program manager at a regional water authority typically opens this dashboard at the start of each weekly review to assess whether the network expansion is on pace with approved plans. The KPI row immediately indicates how total spend tracks against the approved capital budget, how many projects are currently active, and how many kilometers of sewer network have been installed. If the number of projects at risk has risen, teams can identify which expansion types or zones are contributing to that shift before it affects delivery timelines. Using the Network Expansion Progress Trend, planners compare actual sewer installations against planned targets every month, pinpointing periods where execution fell behind schedule. The Project Completion Rate by Expansion Type chart allows teams to benchmark which infrastructure categories — force mains, pumping stations, or lift stations — are progressing well and which are lagging behind milestones.
When risk reviews come up, the Major Risks Affecting Network Expansion chart ranks incident types by frequency, from land acquisition delays to material shortages. The Expansion Projects by Current Stage donut shows how the project portfolio is distributed across planning, design, procurement, construction, and commissioning phases, helping leadership assess pipeline balance. For utilities managing capital infrastructure expansion project risk tracking across multiple zones, the New Household Connections by Project Zone map highlights where connection growth is concentrated. Teams that rely on wastewater utility network expansion analytics use this geographic layer to guide contractor deployments and zone-level reporting.
How to Analyze Data in a Wastewater Collection Capital Network Expansion Dashboard
Here is how you can analyze data from this dashboard:
- Capital Spend vs. Approved Budget – Track capital expenditure against the total approved budget to identify overspending or underspending trends early and maintain financial control across expansion programs.
- Active Expansion Project Count – Monitor the number of ongoing expansion projects across reporting periods to assess program velocity, pipeline health, and overall project momentum.
- Network Expansion Progress Trend – Compare actual sewer network installations against planned targets on a month-over-month basis to evaluate project progress and identify schedule deviations.
- Project Completion Rate by Expansion Type – Analyze completion rates across different infrastructure categories to determine which project types are progressing as expected and which require corrective action.
- Major Risk Analysis – Review key project risks, including land acquisition challenges, permit delays, contractor issues, and supply chain constraints, to prioritize mitigation efforts and minimize project disruptions.
- Expansion Projects by Current Stage – Assess the distribution of projects across planning, design, construction, and completion stages to identify portfolio imbalances and optimize project management strategies.
- New Household Connections by Project Zone – Use geographic analysis to track new household connections across project zones, ensuring equitable service delivery and identifying regions requiring additional infrastructure investment.
Benefits of a Wastewater Collection Capital Network Expansion Dashboard
The following are the benefits of using this dashboard:
- Centralized Capital Program Visibility – Consolidate capital program data from multiple project zones into a single view, eliminating reporting silos and improving cross-functional visibility.
- Proactive Risk Management – Surface the most frequent and impactful risk categories early, enabling teams to prioritize mitigation efforts before they affect project delivery timelines.
- Informed Capital Allocation – Provide instant visibility into budget utilization and project velocity, helping decision-makers allocate capital efficiently and optimize investment strategies.
- Integrated Sewer Network Expansion KPI Monitoring – Track financial, operational, and field delivery metrics in a unified framework to ensure expansion projects remain aligned with strategic goals.
- Comprehensive Expansion Analytics – Deliver wastewater utility network expansion analytics that support both high-level executive reporting and detailed operational planning.
- Reduced Manual Reporting Effort – Streamline reporting processes by consolidating KPIs, project trends, progress metrics, and risk insights into a single, easy-to-use dashboard template.
KPIs to Track in a Wastewater Collection Capital Network Expansion Dashboard
The following key KPIs can be tracked by using this dashboard:
- Total Approved Capital Budget: The total budget authorized for all wastewater network expansion projects within the program period.
- Capital Spend to Date: The cumulative amount spent across active expansion projects, measured against the approved capital budget.
- Active Expansion Projects: The number of sewer network expansion projects currently in execution at any point in time.
- Sewer Network Installed (km): The total length of new sewer infrastructure installed and commissioned during the reporting period.
- New Households Connected: The number of new residential connections added to the wastewater collection network within the period.
- Projects at Risk: The count of expansion projects flagged as at risk due to schedule delays, budget overruns, or unresolved issues.
- Project Completion Rate by Expansion Type: Completion percentage for each infrastructure category — sewer extensions, force mains, interceptor sewers, pumping stations, and lift stations.
- Expansion Projects by Current Stage: Distribution of all projects across planning, design, procurement, construction, and commissioning.
- Major Risks (by Incident Count): Ranked risk categories including land acquisition delay, permit approval delay, contractor delay, utility relocation, and material shortage.
Frequently Asked Questions
1. Who is the Wastewater Collection Capital Network Expansion Dashboard designed for?
This dashboard is built for capital project managers, utility planners, and infrastructure directors at municipal water and wastewater authorities. It is most useful for teams overseeing multi-project network expansion programs that span multiple zones, contractors, and budget cycles.
2. Can this dashboard track both financial and operational performance?
Yes. The dashboard tracks financial metrics like capital budget utilization and spend-to-date alongside operational metrics like sewer network installation progress, completion rates by expansion type, and new household connections, supporting both financial oversight and delivery accountability.
3. How does the Major Risks chart support project decision-making?
The chart ranks risk incident categories by frequency, helping teams focus mitigation on the most common causes of delay. Whether the leading risk is land acquisition or permit approval, teams can coordinate with the right stakeholders before incidents compound.