
What is a Wastewater Collection SCADA Operations & Sensor Monitoring Dashboard?
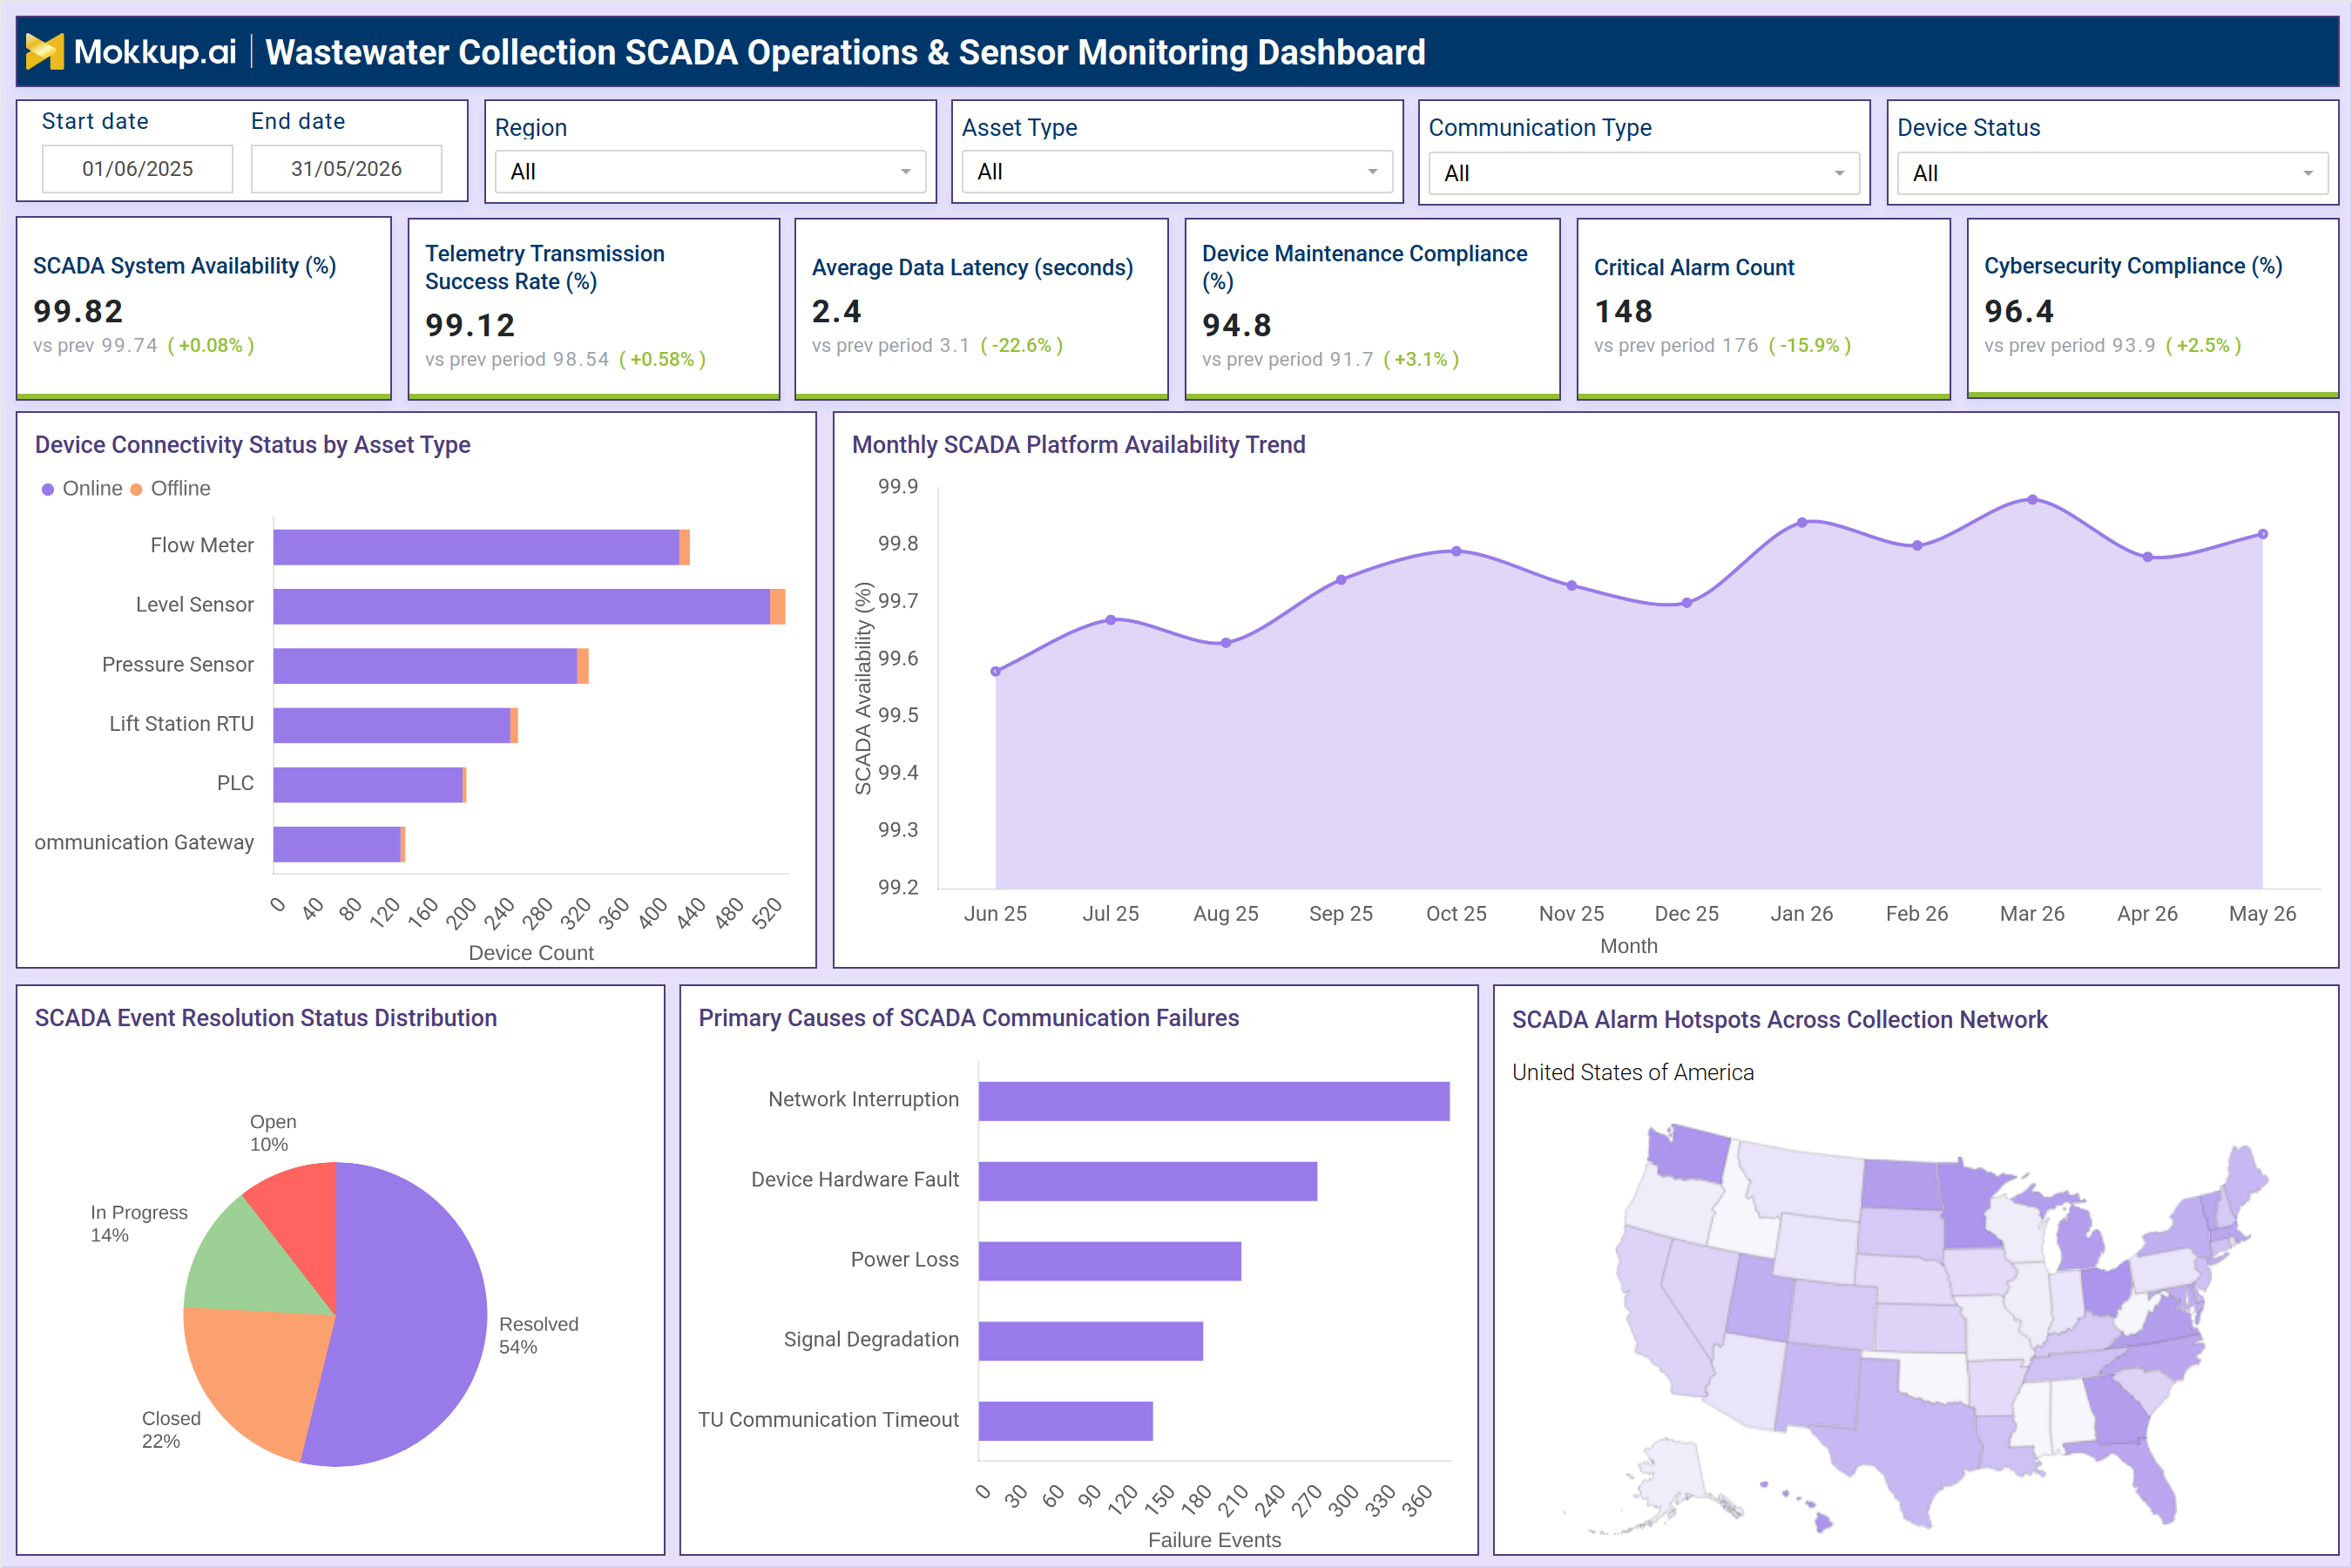
The Wastewater Collection SCADA Operations & Sensor Monitoring Dashboard is a purpose-built operations template designed for utility managers, SCADA engineers, and infrastructure teams responsible for monitoring distributed wastewater collection networks. It consolidates critical telemetry and system health data into a single structured view, making it straightforward to track sensor uptime, identify communication failures, and manage alarm resolution across the entire collection system. This wastewater SCADA monitoring dashboard surfaces key operational indicators such as system availability, telemetry transmission success, device maintenance compliance, and cybersecurity posture, all within one unified interface.
Filters for region, asset type, communication type, and device status allow teams to segment data and isolate issues without navigating across multiple tools or reports. Built on the Mokkup wireframing platform, this template supports the complete planning phase of dashboard development. Teams can use it to define KPI layout, chart structure, and filter logic before committing to a BI implementation, reducing back-and-forth between engineers and stakeholders and ensuring the final build reflects operational reality.
How to Create a Wastewater Collection SCADA Operations & Sensor Monitoring Dashboard
You don't need to build your report from scratch; just start with a ready-to-use dashboard template from Mokkup. Add in your data and export it however you like. Here's how to do it:
1. Create or Log in to Your Mokkup Account
Start by signing up on Mokkup.ai using your email. If you already have an account, just log in, and you'll be good to go.
2. Choose and Customize Your Dashboard Template
Find the Wastewater Collection SCADA Operations & Sensor Monitoring Dashboard template in the Templates section. Use the drag-and-drop editor to adjust KPIs, edit filters, or add elements based on your data.
3. Export to Your BI Tool
Once your dashboard wireframe is ready, use the BI Tool Export feature to send it directly to Power BI or Tableau for further analysis and enhancements. You can also download the dashboard as a PDF, PNG, or JPEG, embed it on a platform, or invite your team to collaborate.
Note: This is a Pro template. You'll need a Pro subscription on Mokkup to use and customize this dashboard wireframe. Upgrade anytime to unlock full access.
Wastewater Collection SCADA Operations & Sensor Monitoring Dashboard Example
A regional utility operations team uses this wastewater SCADA monitoring dashboard to begin each shift with a structured review of system health. The KPI strip at the top lets operators immediately identify whether SCADA system availability and telemetry transmission success rates are within acceptable thresholds and compare current performance against the prior period to detect any emerging degradation trends. From there, the team uses the Device Connectivity Status by Asset Type chart to compare online versus offline counts across flow meters, level sensors, pressure sensors, lift station RTUs, PLCs, and communication gateways. The SCADA device connectivity status dashboard view makes it easy to prioritize field interventions by asset class. If pressure sensors show an elevated offline count, maintenance crews can be dispatched before the issue escalates.
The Monthly SCADA Platform Availability Trend chart allows the operations manager to track platform reliability over a rolling 12-month window. By reviewing this alongside the Primary Causes of SCADA Communication Failures chart which breaks down events by network interruption, device hardware fault, power loss, signal degradation, and TU communication timeout the team can identify recurring root causes and adjust preventive maintenance schedules accordingly. This directly supports wastewater telemetry transmission tracking efforts across the collection network. Finally, the SCADA Alarm Hotspots Across Collection Network map gives geographic context to alarm density, helping planners prioritize infrastructure investments by region. The SCADA Event Resolution Status Distribution donut chart tracks whether open, in-progress, closed, and resolved alarms are being handled at an acceptable pace. Together, these views support effective SCADA alarm management dashboard workflows that keep resolution rates high and critical alarm counts low. The wastewater collection system performance metrics visible across all sections give leadership the data foundation needed for operational reporting and capital planning.
How to Analyze Data in a Wastewater Collection SCADA Operations & Sensor Monitoring Dashboard
Here is how you can analyze data from this dashboard:
- Use the KPI strip to track SCADA system availability, telemetry success, and cybersecurity compliance trends period over period.
- Filter by region and asset type to isolate connectivity issues within specific segments of the wastewater collection network.
- Analyze the Device Connectivity Status chart to compare online versus offline asset counts by device category.
- Review the Monthly SCADA Platform Availability Trend to identify recurring dips and correlate them with maintenance events.
- Use the Primary Causes of SCADA Communication Failures chart to prioritize root-cause investigations and corrective actions.
- Track alarm resolution pace via the Event Resolution Status Distribution to ensure open and in-progress events are being closed.
- Use the SCADA Alarm Hotspots map to identify geographic clusters and direct field resources to high-frequency problem areas.
- Monitor Average Data Latency and Device Maintenance Compliance to assess sensor health and data pipeline reliability.
- Apply the Communication Type and Device Status filters to drill into specific failure categories for SCADA sensor monitoring for the wastewater collection network.
Benefits of a Wastewater Collection SCADA Operations & Sensor Monitoring Dashboard
The following are the benefits of using this dashboard:
- Centralized Operational Visibility: Consolidate telemetry, alarms, and device health information into a single structured view, enabling faster and more informed operational decision-making.
- Reduced Diagnostic Time: Surface communication failure causes alongside system availability metrics to help operators quickly identify issues and accelerate troubleshooting efforts.
- Proactive Maintenance Planning: Support preventive maintenance scheduling through device-level connectivity tracking, health monitoring, and compliance status visibility.
- Geographic Prioritization of Field Operations: Utilize regional alarm hotspot maps to identify high-risk areas and prioritize field work based on operational impact and urgency.
- Improved Alarm Resolution Efficiency: Enhance incident management by providing clear visibility into alarm event statuses, allowing teams to focus on unresolved and critical issues.
- Standardized SCADA Reporting: Establish consistent KPI definitions, reporting logic, and filtering mechanisms across shifts and regions to improve reporting accuracy and comparability.
- Accelerated BI Implementation: Streamline business intelligence development by providing a validated wireframe that aligns engineering teams and stakeholders on requirements before implementation begins.
KPIs to Track in a Wastewater Collection SCADA Operations & Sensor Monitoring Dashboard
The following key KPIs can be tracked by using this dashboard:
- SCADA System Availability (%): Measures the percentage of time the SCADA platform is fully operational and accessible across the collection network.
- Telemetry Transmission Success Rate (%): Tracks the proportion of telemetry data packets successfully transmitted from field devices to the central SCADA system; central to wastewater telemetry transmission tracking.
- Average Data Latency (seconds): Measures the average delay between sensor data capture and its arrival in the SCADA platform, indicating pipeline health.
- Device Maintenance Compliance (%): Tracks the percentage of scheduled maintenance tasks completed on time across all connected field devices.
- Critical Alarm Count: The total number of high-priority alarms generated within the selected period; a core metric for SCADA alarm management dashboard workflows.
- Cybersecurity Compliance (%): Measures adherence to defined cybersecurity controls and protocols across the SCADA environment.
- Device Connectivity Status by Asset Type: Tracks online versus offline device counts segmented by asset class (Flow Meter, Level Sensor, Pressure Sensor, Lift Station RTU, PLC, Communication Gateway).
- Monthly SCADA Platform Availability Trend: A time-series view of platform uptime across a rolling 12-month window for trend analysis.
- SCADA Event Resolution Status Distribution: Tracks alarm events by status category: Open, In Progress, Closed, and Resolved.
- Primary Causes of SCADA Communication Failures: Categorizes communication failure events by root cause including network interruption, device hardware fault, power loss, signal degradation, and TU communication timeout.
- SCADA Alarm Hotspots Across Collection Network: A geographic map highlighting alarm density by region across the US wastewater infrastructure.
Frequently Asked Questions
1. Who should use this wastewater SCADA operations dashboard?
This dashboard is designed for SCADA engineers, utility operations managers, and infrastructure teams managing distributed wastewater collection networks. It is also useful for planning teams who need to define KPI structure and report layout before a full BI implementation.
2. Can this template be customized for different asset types or regions?
Yes. The template includes filters for asset type, region, communication type, and device status, making it adaptable to networks with different device configurations. In Mokkup, you can adjust KPI tiles, chart types, and filter options using the drag-and-drop editor to match your specific collection system.
3. What BI tools does this dashboard template support?
Once the wireframe is finalized in Mokkup, it can be exported directly to Power BI or Tableau using the BI Tool Export feature. It can also be downloaded as a PDF, PNG, or JPEG, or shared with team members for collaborative review before development begins.