
What is a Natural Gas Transmission SCADA & OT Cybersecurity Operations Dashboard?
The Natural Gas Transmission SCADA & OT Cybersecurity Operations Dashboard is a purpose-built analytics template for monitoring the security and operational health of natural gas pipeline infrastructure. It serves as a natural gas pipeline SCADA cybersecurity dashboard that consolidates SCADA uptime, telemetry integrity, alarm activity, and regulatory compliance into a single view. Pipeline operators, OT security teams, and compliance officers use it to track system availability across critical layers from SCADA platforms to remote field sites while maintaining visibility into active cyber threats targeting operational technology environments. The dashboard covers the full scope of pipeline cybersecurity operations, from alarm flood event monitoring to TSA and CIRP compliance scoring, giving decision-makers the data they need to act quickly and stay audit-ready.
How to Create a Natural Gas Transmission SCADA & OT Cybersecurity Operations Dashboard?
You don't need to build your report from scratch; just start with a ready-to-use dashboard template from Mokkup. Add in your data and export it however you like. Here's how to do it:
1. Create or Log in to Your Mokkup Account
Start by signing up on Mokkup.ai using your email. If you already have an account, just log in, and you'll be good to go.
2. Choose and Customize Your Dashboard Template
Find the Natural Gas Transmission SCADA & OT Cybersecurity Operations Dashboard template in the Templates section. Use the drag-and-drop editor to adjust KPIs, edit filters, or add elements based on your data.
3. Export to Your BI Tool
Once your dashboard wireframe is ready, use the BI Tool Export feature to send it directly to Power BI or Tableau for further analysis and enhancements. You can also download the dashboard as a PDF, PNG, or JPEG, embed it on a platform, or invite your team to collaborate.
Note: This is a Pro template. You'll need a Pro subscription on Mokkup to use and customize this dashboard wireframe. Upgrade anytime to unlock full access.
Natural Gas Transmission SCADA & OT Cybersecurity Operations Dashboard Example
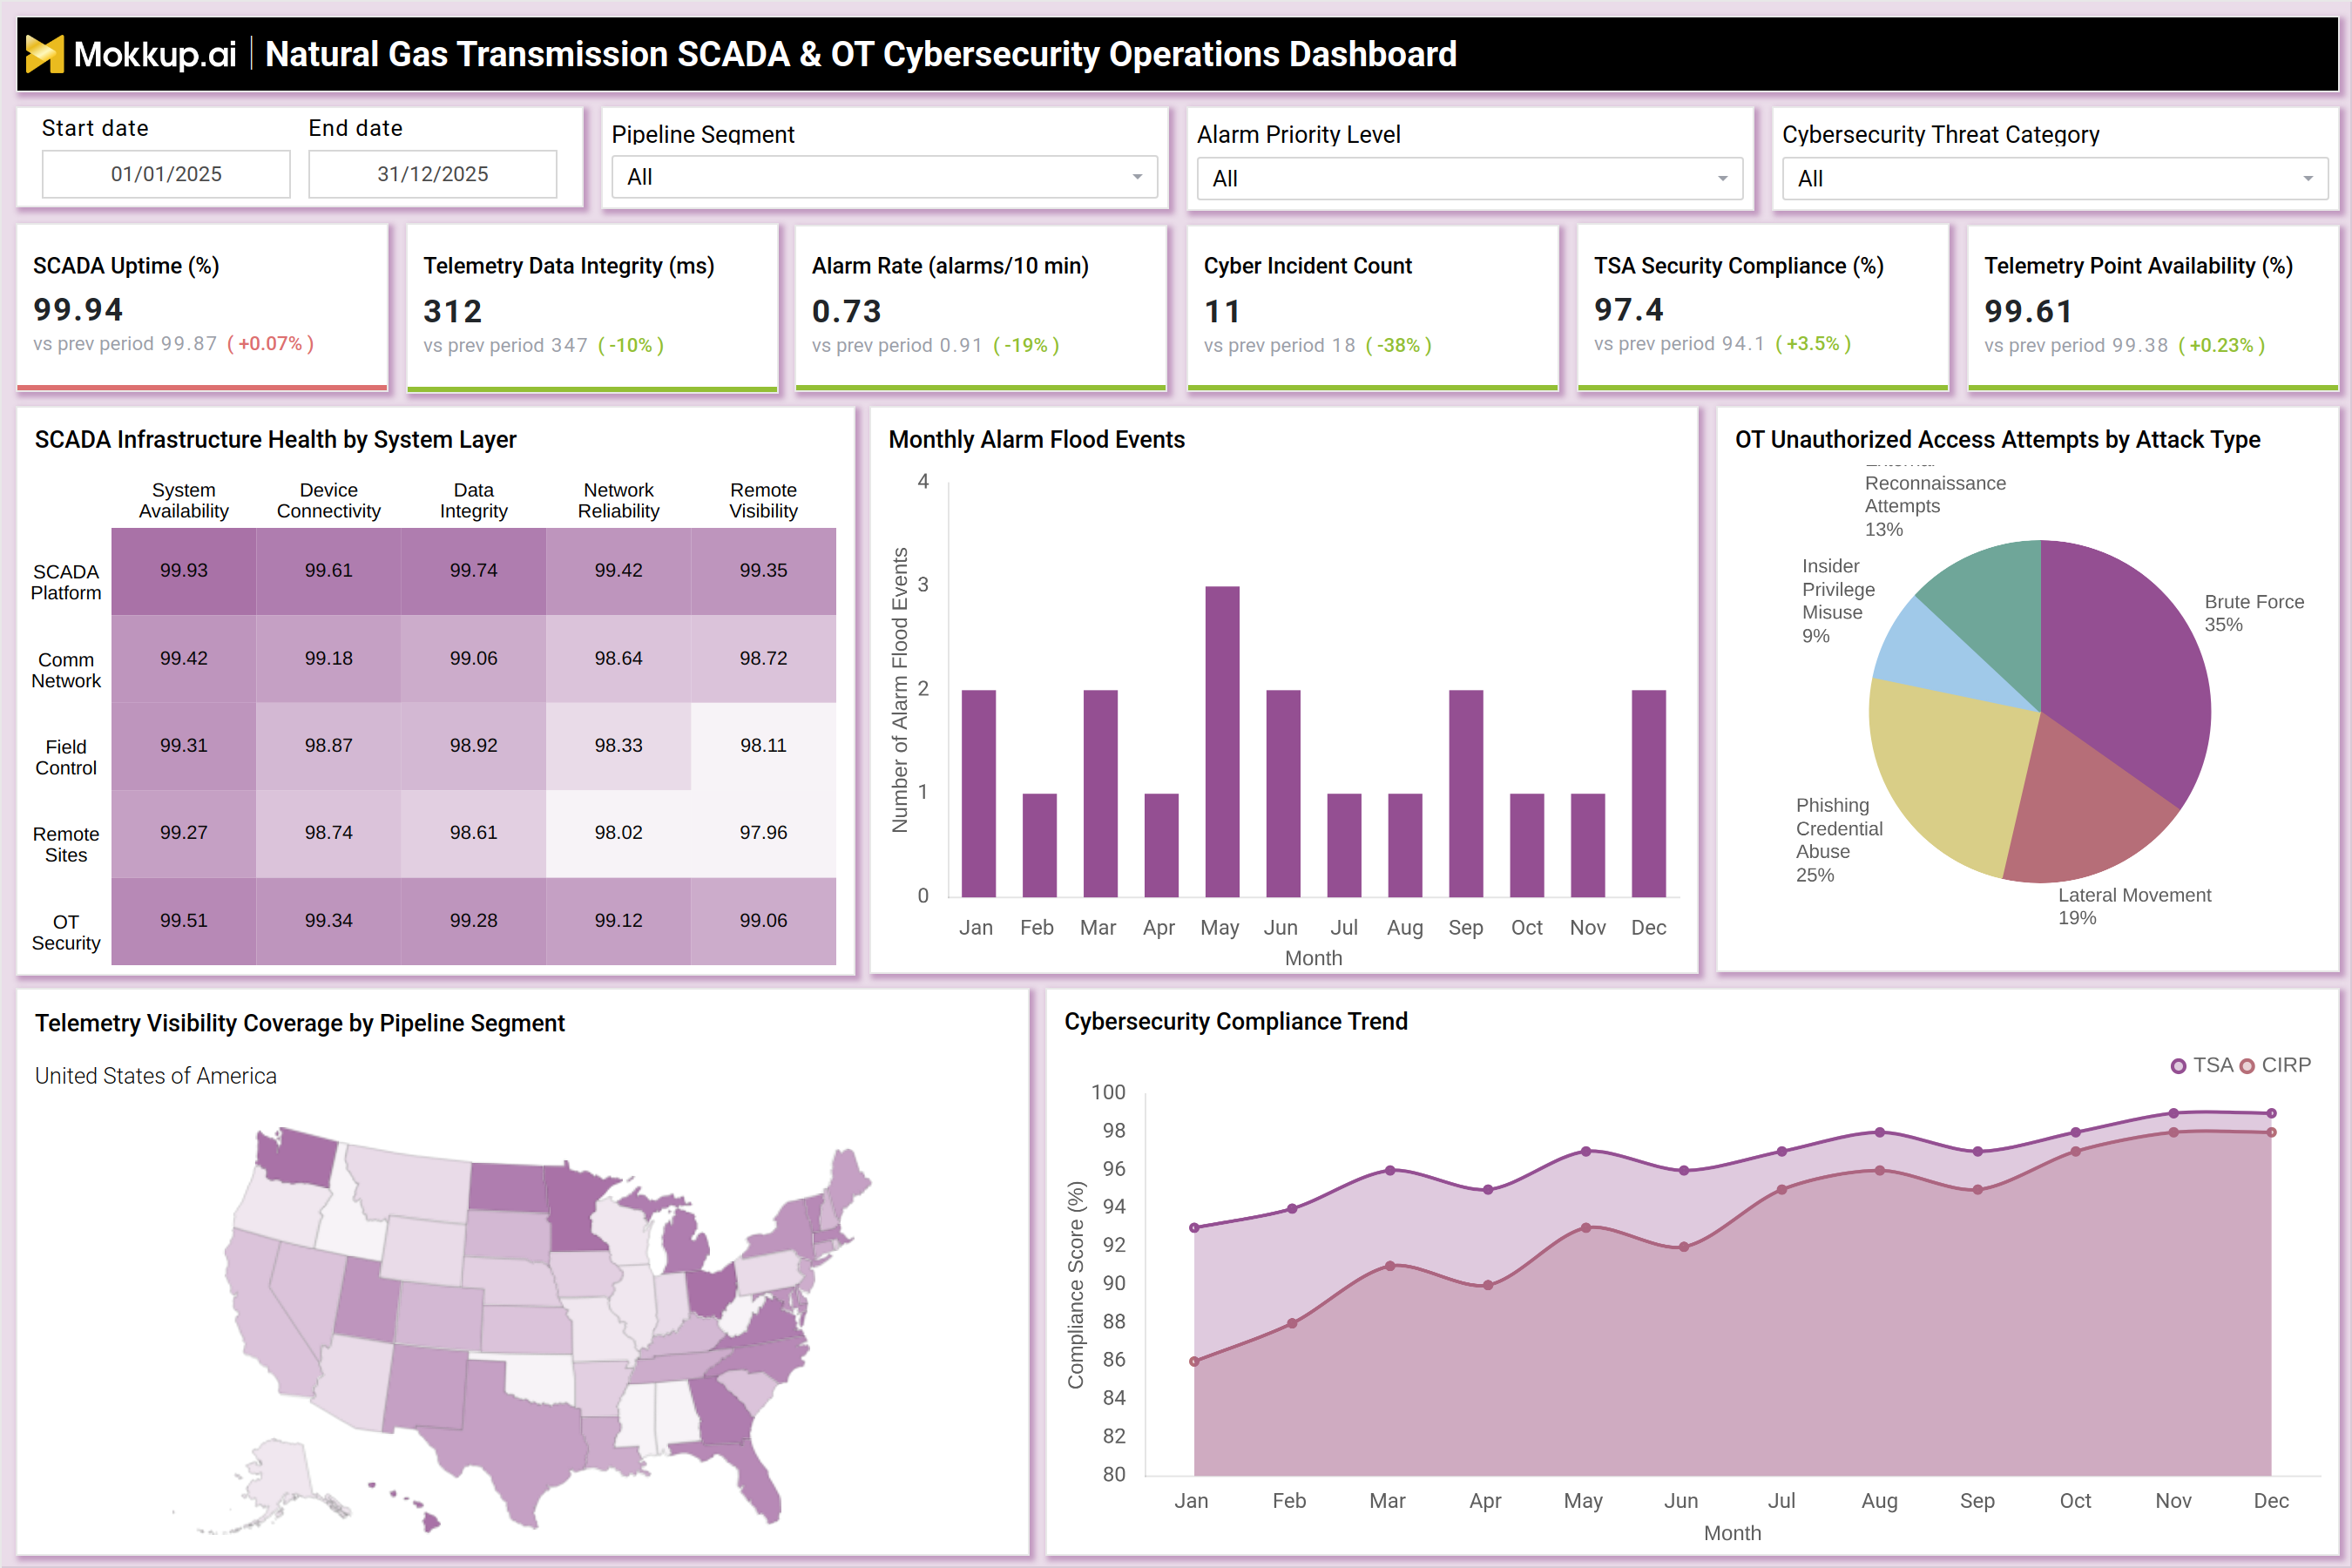
The dashboard opens with six KPI tiles across the top row, giving operators an immediate pulse on system health: SCADA Uptime, Telemetry Data Integrity, Alarm Rate, Cyber Incident Count, TSA Security Compliance, and Telemetry Point Availability. Each tile shows the current period value alongside a comparison to the previous period, making trend detection immediate without drilling down. Below the KPIs, the SCADA Infrastructure Health by System Layer table breaks down performance across five system layers: SCADA Platform, Comm Network, Field Control, Remote Sites, and OT Security against five dimensions: System Availability, Device Connectivity, Data Integrity, Network Reliability, and Remote Visibility.
This functions as an OT security monitoring dashboard for pipeline operations, letting teams isolate which layer or segment is underperforming. The Monthly Alarm Flood Events bar chart maps alarm activity across each calendar month, surfacing seasonal or operational spikes. The OT Unauthorized Access Attempts by Attack Type pie chart categorizes threat vectors — Brute Force, Phishing Credential Abuse, Lateral Movement, Reconnaissance Attempts, and Insider Privilege Misuse — enabling security teams to prioritize response resources based on the most frequent attack patterns. The Telemetry Visibility Coverage by Pipeline Segment map visualizes geographic coverage across the United States, helping operators identify segments with weaker telemetry coverage. The Cybersecurity Compliance Trend line chart tracks TSA and CIRP compliance scores month over month, giving compliance teams a clear trajectory for audit preparation.
How to Analyze Data in a Natural Gas Transmission SCADA & OT Cybersecurity Operations Dashboard
Here is how you can analyze data from this dashboard:
- Use the Pipeline Segment / Zone filter to isolate performance and threat data for specific sections of the transmission network
- Use the Alarm Priority Level filter to focus on high-severity alarms and reduce noise from low-priority events
- Use the Cybersecurity Threat Category filter to narrow the OT security monitoring dashboard for pipeline operations to a specific threat vector
- Review the SCADA Infrastructure Health table to identify which system layer — SCADA Platform, Comm Network, Field Control, Remote Sites, or OT Security — shows the weakest scores across connectivity and reliability dimensions
- Monitor the Monthly Alarm Flood Events bar chart to detect months with abnormal alarm spikes, which can indicate configuration drift or active attack campaigns
- Use the telemetry visibility coverage pipeline segment dashboard map to find geographic gaps in sensor coverage that require field intervention
- Review the Cybersecurity Compliance Trend line chart to track whether TSA and CIRP scores are trending upward ahead of scheduled audits
- Cross-reference Cyber Incident Count with the OT Unauthorized Access Attempts pie chart to understand whether incidents are concentrated in a specific attack type
Benefits of a Natural Gas Transmission SCADA & OT Cybersecurity Operations Dashboard
The following are the benefits of using this dashboard:
- Provides a unified view of both operational health and cybersecurity posture in a single dashboard, removing the need to switch between separate tools
- Supports TSA cybersecurity compliance dashboard oil and gas requirements by tracking TSA and CIRP scores continuously, not just at audit time
- The cybersecurity compliance trend dashboard for natural gas operators gives compliance teams early warning when scores start declining, enabling proactive remediation
- Speeds up incident investigation by correlating alarm data, access attempt patterns, and infrastructure health in one view
- Geographic telemetry coverage mapping helps pipeline network managers prioritize field maintenance and sensor deployment
- Reduces mean time to detect (MTTD) by surfacing alarm flood events and unauthorized access attempts in structured, filterable charts
- Supports cross-functional use across OT security, field operations, and regulatory compliance teams from a single data source
KPIs to Track in a Natural Gas Transmission SCADA & OT Cybersecurity Operations Dashboard
The following key KPIs can be tracked by using this dashboard:
- SCADA Uptime (%) – Percentage of time the SCADA system remains operational across pipeline control infrastructure
- Telemetry Data Integrity (ms) – Measures latency or data reliability across telemetry communication networks
- Alarm Rate (alarms/10 min) – Number of SCADA alarms generated within operational monitoring intervals
- Cyber Incident Count – Total number of cybersecurity incidents detected across OT environments
- TSA Security Compliance (%) – Compliance score against TSA cybersecurity standards for pipeline operators
- Telemetry Point Availability (%) – Percentage of telemetry devices successfully reporting data to the SCADA system
- SCADA Infrastructure Health by System Layer – Health metrics across platform availability, connectivity, data integrity, and network reliability
- Monthly Alarm Flood Events – Number of alarm flooding incidents detected within the monitoring period
- OT Unauthorized Access Attempts by Attack Type – Distribution of detected cyber intrusion attempts by attack method
- Telemetry Visibility Coverage by Pipeline Segment – Geographic monitoring coverage of telemetry infrastructure
- Cybersecurity Compliance Trend – Monthly trend showing improvements or changes in cybersecurity compliance score
Frequently Asked Questions
1. Who should use the Natural Gas Transmission SCADA & OT Cybersecurity Operations Dashboard?
This dashboard is designed for OT security engineers, pipeline operations managers, SCADA administrators, and TSA compliance officers working in natural gas transmission. It is also useful for CISOs and operations directors who need consolidated visibility into both infrastructure performance and cybersecurity posture.
2. Can this dashboard help with TSA cybersecurity directive compliance?
Yes. The dashboard tracks TSA Security Compliance (%) as a dedicated KPI and includes the Cybersecurity Compliance Trend line chart that monitors TSA and CIRP scores across the calendar year. This makes it straightforward to demonstrate compliance trajectory during audits or regulatory reviews.
3. What types of cyber threats are tracked in this dashboard?
The OT Unauthorized Access Attempts by Attack Type pie chart categorizes threats into five vectors: Brute Force, Phishing Credential Abuse, Lateral Movement, Reconnaissance Attempts, and Insider Privilege Misuse. This breakdown enables security teams to direct remediation efforts toward the most prevalent attack patterns in their environment.
4. What KPIs does the Natural Gas Transmission SCADA & OT Cybersecurity Operations Dashboard track?
The dashboard tracks six primary KPIs: SCADA Uptime (%), Telemetry Data Integrity (ms), Alarm Rate (alarms/10 min), Cyber Incident Count, TSA Security Compliance (%), and Telemetry Point Availability (%). It also includes deeper metrics like SCADA Infrastructure Health by System Layer, Monthly Alarm Flood Events, OT Unauthorized Access Attempts by Attack Type, and the Cybersecurity Compliance Trend.
5. How does the telemetry coverage map work in this dashboard?
The Telemetry Visibility Coverage by Pipeline Segment map visualizes geographic monitoring coverage across the United States. It helps pipeline operators quickly identify segments with weaker telemetry coverage, enabling prioritization of field maintenance and sensor deployment to close coverage gaps.