
What is a Wastewater Collection Regulatory Compliance Dashboard?
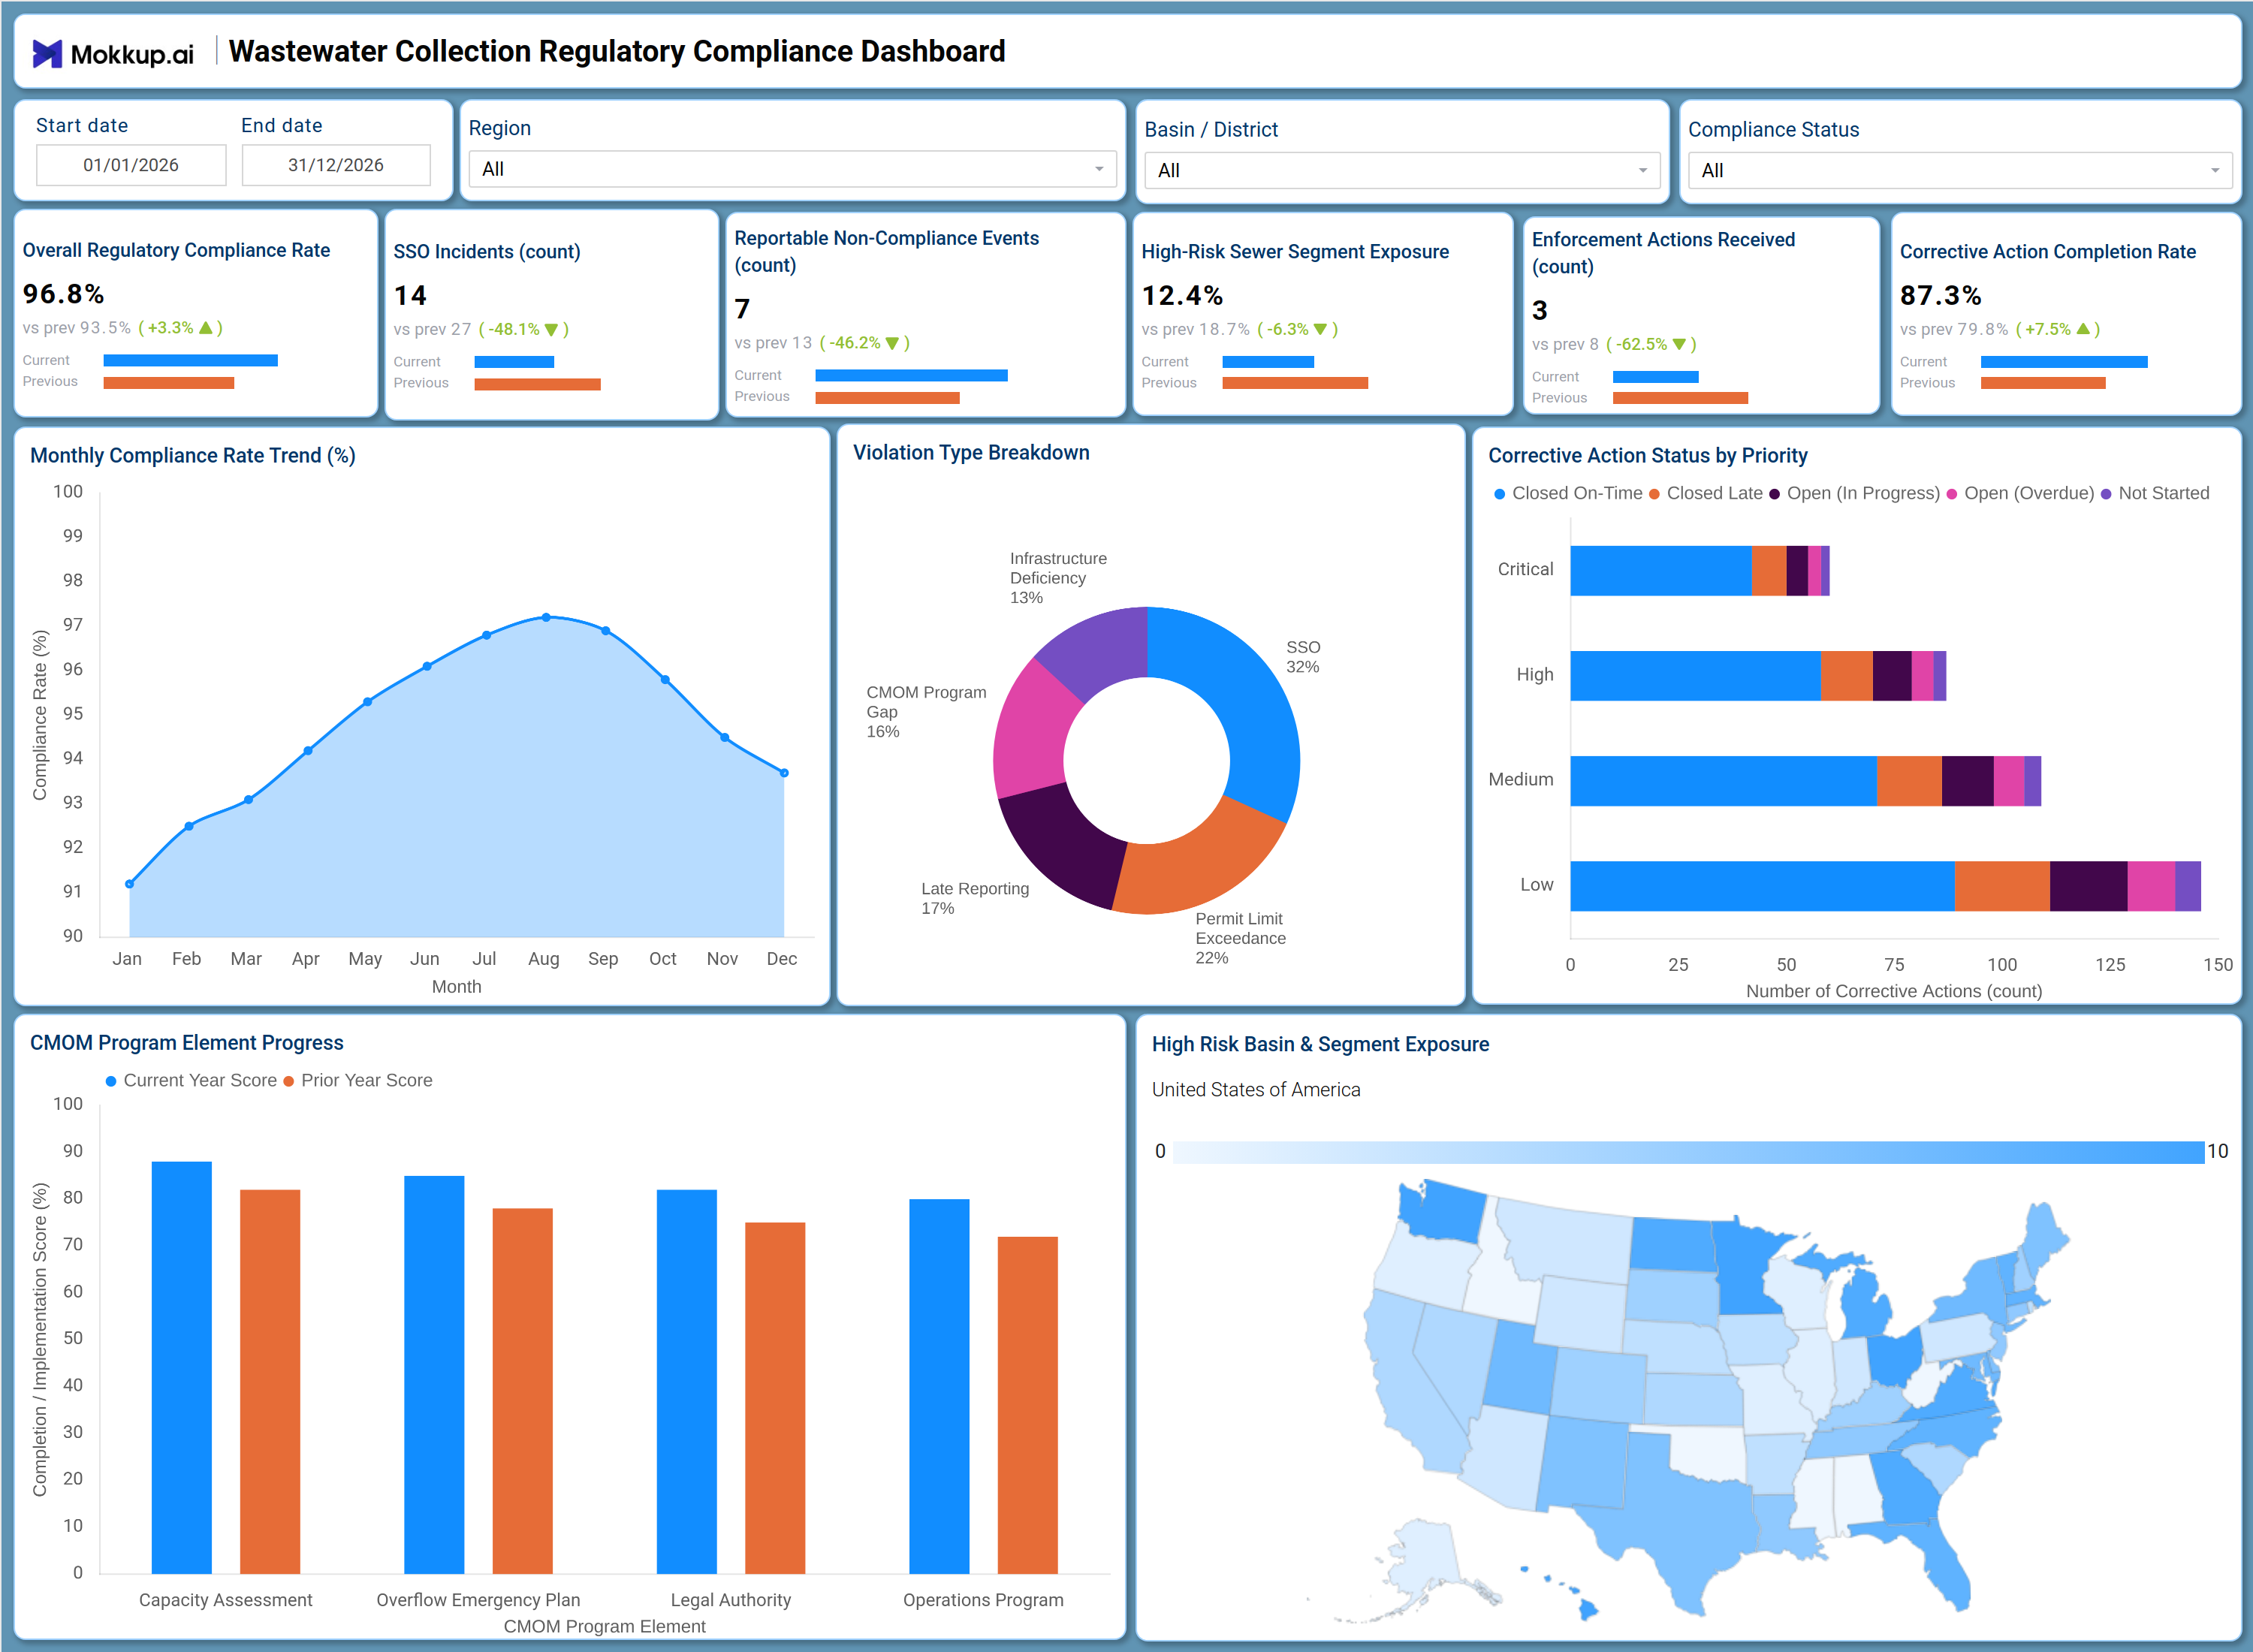
The Wastewater Collection Regulatory Compliance Dashboard is a structured analytical template designed for utility managers, environmental compliance officers, and municipal wastewater teams who need a consolidated view of their regulatory standing. This wastewater collection regulatory compliance dashboard brings together critical performance metrics across sanitary sewer overflow incidents, permit adherence, enforcement activity, and corrective action progress into a single, navigable workspace. Teams operating under EPA and state environmental mandates use it to track compliance rates, identify emerging risks across collection system segments, and manage wastewater compliance violation type breakdown data without juggling multiple spreadsheets or fragmented reports. By organizing KPIs, trend charts, and geographic exposure maps in one place, this dashboard enables faster decisions and clearer accountability across regulatory cycles.
How to Create a Wastewater Collection Regulatory Compliance Dashboard
You don’t need to build your report from scratch; just start with a ready-to-use dashboard template from Mokkup. Add in your data and export it however you like. Here’s how to do it:
1. Create or Log in to Your Mokkup Account
Start by signing up on Mokkup.ai using your email. If you already have an account, just log in, and you'll be good to go.
2. Choose and Customize Your Dashboard Template
Find the Wastewater Collection Regulatory Compliance Dashboard template in the Templates section. Use the drag-and-drop editor to adjust KPIs, edit filters, or add elements based on your data.
3. Export to Your BI Tool
Once your dashboard wireframe is ready, use the BI Tool Export feature to send it directly to Power BI or Tableau for further analysis and enhancements. You can also download the dashboard as a PDF, PNG, or JPEG, embed it on a platform, or invite your team to collaborate.
Note: This is a Pro template. You'll need a Pro subscription on Mokkup to use and customize this dashboard wireframe. Upgrade anytime to unlock full access.
Wastewater Collection Regulatory Compliance Dashboard Example
A compliance manager at a regional wastewater authority opens this dashboard at the start of a reporting cycle to assess whether the collection system is on track with permit obligations. The overview KPIs surface the overall regulatory compliance rate alongside SSO incidents tracking wastewater management activity, giving the team an immediate read on whether corrective actions taken in prior months are translating into fewer overflows and fewer enforcement actions. As they move deeper into the dashboard, teams can examine the Monthly Compliance Rate Trend to determine whether performance is holding steady or declining ahead of a state audit. The Violation Type Breakdown donut chart lets managers identify which category -Infrastructure Deficiency, CMOM Program Element, Late Reporting, or Permit Limit Exceedances -- is driving the most non-compliance events, so resources can be directed at the root cause rather than symptoms.
The CMOM program element compliance monitoring section of the dashboard is particularly valuable for utilities undergoing consent decree requirements. Planners can compare current-year scores against prior-year scores across elements such as Capacity Assessment, Overflow Emergency Plan, and Legal Authority, making it straightforward to quantify improvement or flag stagnation before a regulatory review. Across all views, the High Risk Basin and Segment Exposure map allows regional supervisors to prioritize field resources geographically. Combined with the Corrective Action Status by Priority stacked bar chart, teams can track which open items are overdue and ensure that corrective action completion rate wastewater targets are being met before deadlines pass.
How to Analyze Data in a Wastewater Collection Regulatory Compliance Dashboard
Here is how you can analyze data from this dashboard:
- Use the Region filter to isolate compliance performance for specific service areas and compare outcomes across districts.
- Monitor the Monthly Compliance Rate Trend line chart to detect seasonal dips in performance before they trigger enforcement activity.
- Review the Violation Type Breakdown donut chart to prioritize response efforts toward the highest-frequency wastewater compliance violation type breakdown categories.
- Filter by Compliance Status to focus the dashboard on facilities or segments that are currently out of compliance.
- Analyze the CMOM Program Element Progress grouped bar chart to assess year-over-year improvement across each program requirement.
- Use the Corrective Action Status by Priority chart to identify overdue items at the Critical and High priority levels requiring immediate escalation.
- Filter by Basin / District to align the High Risk Basin and Segment Exposure map with specific watershed management responsibilities.
- Track SSO Incidents count alongside Enforcement Actions Received to assess whether incident response is preventing regulatory escalation.
Benefits of a Wastewater Collection Regulatory Compliance Dashboard
The following are the benefits of using this dashboard:
- Centralizes regulatory KPIs - compliance rate, SSO incidents, enforcement actions, and corrective action completion -- in one structured template.
- Supports SSO incidents tracking wastewater management across multiple basins and districts with filter-driven isolation.
- Reduces manual data compilation for regulatory reporting with pre-built KPI tiles, trend charts, and a geographic exposure map.
- Enables basin-level high-risk sewer segment exposure analysis to guide infrastructure prioritization decisions.
- Provides a violation-type breakdown of non-compliance events, helping utilities allocate remediation resources more precisely.
- Helps compliance officers align with CMOM program requirements and permit conditions without rebuilding reports from scratch.
- Gives field supervisors and regulatory managers a shared view of corrective action status and outstanding obligations.
KPIs to Track in a Wastewater Collection Regulatory Compliance Dashboard
The following key KPIs can be tracked by using this dashboard:
- Overall Regulatory Compliance Rate (%): Core metric for any wastewater collection regulatory compliance dashboard -- measures the percentage of regulatory requirements met across the collection system during the reporting period.
- SSO Incidents (count): Tracks the number of sanitary sewer overflow events recorded; SSO incidents tracking wastewater management is essential for permit compliance and public health reporting.
- Reportable Non-Compliance Events (count): Counts violations that must be formally reported to regulatory authorities, quantifying the scale of CMOM program element compliance monitoring exposure.
- High-Risk Sewer Segment Exposure: Measures the number of collection system segments classified as high-risk, key to high-risk sewer segment exposure analysis for capital planning.
- Enforcement Actions Received (count): Tracks formal regulatory actions issued against the utility, a direct indicator of compliance posture and audit readiness.
- Corrective Action Completion Rate (%): Evaluates the share of required corrective actions closed within deadlines, central to corrective action completion rate wastewater performance management and consent decree adherence.
Frequently Asked Questions
1. What industries benefit most from this Wastewater Collection Regulatory Compliance Dashboard?
Municipal wastewater utilities, regional sanitation authorities, and environmental compliance teams operating under EPA or state permit frameworks benefit most. It is also suited for engineering consultants supporting consent decree management.
2. Can this dashboard track CMOM program element performance over time?
Yes. The CMOM Program Element Progress chart compares current-year compliance scores against prior-year scores across elements including Capacity Assessment, Overflow Emergency Plan, and Legal Authority, making year-over-year progress measurable.
3. Is this dashboard suitable for managing sanitary sewer overflow reporting obligations?
Yes. The SSO Incidents KPI tile and the Violation Type Breakdown chart together provide the data structure needed to track, categorize, and report overflow events in line with permit and regulatory requirements.