
What is a Wastewater Collection Pump & Lift Station Asset Health Dashboard?
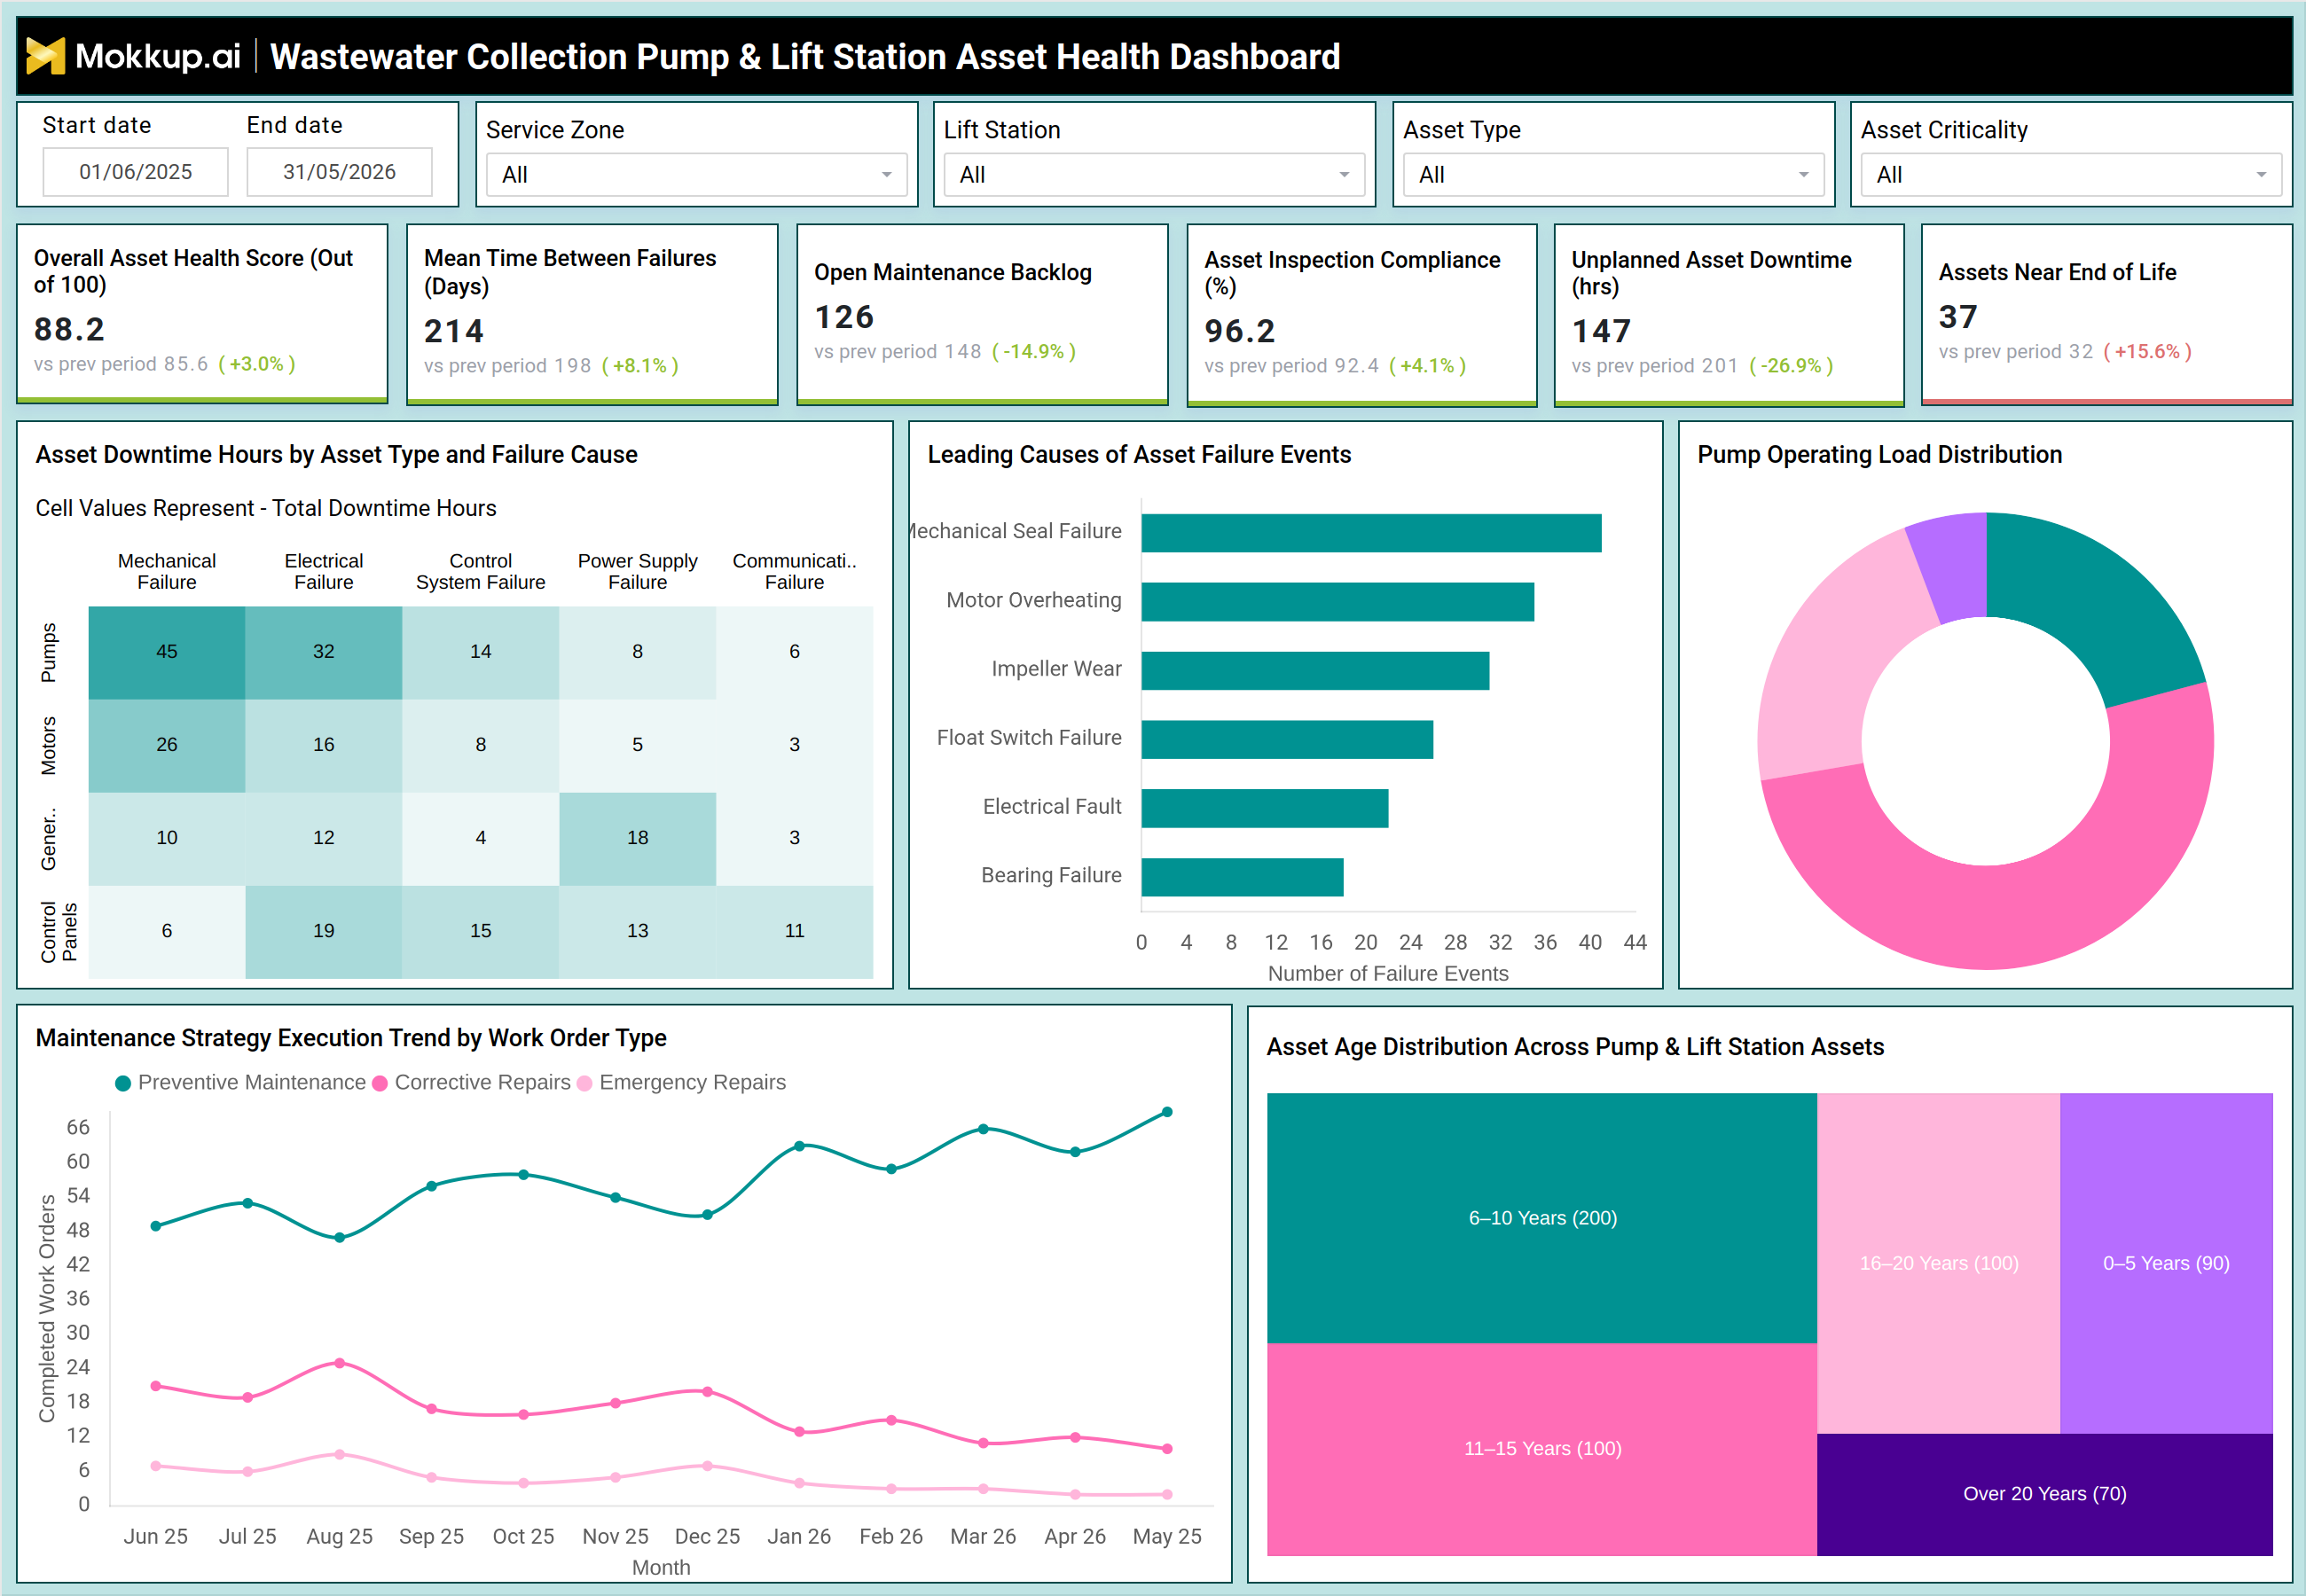
The Wastewater Collection Pump & Lift Station Asset Health Dashboard is a structured analytics tool built for utility operations and maintenance teams managing pump infrastructure across wastewater collection networks. It brings together equipment performance data, maintenance history, and failure analysis into a single view, giving asset managers and reliability engineers the visibility they need to act before failures escalate. This wastewater pump station asset health monitoring dashboard tracks six core operational KPIs alongside detailed charts that reveal where downtime is accumulating, which failure causes are most frequent, and how assets are distributed across age bands. Designed for utilities managing mixed-age pump fleets, the dashboard functions as a lift station maintenance tracking and failure analysis tool that surfaces patterns across pumps, motors, and control panels. With filters for service zone, lift station, asset type, and asset criticality, teams can isolate performance issues at any level of the network and use wastewater collection system preventive maintenance KPIs to compare how well scheduled maintenance is keeping pace with emergency repairs.
How to Create a Wastewater Collection Pump & Lift Station Asset Health Dashboard
You don't need to build your report from scratch; just start with a ready-to-use dashboard template from Mokkup. Add in your data and export it however you like. Here's how to do it:
1. Create or Log in to Your Mokkup Account
Start by signing up on Mokkup.ai using your email. If you already have an account, just log in, and you'll be good to go.
2. Choose and Customize Your Dashboard Template
Find the Wastewater Collection Pump & Lift Station Asset Health Dashboard template in the Templates section. Use the drag-and-drop editor to adjust KPIs, edit filters, or add elements based on your data.
3. Export to Your BI Tool
Once your dashboard wireframe is ready, use the BI Tool Export feature to send it directly to Power BI or Tableau for further analysis and enhancements. You can also download the dashboard as a PDF, PNG, or JPEG, embed it on a platform, or invite your team to collaborate.
Note: This is a Pro template. You'll need a Pro subscription on Mokkup to use and customize this dashboard wireframe. Upgrade anytime to unlock full access.
Wastewater Collection Pump & Lift Station Asset Health Dashboard Example
Operations managers typically open this dashboard when they need a status read on the pump network before planning the week's maintenance workload. The KPI row shows whether overall asset health is trending up or down, how many maintenance tasks remain open, and whether inspection schedules are being met, enough to determine whether the situation requires urgent intervention or is holding within normal parameters. From the downtime matrix, maintenance planners can identify which combination of asset type and failure cause is generating the most lost operating hours. When a failure cause like mechanical seal failure or motor overheating appears repeatedly, teams can investigate whether an aging asset cluster or an operating condition is driving it.
The pump operating load distribution supports pump downtime reduction for wastewater operations teams by flagging which assets run consistently in high-stress load zones, so maintenance can be scheduled before failure occurs. For capital planning, the asset age distribution gives teams a clear picture of which portions of the fleet are approaching end-of-life. Combined with the maintenance trend line, this supports wastewater infrastructure asset lifecycle management by showing whether preventive work orders are holding steady or being crowded out by corrective and emergency repairs, a leading signal that the fleet's condition is eroding faster than current investment levels can address.
How to Analyze Data in a Wastewater Collection Pump & Lift Station Asset Health Dashboard
Here is how you can analyze data from this dashboard:
- Filter by Service Zone or Lift Station to isolate network segments with elevated downtime or open maintenance backlog.
- Use the Asset Downtime Hours matrix to identify which asset type and failure cause combination accounts for the most lost hours.
- Review Leading Causes of Asset Failure Events to prioritize which failure modes need dedicated maintenance programs.
- Monitor the Maintenance Strategy Execution Trend to confirm preventive work orders are outpacing emergency repairs.
- Use the Pump Operating Load Distribution to flag assets running in overloaded or high-load zones before failure occurs.
- Check Assets Near End of Life count to plan capital replacement timelines and reduce reactive failures.
- Cross-reference Unplanned Downtime with Asset Inspection Compliance to assess whether scheduled inspections are preventing operational stoppages.
Benefits of a Wastewater Collection Pump & Lift Station Asset Health Dashboard
The following are the benefits of using this dashboard:
- Consolidates equipment health, failure history, and maintenance activity into one filterable view for operations teams.
- Reduces unplanned outages by revealing failure patterns before they cascade across the pump network.
- Supports pump and lift station inspection compliance dashboard requirements by tracking compliance rates across the full fleet.
- Helps maintenance planners shift from reactive emergency repairs to scheduled preventive maintenance cycles.
- Identifies assets operating in high-load zones, enabling targeted servicing before equipment failure.
- Provides asset age distribution data that supports evidence-based capital replacement planning.
- Tracks wastewater infrastructure asset lifecycle management across the full fleet, not just individual assets.
KPIs to Track in a Wastewater Collection Pump & Lift Station Asset Health Dashboard
The following key KPIs can be tracked by using this dashboard:
- Overall Asset Health Score: Composite index rating the operational condition of all monitored assets on a scale of 0–100.
- Mean Time Between Failures (Days): Average days assets operate without failure, measuring fleet-wide reliability.
- Open Maintenance Backlog: Total open work orders that have been raised but not yet completed.
- Asset Inspection Compliance (%): Percentage of scheduled inspections completed on time across the pump and lift station fleet.
- Unplanned Asset Downtime (hrs): Total hours of unplanned operational stoppage across all pump and lift station assets.
- Assets Near End of Life: Count of assets approaching or exceeding their expected useful service life, flagging replacement priorities.
Frequently Asked Questions
1. What is the Wastewater Collection Pump & Lift Station Asset Health Dashboard used for?
It is used by utility operations and maintenance teams to monitor pump and lift station performance, track inspection compliance, and identify failure causes before they result in extended outages. It supports both daily operational decisions and long-term capital planning.
2. How does the dashboard support maintenance planning?
The Maintenance Strategy Execution Trend shows how preventive, corrective, and emergency work orders are trending over time. When preventive maintenance declines relative to emergency repairs, planners can identify which asset segments are driving reactive work and adjust resource allocation accordingly.
3. Can this dashboard be used to demonstrate regulatory compliance?
Yes. The Asset Inspection Compliance KPI tracks whether scheduled inspections are completed on time, which is a standard requirement in utility compliance frameworks. Teams can use this metric alongside downtime and failure data to build evidence-based compliance reports.