
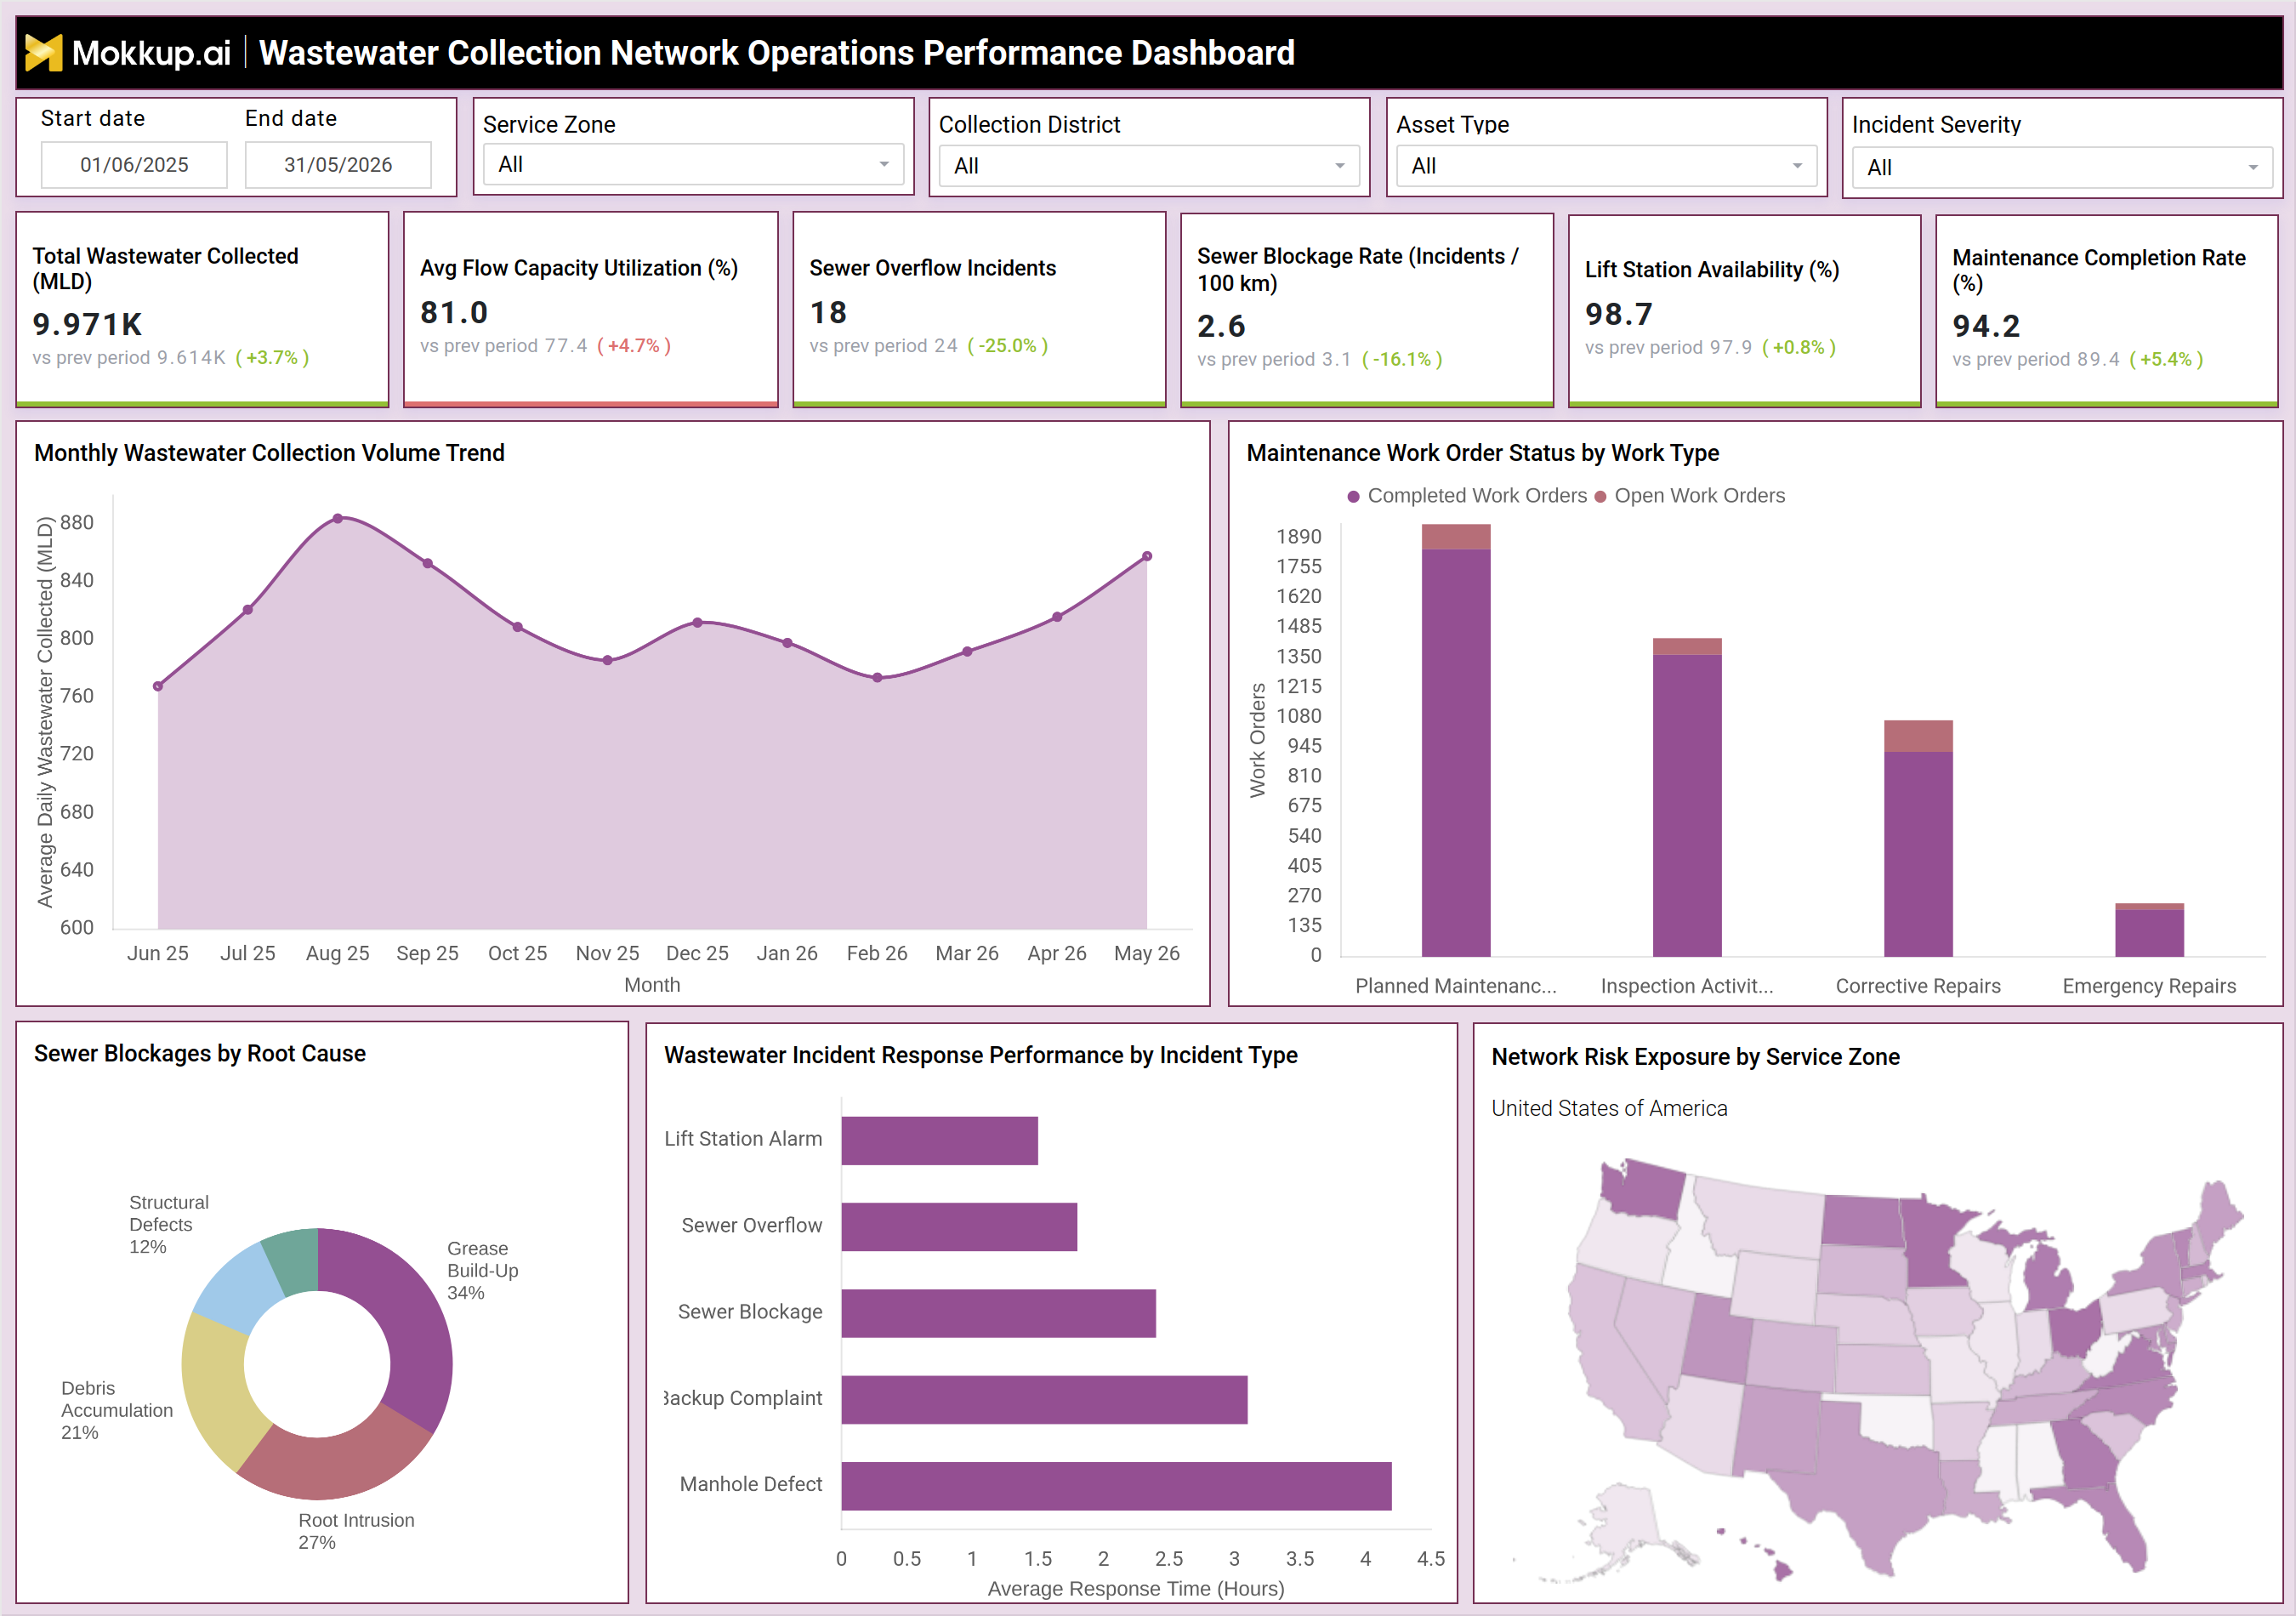
What is a Wastewater Collection Network Operations Performance Dashboard?
A wastewater collection network operations performance dashboard is a centralized monitoring tool used by wastewater utilities to track collection network efficiency, sewer system performance, maintenance activities, asset availability, and operational reliability. The dashboard combines key operational metrics such as wastewater collection volumes, flow capacity utilization, sewer overflow incidents, blockage rates, lift station availability, and maintenance completion rates into a single view. As a wastewater collection system performance monitoring dashboard, it helps utility operators identify network bottlenecks, monitor asset health, reduce service disruptions, and improve collection system reliability. The dashboard also supports proactive maintenance planning and operational decision-making by providing visibility into network performance and infrastructure conditions.
How to Create a Wastewater Collection Network Operations Performance Dashboard
You don't need to build your report from scratch, just start with a ready-to-use dashboard template from Mokkup. Add in your data and export it however you like. Here's how to do it:
1. Create or Log in to Your Mokkup Account
Start by signing up on Mokkup.ai using your email. If you already have an account, just log in, and you'll be good to go.
2. Choose and Customize Your Dashboard Template
Find the Wastewater Collection Network Operations Performance Dashboard template in the Templates section. Use the drag-and-drop editor to adjust KPIs, edit filters, or add elements based on your data.
3. Export to Your BI Tool
Once your dashboard wireframe is ready, use the BI Tool Export feature to send it directly to Power BI or Tableau for further analysis and enhancements. You can also download the dashboard as a PDF, PNG, or JPEG, embed it on a platform, or invite your team to collaborate.
Note: This is a Pro template. You'll need a Pro subscription on Mokkup to use and customize this dashboard wireframe. Upgrade anytime to unlock full access.
Wastewater Collection Network Operations Performance Dashboard Example
A municipal wastewater utility responsible for managing multiple collection districts can use this wastewater collection network operations performance dashboard to monitor network operations across service zones. Operations teams can track total wastewater collected, evaluate flow capacity utilization, monitor sewer overflow incidents, and analyze blockage rates. Maintenance managers can review work order completion status, identify recurring blockage causes, and assess incident response performance. The dashboard also supports wastewater network operational efficiency analytics by helping utilities understand maintenance workloads, evaluate lift station performance, and prioritize infrastructure improvements. Geographic risk analysis further enables teams to identify service zones with elevated operational risks and allocate resources more effectively.
How to Analyze Data in Wastewater Collection Network Operations Performance Dashboard
Here is how you can analyze data from this sewer collection network performance KPI dashboard:
- Total Wastewater Collected: Monitor wastewater collection volumes to understand demand patterns, track system usage, and identify long-term collection trends.
- Average Flow Capacity Utilization: Measure network loading levels to assess infrastructure performance, identify capacity constraints, and support future planning.
- Sewer Overflow Incidents: Track overflow events to evaluate operational reliability, reduce environmental risks, and improve system resilience.
- Sewer Blockage Rates: Analyze blockage frequency to monitor collection system health and identify recurring maintenance issues.
- Lift Station Availability: Measure lift station uptime to ensure continuous wastewater transport and minimize service disruptions.
- Maintenance Completion Rates: Review completed maintenance activities to assess workforce effectiveness, improve asset reliability, and reduce backlog.
- Wastewater Collection Volume Trends: Analyze monthly collection patterns to identify seasonal variations, forecast demand, and support operational planning.
- Completed vs. Open Work Orders: Compare maintenance work orders by type to evaluate workload distribution, resource allocation, and maintenance performance.
- Root Cause Analysis of Sewer Blockages: Investigate factors such as grease accumulation, root intrusion, and debris build-up to prevent recurring system failures.
- Incident Response Times: Monitor response times across different wastewater events to improve service efficiency and ensure timely issue resolution.
- Geographic Risk Exposure Analysis: Identify high-risk service zones using location-based insights to prioritize maintenance and infrastructure investments.
- Maintenance Activity Breakdown: Evaluate planned, corrective, and emergency maintenance activities to optimize maintenance strategies and improve asset performance.
- Recurring Operational Issues: Track frequently occurring problems to identify areas requiring infrastructure upgrades or process improvements.
- District and Regional Performance Comparison: Compare operational metrics across collection districts and service regions to identify best practices and performance gaps.
Benefits of Wastewater Collection Network Operations Performance Dashboard
The following are the benefits of using this wastewater network maintenance and operations dashboard:
- Improved Network Performance Visibility: Provide comprehensive insights into wastewater collection system operations, enabling better monitoring and informed decision-making.
- Reduced Sewer Overflows: Enable proactive monitoring and early issue detection to minimize overflow incidents and mitigate environmental and operational risks.
- Enhanced Maintenance Planning and Execution: Improve maintenance scheduling, prioritization, and completion rates to increase asset reliability and operational efficiency.
- Early Identification of Recurring Blockage Causes: Detect common blockage sources before they become critical issues, helping prevent service disruptions and costly repairs.
- Improved Lift Station Reliability: Monitor lift station performance and availability to ensure uninterrupted wastewater transport and reduce downtime.
- Data-Driven Asset Management: Support informed infrastructure and maintenance decisions through accurate operational and performance data.
- Optimized Maintenance Resource Allocation: Use performance insights to prioritize maintenance activities and allocate personnel, equipment, and budgets more effectively.
- Reduced Emergency Repair Costs: Address issues proactively to decrease the frequency of emergency repairs and lower associated operational expenses.
- Improved Incident Response Performance: Track and optimize response times across service zones to ensure faster resolution of operational incidents.
- Enhanced Regulatory Compliance and Reporting: Support compliance with wastewater management regulations through accurate monitoring, documentation, and reporting.
- Support for Long-Term Infrastructure Planning: Leverage historical and real-time performance data to guide capital investment decisions and future system upgrades.
- Strengthened Collection System Reliability: Improve overall network resilience, service continuity, and operational performance across the wastewater collection system.
KPIs to Track in Wastewater Collection Network Operations Performance Dashboard
The following key KPIs can be tracked by using this wastewater collection infrastructure monitoring dashboard:
- Total Wastewater Collected (MLD): Measures the total volume of wastewater collected across the network.
- Avg Flow Capacity Utilization (%): Tracks the percentage of available network capacity currently being utilized.
- Sewer Overflow Incidents: Measures the number of sewer overflow events occurring within the collection system.
- Sewer Blockage Rate (Incidents / 100 km): Tracks the frequency of sewer blockages relative to network length.
- Lift Station Availability (%): Measures the operational availability of lift stations across the collection network.
- Maintenance Completion Rate (%): Tracks the percentage of planned maintenance activities successfully completed.
Frequently Asked Questions
1. What is the purpose of a wastewater collection network operations performance dashboard?
It helps utilities monitor collection system performance, maintenance activities, sewer reliability, and operational efficiency.
2. Why is sewer blockage monitoring important?
Blockages can lead to overflows, service disruptions, environmental risks, and increased maintenance costs.
3. How does the dashboard improve operational efficiency?
It provides visibility into network performance, maintenance execution, asset availability, and incident response metrics.