What is an Electric Power Distribution Center Network Performance & Reliability Dashboard?
An Electric Power Distribution Center Network Performance & Reliability Dashboard is a centralized analytics tool that tracks grid performance, outage metrics, and reliability indicators for electric power distribution utilities. It consolidates data from SCADA systems, smart meters, field crew reports, and weather sensors to provide a comprehensive view of grid health. This electric utility reliability metrics tracking system helps DSOs identify outage root causes, predict equipment failures, and assess grid resilience across different regions and customer segments. By analyzing customer outage hours, sustained outages, and energy not supplied, utilities can prioritize maintenance, improve response times, and enhance service reliability.
How to Create an Electric Power Distribution Center Network Performance & Reliability Dashboard
You don’t need to build your report from scratch, just start with a ready-to-use dashboard template from Mokkup. Add in your data and export it however you like. Here’s how to do it:
1. Create or Log in to Your Mokkup Account
Start by signing up on Mokkup.ai using your email. If you already have an account, just log in, and you’ll be good to go.
2. Choose and Customize Your Dashboard Template
Find the Electric Power Distribution Center Network Performance & Reliability Dashboard template in the Templates section. Use the drag-and-drop editor to adjust KPIs, edit filters, or add elements based on your data.
3. Export to Your BI Tool
Once your dashboard wireframe is ready, use the BI Tool Export feature to send it directly to Power BI or Tableau for further analysis and enhancements. You can also download the dashboard as a PDF, PNG, or JPEG, embed it on a platform, or invite your team to collaborate.
Note: This is a Pro template. You’ll need a Pro subscription on Mokkup to use and customize this dashboard wireframe. Upgrade anytime to unlock full access.
Electric Power Distribution Center Network Performance & Reliability Dashboard Example
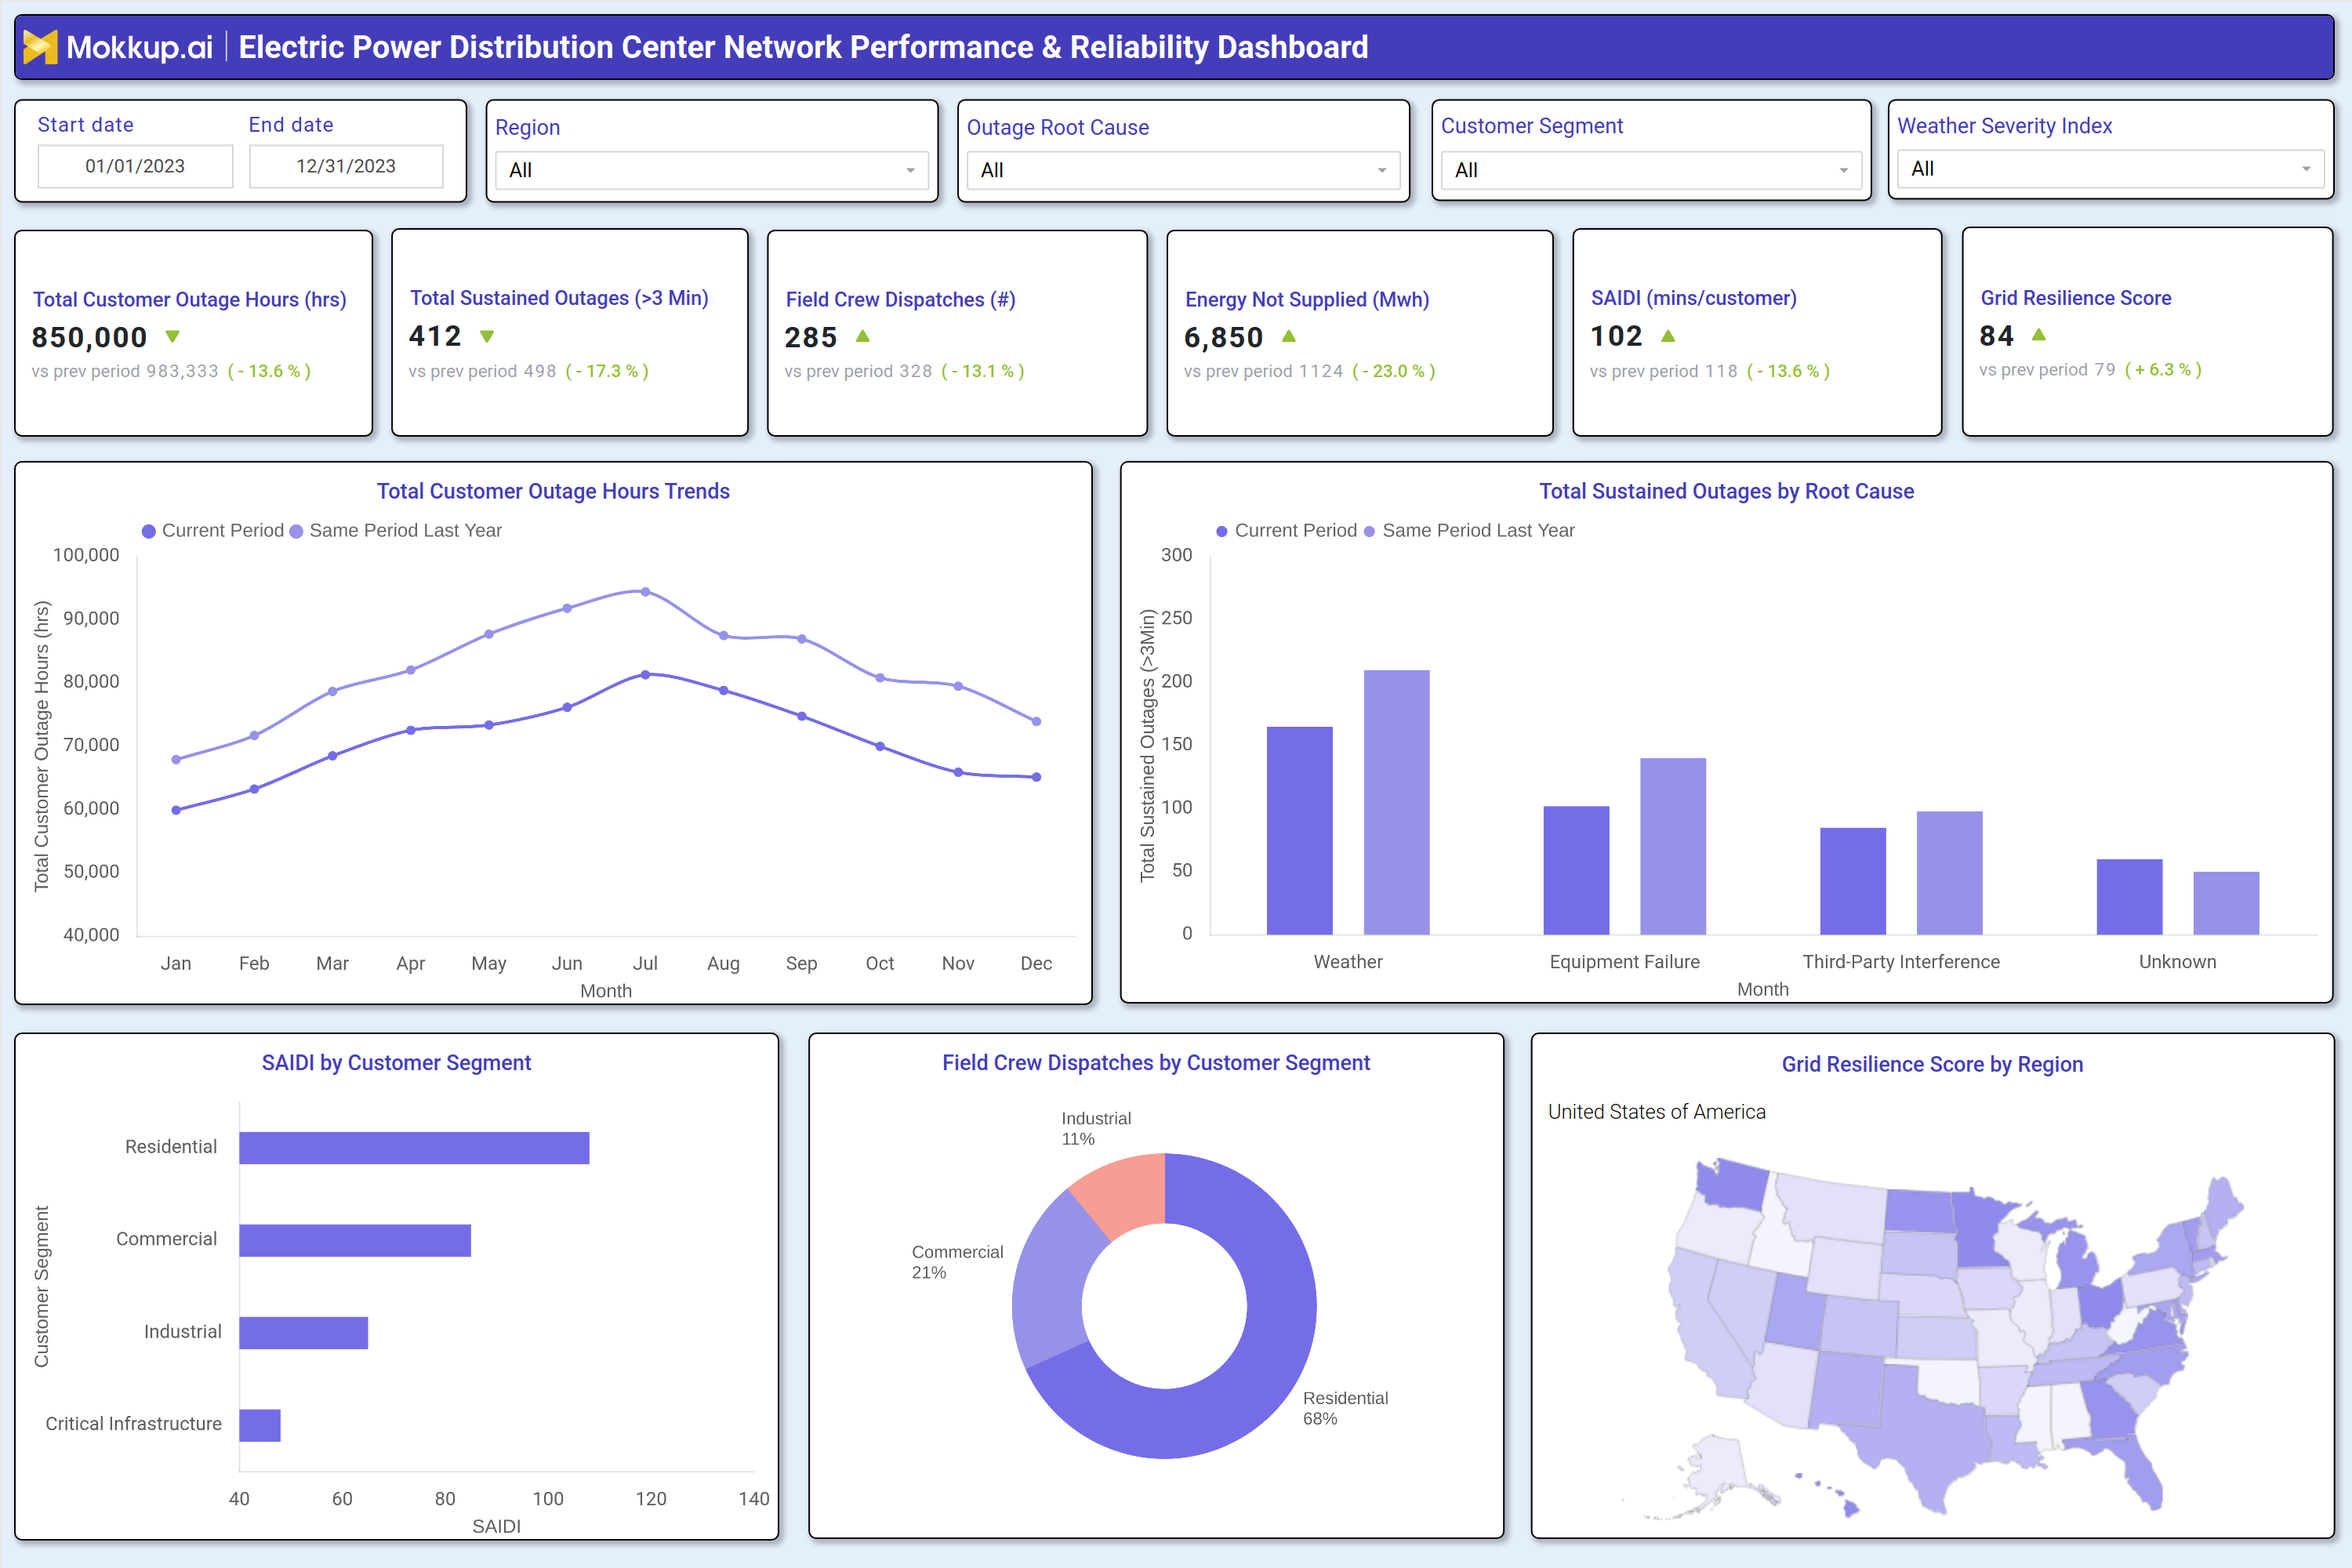
A typical electric power distribution network performance monitoring tool includes interactive filters for date range, region, outage root cause, customer segment, and weather severity. Key metrics displayed in performance tiles include total customer outage hours, sustained outages, field crew dispatches, energy not supplied (MWh), SAIDI (System Average Interruption Duration Index), and grid resilience score. Trend charts compare current performance against historical data, highlighting improvements or declines in reliability. A root cause analysis chart breaks down outages by weather, equipment failure, third-party interference, and unknown causes, while a geographic heatmap visualizes grid resilience scores by region. A customer segment breakdown shows SAIDI impacts on residential, commercial, industrial, and critical infrastructure, helping utilities allocate resources effectively.
How to Analyze Data in an Electric Power Distribution Center Network Performance & Reliability Dashboard
Here is how you can analyze data from this dashboard:
- Review total customer outage hours to assess overall grid reliability and identify high-impact outage periods.
- Compare sustained outages (>3 min) against historical data to detect trends in equipment failures or weather-related disruptions.
- Monitor field crew dispatches to evaluate response efficiency and workforce productivity.
- Track energy not supplied (MWh) to measure economic impact and prioritize grid upgrades.
- Analyze SAIDI (System Average Interruption Duration Index) to benchmark performance against regulatory standards.
- Examine grid resilience scores by region to identify vulnerable areas requiring reinforcement.
- Break down outage root causes (weather, equipment failure, third-party interference) to implement targeted mitigation strategies.
- Assess customer segment impacts to ensure critical infrastructure (hospitals, data centers) receive priority restoration.
Benefits of an Electric Power Distribution Center Network Performance & Reliability Dashboard
The following are the benefits of using this dashboard:
- Improves grid reliability by identifying and addressing outage root causes.
- Reduces customer downtime through predictive maintenance and faster response times.
- Enhances operational efficiency by optimizing field crew dispatches and resource allocation.
- Supports regulatory compliance by tracking SAIDI, SAIFI, and other reliability metrics.
- Enables data-driven decision-making for grid modernization and infrastructure investments.
- Minimizes economic losses by reducing energy not supplied (MWh) during outages.
- Strengthens resilience against extreme weather and cybersecurity threats.
- Provides transparency for stakeholders through performance tracking.
KPIs to Track in an Electric Power Distribution Center Network Performance & Reliability Dashboard
The following key KPIs can be tracked by using this smart grid network performance optimization dashboard:
- Total Customer Outage Hours (hrs): Measures cumulative downtime experienced by customers.
- Total Sustained Outages (>3 Min): Tracks the number of prolonged outages affecting grid stability.
- Field Crew Dispatches (count): Indicates workforce response efficiency during outages.
- Energy Not Supplied (MWh): Quantifies lost energy due to outages, impacting revenue and service quality.
- SAIDI (System Average Interruption Duration Index) (mins/customer): Benchmarks average outage duration per customer.
- Grid Resilience Score: Evaluates overall grid robustness against disruptions.
- Outage Root Cause Breakdown: Identifies primary causes (weather, equipment failure, third-party interference).
- Customer Segment Impact (SAIDI by Segment): Assesses outage impacts on residential, commercial, industrial, and critical infrastructure.
Frequently Asked Questions
1. What is the purpose of a power distribution network performance dashboard?
It helps DSOs monitor grid reliability, track outage trends, and optimize maintenance strategies to reduce downtime and improve service quality.
2. Who should use a distribution system operator (DSO) grid health dashboard?
Grid operators, maintenance teams, utility executives, and regulatory compliance officers benefit from performance insights.
3. Can this power distribution network efficiency improvement analytics dashboard help with regulatory reporting?
Yes, it tracks SAIDI, SAIFI, and other compliance metrics required by energy regulators.