What is a Nuclear Power Plant Emergency Preparedness Dashboard?
A Nuclear Power Plant Emergency Preparedness Dashboard is a centralized digital system used to track, assess, and improve emergency readiness across a nuclear facility. It consolidates key indicators related to emergency drills, incident response, radiation alarms, staff training, protective equipment availability, and monitoring system performance. By offering real-time nuclear emergency preparedness monitoring, the dashboard supports operations, radiation protection teams, emergency response coordinators, and plant leadership. It functions as a comprehensive power plant incident response dashboard, ensuring all departments maintain readiness for radiological events, technical failures, natural hazards, and security-related emergencies. The dashboard is also essential for regulatory reporting, drill compliance, and maintaining continuous operational safety across nuclear units.
How to Create a Nuclear Power Plant Emergency Preparedness Dashboard
You don’t need to build your report from scratch—just start with a ready-to-use dashboard template from Mokkup. Add in your data and export it however you like. Here’s how to do it:
1. Create or Log in to Your Mokkup Account
Start by signing up on Mokkup.ai using your email. If you already have an account, just log in, and you’ll be good to go.
2. Choose and Customize Your Dashboard Template
Find the Nuclear Power Plant Emergency Preparedness Dashboard template in the Templates section. Use the drag-and-drop editor to adjust KPIs, edit filters, or add elements based on your data.
3. Export to Your BI Tool
Once your dashboard wireframe is ready, use the BI Tool Export feature to send it directly to Power BI or Tableau for further analysis and enhancements. You can also download the dashboard as a PDF, PNG, or JPEG, embed it on a platform, or invite your team to collaborate.
Note: This is a Pro template. You’ll need a Pro subscription on Mokkup to use and customize this dashboard wireframe. Upgrade anytime to unlock full access.
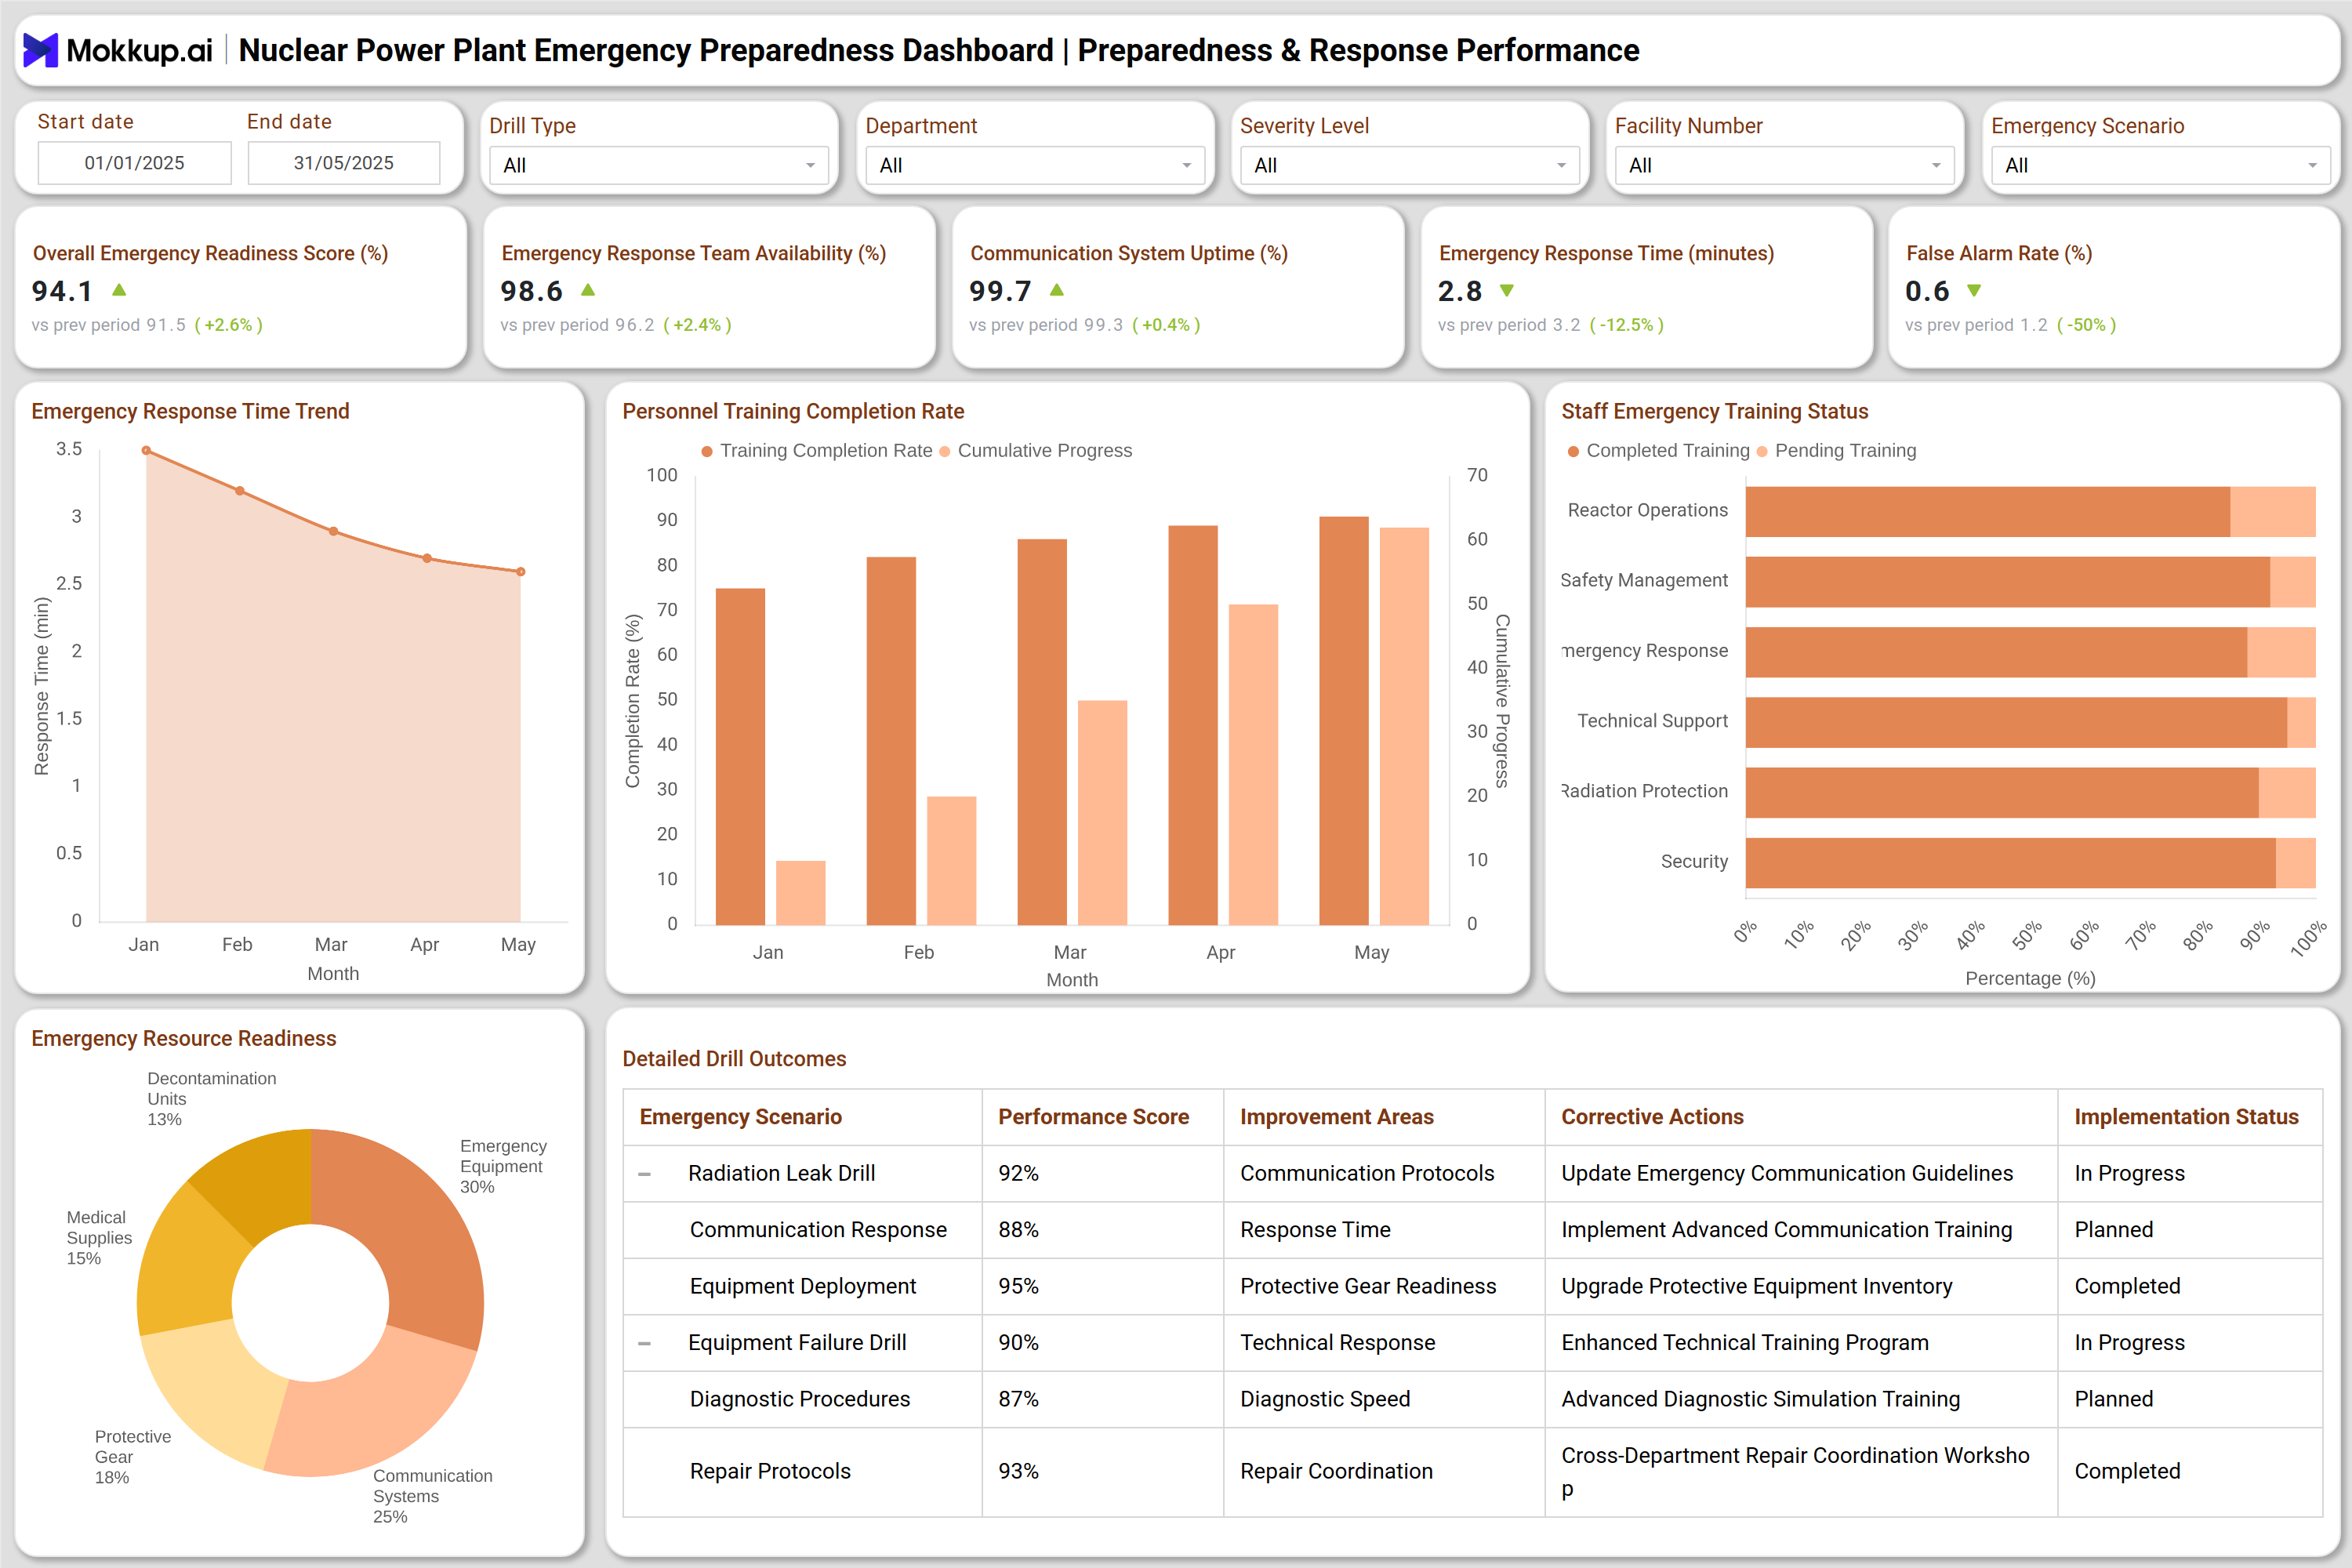
Nuclear Power Plant Emergency Preparedness Dashboard Example
You can create a Nuclear Power Plant Emergency Preparedness Dashboard using the modules shown in the reference images. A typical dashboard displays emergency readiness scores, team availability, communication uptime, response time trends, and false alarm rates. The Preparedness & Response Performance panel visualizes training completion, staff readiness across multiple departments, and detailed drill outcomes supporting accurate nuclear safety drill performance tracking across scenarios such as radiation leaks, equipment failures, communication response, and diagnostic procedures.
The Radiological Safety & Emergency Readiness section expands the analytical view by showing radiation boundary levels, alarm frequency, evacuation readiness, and dosimeter availability. Visual components such as drill outcome tables, radiation alarm event charts, protective equipment inventory bars, and monitoring system status panels provide deeper nuclear plant alarm response insights. Together, these modules offer comprehensive reactor emergency readiness analytics that help in real-time risk response assessment, strengthen emergency protocols, and improve overall decision-making. This integrated approach gives operators a complete emergency preparedness compliance dashboard capable of supporting nuclear facilities under any scenario.
How to Analyze Data in a Nuclear Power Plant Emergency Preparedness Dashboard
Here is how you can analyze data from this dashboard:
- Gauge Overall Preparedness: Review emergency readiness indicators to spot gaps in team availability, communication uptime, and overall response capability.
- Track Response Speed: Analyze emergency response time trends to see whether the facility is improving or slowing down during drills or real events.
- Check Training Coverage: Compare training completion rates by department to identify teams that need accelerated or refresher sessions.
- Review Drill Outcomes: Evaluate drill performance tables to pinpoint areas that need attention, such as communication flow, diagnostic accuracy, or protective gear readiness.
- Monitor Radiation Alerts: Track radiation alarm events to understand recurring triggers or shifts in boundary radiation levels.
- Verify Evacuation Readiness: Assess the availability of evacuation routes, sirens, muster points, and transport to ensure smooth movement during emergencies.
- Inspect Protective Gear: Check inventory for dosimeters, suits, respirators, and gloves to confirm they meet operational standards.
- Validate Monitoring Systems: Analyze system status to confirm active alerts, identify maintenance needs, and verify coverage across the plant perimeter and control systems.
Benefits of a Nuclear Power Plant Emergency Preparedness Dashboard
The following are the benefits of using this dashboard:
- Enhances real-time visibility into plant-wide emergency readiness.
- Improves staff preparedness through centralized training and compliance tracking.
- Strengthens reactor emergency readiness analytics with accurate monitoring data.
- Reduces emergency response time and improves protocol execution.
- Increases regulatory compliance accuracy and simplifies audit processes.
- Enables early detection of radiation-related hazards through alarm trend analysis.
- Supports consistent nuclear facility backup power readiness assessment.
- Helps coordinate cross-department emergency procedures and resource availability.
- Provides clear insights for leadership decision-making and risk mitigation
KPIs to Track in a Nuclear Power Plant Emergency Preparedness Dashboard
The following key KPIs can be tracked by using this dashboard:
- Overall Emergency Readiness Score (%) – Measures the facility’s total preparedness level across personnel, equipment, and emergency systems.
- Emergency Response Team Availability (%) – Indicates how many trained emergency personnel are ready for deployment at any given time.
- Emergency Response Time (minutes) – Shows how quickly teams respond to drills or actual incidents.
- False Alarm Rate (%) – Measures the percentage of alarms triggered without an actual emergency condition.
- Personnel Training Completion Rate (%) – Displays the share of staff who have completed required emergency training programs.
- Evacuation Readiness (%) – Assesses preparedness of evacuation routes, muster points, and transport systems.
- Monitoring System Coverage (%) – Reflects the percentage of active and functioning safety monitoring systems across the plant.
- Drill Performance Score (%) – Scores emergency department drills based on execution accuracy, timing, and team coordination.
- Active Alerts on Monitoring Systems (count) – Shows how many monitoring systems have unresolved alerts requiring attention.
- Department-Level Emergency Readiness (%/score) – Measures readiness status for each department involved in emergency response
Frequently Asked Questions
1. Why is an emergency preparedness dashboard important for nuclear plants?
It provides real-time nuclear emergency preparedness monitoring, helping plants evaluate readiness, meet regulatory standards, and respond rapidly to incidents.
2. What type of data does the dashboard track?
It tracks training progress, response time, radiation alarms, equipment availability, evacuation readiness, drill outcomes, and system uptime.
3. Can this dashboard support regulatory reporting?
Yes. It serves as an emergency preparedness compliance dashboard that aligns with NRC, IAEA, and national safety regulations.
4. Who uses this dashboard in a nuclear facility?
Emergency coordinators, radiation protection teams, safety managers, plant operators, and senior leadership.
5. Does the dashboard help reduce emergency response time?
Yes. Trend analysis allows teams to identify bottlenecks and improve response performance.