
What is a Wastewater Collection Flooding Risk & Emergency Preparedness Dashboard?
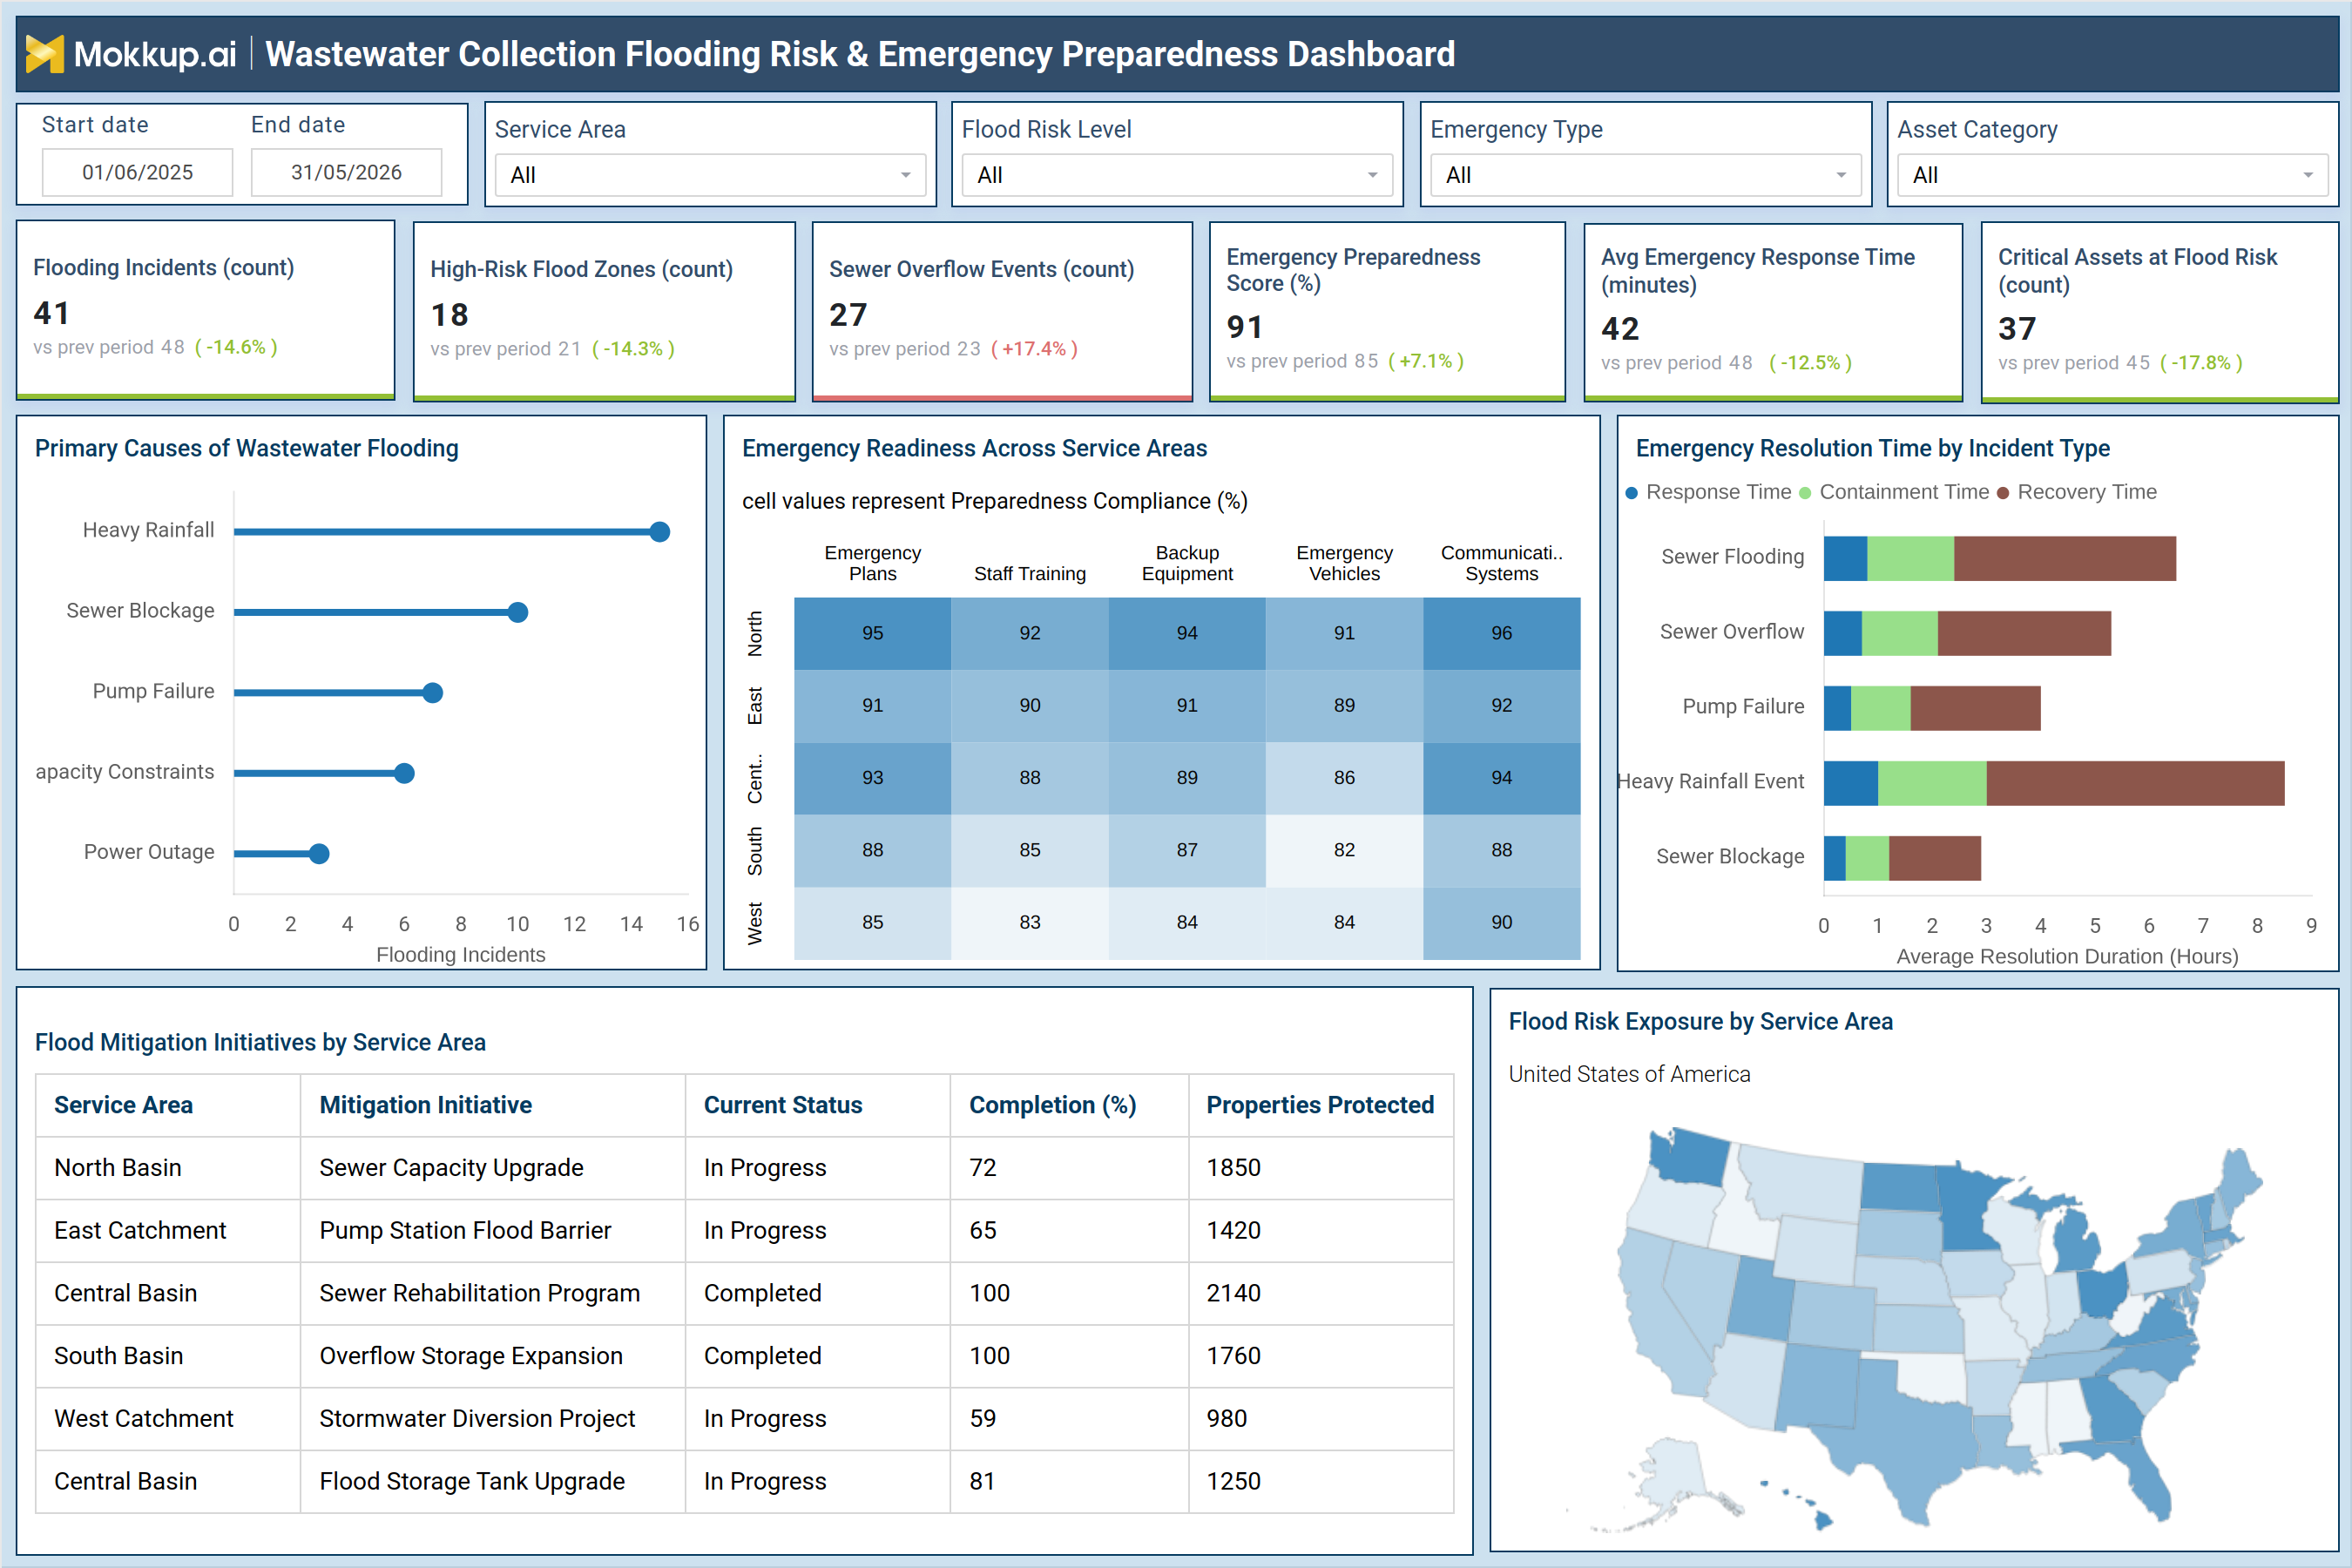
The Wastewater Collection Flooding Risk & Emergency Preparedness Dashboard is an analytics template built for utility managers, municipal engineers, and emergency planners who oversee wastewater collection infrastructure. It tracks flooding incidents, high-risk flood zones, sewer overflow events, preparedness compliance scores, emergency response times, and critical assets at flood risk — all within a single operational view. By monitoring these indicators together, operations teams can identify where infrastructure is most vulnerable, measure readiness across service areas, and track the progress of flood mitigation projects before or after a major weather event. This wastewater collection flooding risk dashboard is structured around six core KPI tiles, a preparedness compliance matrix, a primary causes breakdown, and a flood risk exposure map, giving utility teams the high-level status read and drill-down visibility needed for incident management. It functions as an emergency preparedness dashboard for utilities managing multi-basin wastewater systems, where immediate response capacity and longer-term mitigation planning must work together to protect communities and maintain regulatory compliance.
How to Create a Wastewater Collection Flooding Risk & Emergency Preparedness Dashboard
You don't need to build your report from scratch; just start with a ready-to-use dashboard template from Mokkup. Add in your data and export it however you like. Here's how to do it:
1. Create or Log in to Your Mokkup Account
Start by signing up on Mokkup.ai using your email. If you already have an account, just log in, and you'll be good to go.
2. Choose and Customize Your Dashboard Template
Find the Wastewater Collection Flooding Risk & Emergency Preparedness Dashboard template in the Templates section. Use the drag-and-drop editor to adjust KPIs, edit filters, or add elements based on your data.
3. Export to Your BI Tool
Once your dashboard wireframe is ready, use the BI Tool Export feature to send it directly to Power BI or Tableau for further analysis and enhancements. You can also download the dashboard as a PDF, PNG, or JPEG, embed it on a platform, or invite your team to collaborate.
Note: This is a Pro template. You'll need a Pro subscription on Mokkup to use and customize this dashboard wireframe. Upgrade anytime to unlock full access.
Wastewater Collection Flooding Risk & Emergency Preparedness Dashboard Example
A wastewater operations director opens this wastewater collection flooding risk dashboard at the start of a high-rainfall season to assess whether the organization's flood response posture has improved since the last quarter. The headline KPI tiles give an immediate read on whether flooding incidents are trending up, how many sewer overflow events have been recorded, and whether the Emergency Preparedness Score is holding within an acceptable range. Indicators that have shifted in the wrong direction point directly to where investigation is needed. From there, service area supervisors can examine which root causes — heavy rainfall, sewer blockage, pump failure, capacity constraints, or power outages are generating the most incidents.
Teams can use sewer overflow event tracking data to identify which basins are most prone to capacity exceedance, then cross-reference the preparedness compliance matrix to understand whether affected zones have the trained personnel and backup equipment in place to respond effectively. Planning teams review the flood mitigation monitoring by service area table to track infrastructure projects currently underway, completion progress and the number of properties each initiative protects once finished. Combined with the geographic risk exposure map, this view supports data-driven capital prioritization and helps utility teams shift from reactive crisis response to structured infrastructure resilience planning.
How to Analyze Data in a Wastewater Collection Flooding Risk & Emergency Preparedness Dashboard
Here is how you can analyze data from this dashboard:
- Use the Service Area filter to isolate flooding incident trends and preparedness compliance scores within a specific basin or catchment zone
- Review the Flooding Incidents KPI against prior-period trends to determine whether flood frequency is increasing or stabilizing across service areas
- Analyze the Primary Causes of Wastewater Flooding chart to identify which factors — heavy rainfall, sewer blockage, pump failure, capacity constraints, or power outage — drive the most incidents
- Cross-reference the Emergency Readiness matrix to find service areas with low compliance in staff training, backup equipment, or emergency vehicle availability
- Evaluate emergency response time KPI tracking data by incident type to compare response, containment, and recovery durations across flood event categories
- Use the Flood Mitigation Initiatives table to monitor project completion status and the number of properties protected per mitigation initiative
- Apply the Flood Risk Level and Emergency Type filters together to concentrate analysis on the highest-severity events requiring immediate intervention
- Refer to the Flood Risk Exposure by Service Area map to compare geographic risk concentration across basins and direct preparedness investments where exposure is highest
Benefits of a Wastewater Collection Flooding Risk & Emergency Preparedness Dashboard
The following are the benefits of using this dashboard:
- Consolidates flooding incidents, sewer overflow event tracking, preparedness compliance, and mitigation status across all service areas in one view
- Enables targeted resource deployment by surfacing which service areas and incident types require the longest resolution times
- Quantifies emergency preparedness scores per zone, supporting compliance documentation and regulatory reporting for utility authorities
- Tracks flood mitigation monitoring by service area to link infrastructure project completion directly to the number of properties protected
- Serves as an emergency preparedness dashboard for utilities that need to demonstrate readiness before a flood event rather than respond to one in progress
- Provides geographic flood risk context through a regional exposure map, enabling basin-by-basin comparison and capital project prioritization
- Accelerates post-event reviews by placing incident volume, response metrics, and mitigation progress side by side
KPIs to Track in a Wastewater Collection Flooding Risk & Emergency Preparedness Dashboard
The following key KPIs can be tracked by using this dashboard:
- Flooding Incidents (Count): Total flooding events recorded within the selected period; tracks whether incident frequency is rising or stabilizing across service zones
- High-Risk Flood Zones (Count): Number of zones classified as high-risk for flooding; directs where infrastructure investment and preparedness focus should be concentrated
- Sewer Overflow Events (Count): Instances where sewer capacity was exceeded and collection systems were bypassed; a direct measure of infrastructure strain and overflow risk
- Emergency Preparedness Score (%): Composite compliance metric across emergency plans, staff training, backup equipment, emergency vehicles, and communication systems per service area
- Avg Emergency Response Time (Minutes): Time from incident report to crew deployment; the core emergency response time KPI tracking metric for wastewater operations benchmarking
- Critical Assets at Flood Risk (Count): High-value infrastructure assets within flood-exposed zones; helps teams quantify the potential service impact of future flooding events
Frequently Asked Questions
1. What type of organization benefits most from this dashboard?
Municipal utility agencies, wastewater management authorities, and civil engineering departments overseeing distributed collection systems benefit most from this template. It is built for teams responsible for both operations and emergency preparedness planning across multiple service areas.
2. How is the Emergency Preparedness Score calculated?
The Emergency Preparedness Score reflects compliance across five dimensions: emergency plans, staff training, backup equipment, emergency vehicles, and communication systems. A decline in the score signals a readiness gap that requires attention before the next flood event.
3. Can this dashboard help prioritize flood mitigation investment?
Yes. The Flood Mitigation Initiatives table links each project to its completion status and properties protected, while the flood risk exposure dashboard template's geographic map highlights where risk concentration is highest, giving planners evidence to build a prioritized investment case.