
What is an Irrigation and Water Distribution Canal Safety & Emergency Response Dashboard?
The Irrigation and Water Distribution Canal Safety & Emergency Response Dashboard is a purpose-built canal safety emergency response dashboard used by irrigation district supervisors, water utility managers, and infrastructure safety teams to oversee canal health and operational readiness. It consolidates critical metrics, including breach events, audit scores, inspection compliance rates, and emergency plan readiness, into a single structured view across all canal zones and reaches. The dashboard supports water distribution canal structural health assessment by combining reach-level inspection data with network-wide safety indicators, enabling teams to detect risk early and respond decisively. By unifying emergency preparedness, compliance tracking, and seepage monitoring into one platform, it empowers operations teams to keep canal infrastructure safe, compliant, and resilient year-round.
How to Create an Irrigation and Water Distribution Canal Safety & Emergency Response Dashboard
You don’t need to build your report from scratch; just start with a ready-to-use dashboard template from Mokkup. Add in your data and export it however you like. Here’s how to do it:
1. Create or Log in to Your Mokkup Account
Start by signing up on Mokkup.ai using your email. If you already have an account, just log in, and you'll be good to go.
2. Choose and Customize Your Dashboard Template
Find the Irrigation and Water Distribution Canal Safety & Emergency Response Dashboard template in the Templates section. Use the drag-and-drop editor to adjust KPIs, edit filters, or add elements based on your data.
3. Export to Your BI Tool
Once your dashboard wireframe is ready, use the BI Tool Export feature to send it directly to Power BI or Tableau for further analysis and enhancements. You can also download the dashboard as a PDF, PNG, or JPEG, embed it on a platform, or invite your team to collaborate.
Note: This is a Pro template. You'll need a Pro subscription on Mokkup to use and customize this dashboard wireframe. Upgrade anytime to unlock full access.
Irrigation and Water Distribution Canal Safety & Emergency Response Dashboard Example
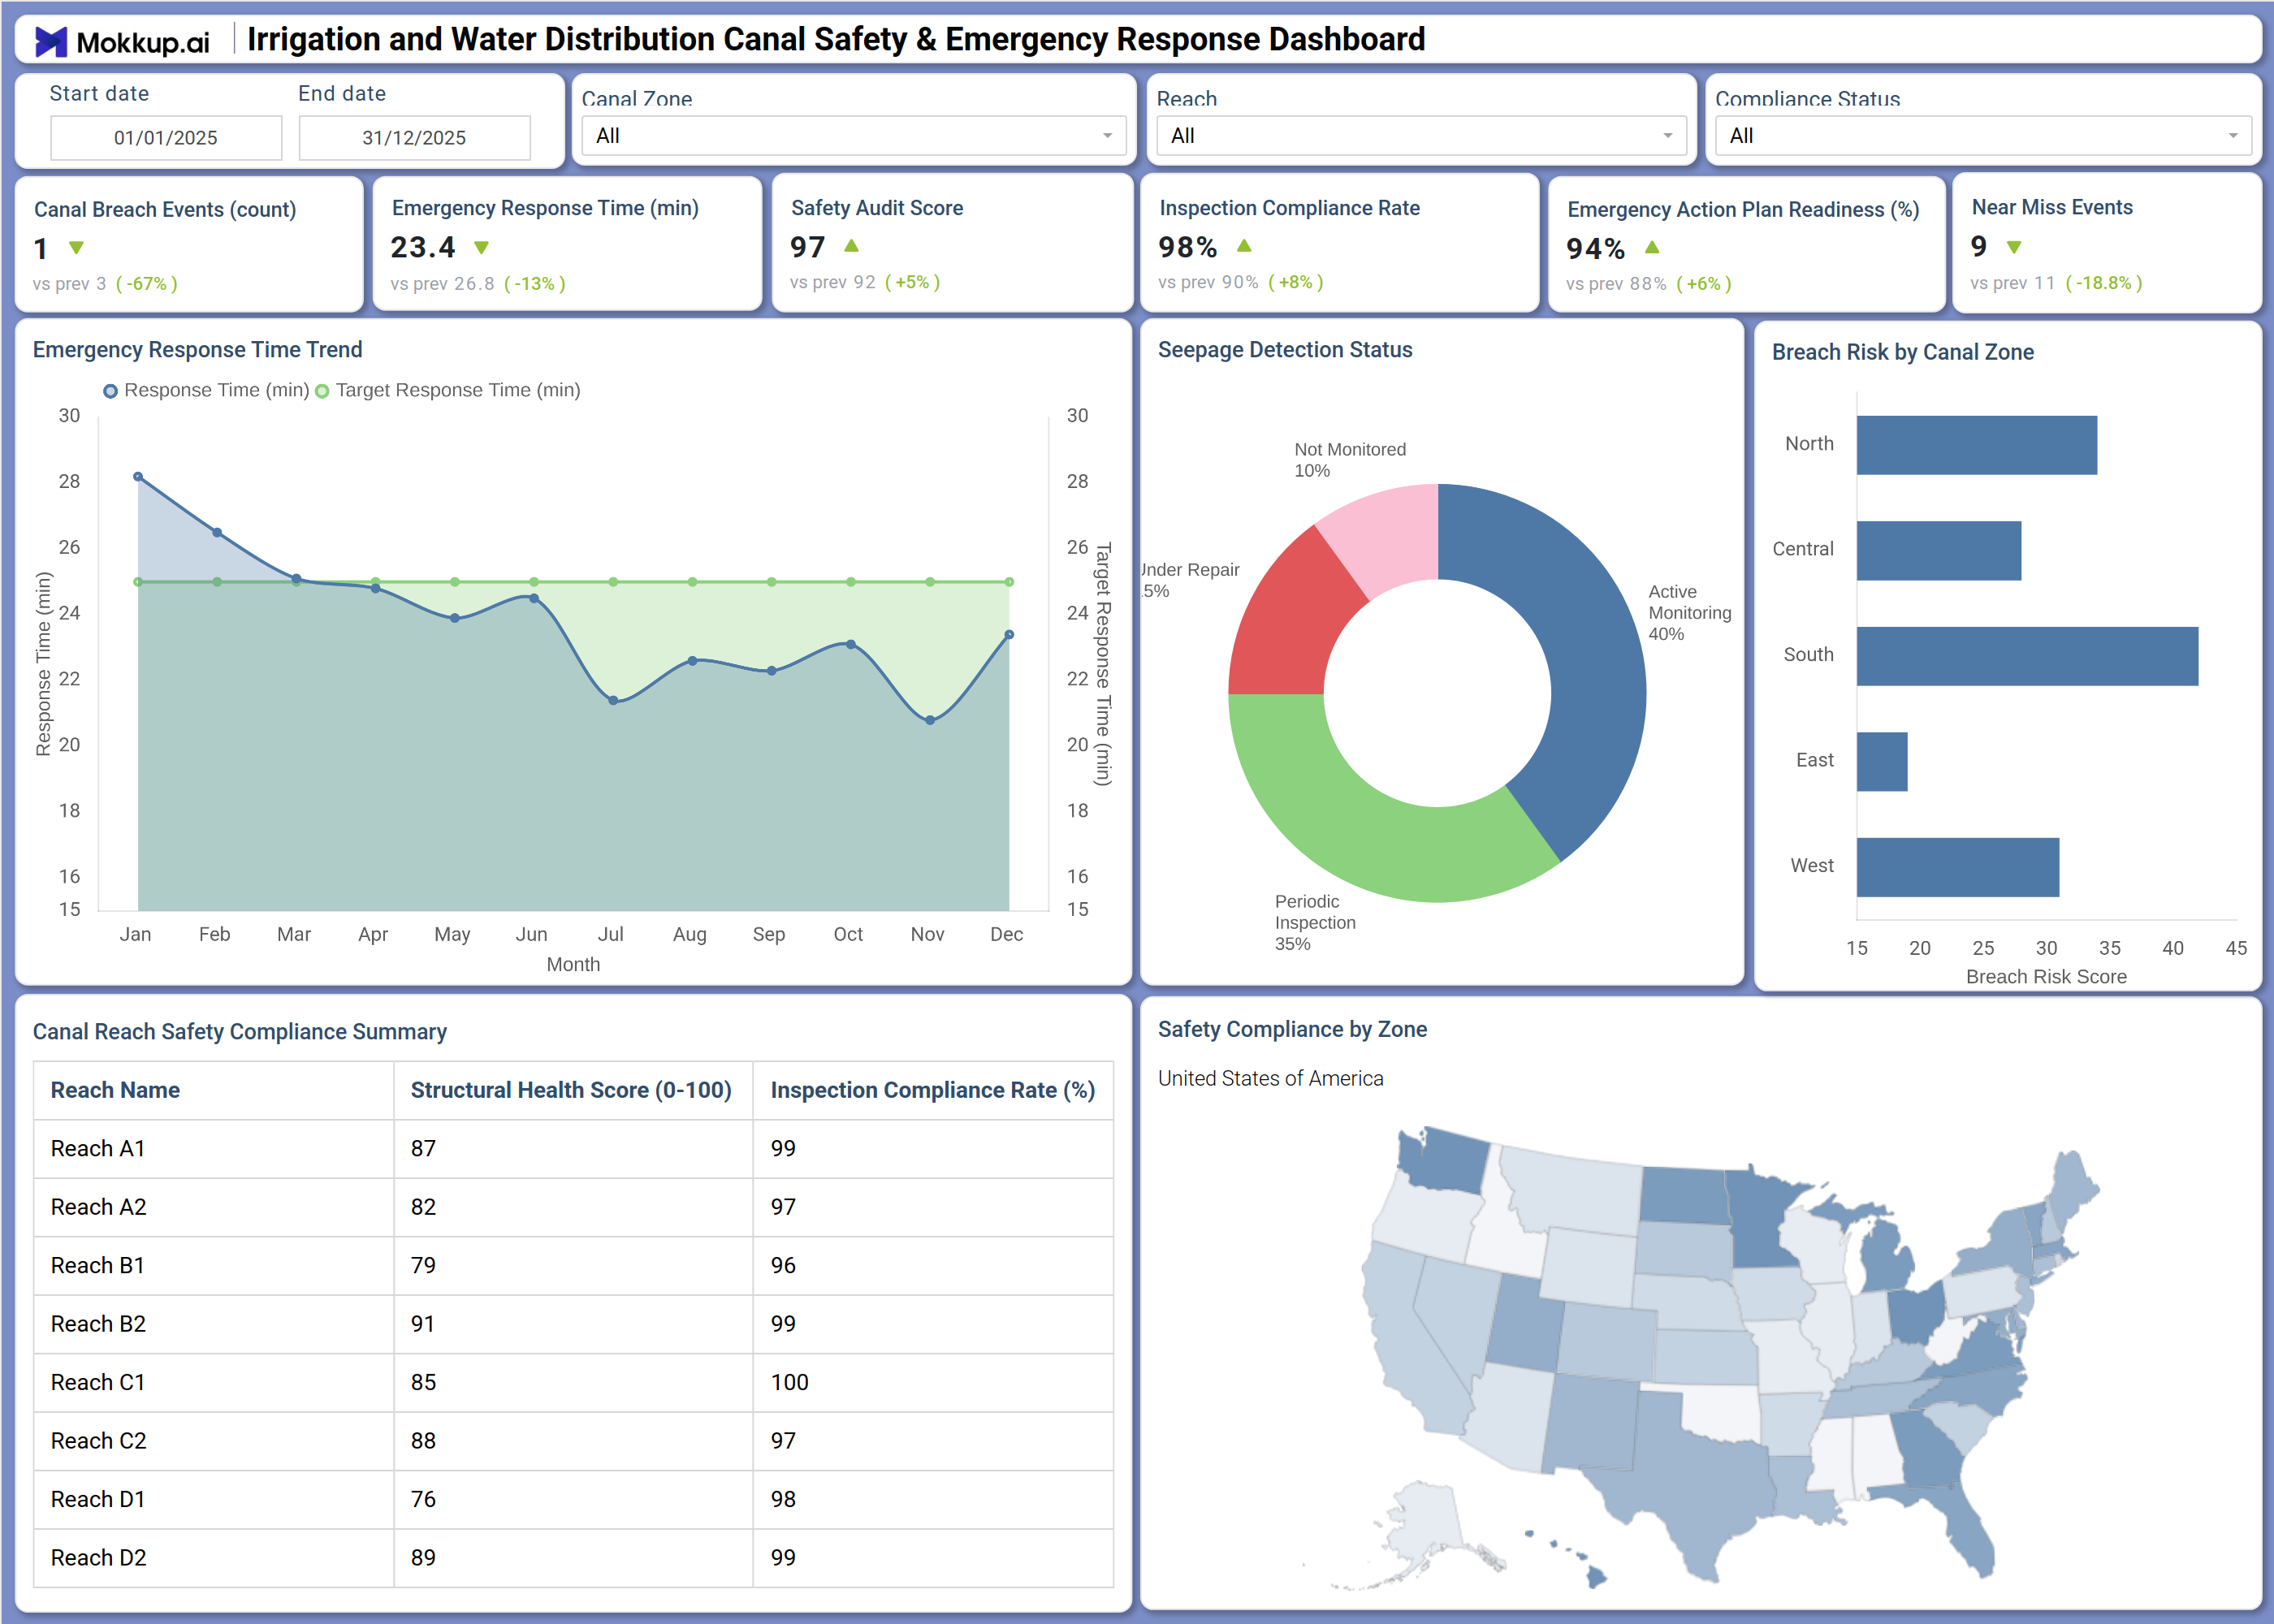
When irrigation district managers open this dashboard, they get an immediate picture of how well their canal network is performing from a safety and emergency preparedness standpoint. The summary KPIs at the top let supervisors quickly gauge whether breach events are trending in the right direction, whether response teams are meeting target times, and whether inspection programs are running on schedule. If any indicator deviates from the expected range, managers can use the Canal Zone and Reach filters to pinpoint exactly which segment of the network requires attention — turning a network-wide alert into a targeted operational response. The Emergency Response Time Trend chart is where operations teams invest significant analytical effort, comparing actual response minutes against the target benchmark across the full year. If certain months show widening gaps between actual and target performance, teams can investigate whether staffing constraints or seasonal conditions contributed and refine their response protocols accordingly.
This longitudinal view supports irrigation canal breach risk monitoring by making seasonal vulnerability patterns immediately visible and actionable. Infrastructure health teams rely on the Canal Reach Safety Compliance Summary table to evaluate each reach's structural condition alongside its inspection standing. Rather than reviewing reach-by-reach data in disconnected reports, planners can immediately identify which reaches fall below acceptable structural thresholds and prioritize maintenance interventions before conditions deteriorate. Canal inspection compliance rate tracking shifts from a quarterly reporting task into a daily operational discipline with this structured view in place. For strategic planning and zone-level risk management, the Breach Risk by Canal Zone bar chart and the Safety Compliance by Zone map work together to guide resource allocation. Zones with consistently elevated breach risk scores or lower geographic compliance coverage stand out immediately, enabling leadership to direct capital investments and inspection teams to the highest-need areas across the network.
How to Analyze Data in an Irrigation and Water Distribution Canal Safety & Emergency Response Dashboard
Here is how you can analyze data from this dashboard:
- Use the Canal Zone filter to isolate safety performance for a specific zone and compare it against the network-wide baseline.
- Use the Reach filter to drill into structural health and inspection compliance data for individual canal reaches.
- Review the Emergency Response Time Trend chart to identify months where response times exceeded the target benchmark and investigate contributing factors.
- Analyze the Seepage Detection Status donut chart to assess how much of the canal network is under active monitoring versus periodic inspection or not monitored — supporting canal inspection compliance rate tracking decisions.
- Compare the Breach Risk by Canal Zone bar chart to identify which zones carry the highest breach risk scores and need prioritized attention.
- Review the Canal Reach Safety Compliance Summary table to find reaches with low Structural Health Scores and flag them for scheduled maintenance.
- Filter by Compliance Status to focus analysis on reaches or zones that are falling below compliance thresholds.
- Track the Emergency Action Plan Readiness KPI over time to measure progress in emergency preparedness across the entire canal network.
Benefits of a Irrigation and Water Distribution Canal Safety & Emergency Response Dashboard
The following are the benefits of using this dashboard:
- Centralizes breach events, inspection compliance, structural health, and emergency readiness metrics across the full canal network in one structured template.
- Supports irrigation canal breach risk monitoring across multiple canal zones simultaneously with a dedicated horizontal bar chart and a geographic compliance map.
- Reduces manual data compilation for safety and compliance reporting with pre-built KPI tiles and chart layouts covering all key dimensions.
- Enables reach-level analysis of seepage detection status irrigation canals to guide maintenance scheduling and infrastructure investment decisions before issues escalate.
- Provides a donut chart breakdown of seepage monitoring coverage — Active Monitoring, Periodic Inspection, Under Repair, and Not Monitored — for risk assessment planning.
- Helps irrigation district managers and safety officers align with inspection compliance standards without rebuilding performance reports from scratch.
- Gives operations teams and executive leadership a shared view of canal safety performance across all zones and reaches.
KPIs to Track in a Irrigation and Water Distribution Canal Safety & Emergency Response Dashboard
The following key KPIs can be tracked by using this dashboard:
- Emergency Response Time (min): A core emergency response time canal safety metric — measures how quickly teams mobilize after an incident and tracks progress toward the target response benchmark across all canal zones.
- Canal Breach Events (count): Tracks the total number of breach incidents across the canal network — a direct indicator of structural risk and the effectiveness of containment and prevention efforts.
- Inspection Compliance Rate (%): Quantifies the share of canal reaches completing scheduled inspections on time — central to canal inspection compliance rate tracking and confirming that the safety program is being executed as designed.
- Safety Audit Score (0–100): Measures overall safety program quality across all reaches and zones — key to water distribution canal structural health benchmarking and long-term infrastructure planning.
- Emergency Action Plan Readiness (%): Evaluates the percentage of canal segments with active, current emergency response plans in place — supporting incident preparedness and regulatory compliance workflows.
- Near Miss Events (count): Tracks safety incidents that nearly resulted in harm, segmented across Canal Zone, Reach, and Compliance Status dimensions as displayed in the dashboard filters.
Frequently Asked Questions
1. What teams use an Irrigation and Water Distribution Canal Safety & Emergency Response Dashboard?
Irrigation district operations managers, infrastructure safety engineers, emergency response coordinators, and water utility compliance officers are the primary users. These teams rely on the canal safety emergency response dashboard to track canal integrity, monitor inspection programs, manage breach risk by zone, and maintain readiness for seepage or structural failure incidents.
2. How does this dashboard improve emergency response outcomes for canal operators?
The Emergency Response Time Trend chart lets operations teams compare actual response minutes against the target benchmark month by month, making it easy to spot periods where emergency response time canal safety targets and investigate root causes. Combined with the Emergency Action Plan Readiness KPI, teams can confirm that protocols are current and that every zone is covered before an incident occurs.
3. Can this dashboard track seepage detection across the canal network?
Yes. The Seepage Detection Status donut chart gives managers a clear view of seepage detection status across irrigation canals by segmenting the entire network into Active Monitoring, Periodic Inspection, Under Repair, and Not Monitored categories. This makes it easy to identify coverage gaps and prioritize areas where more frequent inspection or monitoring equipment is needed.
4. How does the Breach Risk by Canal Zone chart work?
The Breach Risk by Canal Zone horizontal bar chart displays a composite breach risk score for each zone — North, Central, South, East, and West. Longer bars indicate higher structural and operational risk. Teams use this chart alongside the Safety Compliance by Zone map to prioritize zone-level inspections and direct maintenance resources to the most vulnerable segments of the network.
5. What does the Inspection Compliance Rate KPI measure?
The Inspection Compliance Rate measures the percentage of canal reaches that have completed their scheduled inspections within the required timeframe. It is a foundational metric for canal inspection compliance rate tracking and indicates how consistently the safety inspection program is being executed across the full network. A high rate confirms that the program is operating as designed and that structural risks are being identified and addressed on schedule.