
What is a Wastewater Collection Environmental Impact Dashboard?
The Wastewater Collection Environmental Impact Dashboard is a structured analytics template built for environmental compliance managers, utility operations teams, and ESG reporting leads who oversee wastewater infrastructure performance. This wastewater collection environmental impact dashboard tracks critical metrics, including sanitary sewer overflow counts, untreated sewage volumes, greenhouse gas emissions, spill response effectiveness, and overall water quality outcomes across collection basins and districts. It consolidates field-level environmental data into a single reporting layer, giving managers a reliable view of system performance against compliance thresholds and sustainability targets. Teams using untreated sewage spill response tracking tools alongside this dashboard can quickly identify where overflows are occurring, how effectively crews are responding, and which basins carry the greatest environmental exposure.
How to Create a Wastewater Collection Environmental Impact Dashboard
You don’t need to build your report from scratch; just start with a ready-to-use dashboard template from Mokkup. Add in your data and export it however you like. Here’s how to do it:
1. Create or Log in to Your Mokkup Account
Start by signing up on Mokkup.ai using your email. If you already have an account, just log in, and you'll be good to go.
2. Choose and Customize Your Dashboard Template
Find the Wastewater Collection Environmental Impact Dashboard template in the Templates section. Use the drag-and-drop editor to adjust KPIs, edit filters, or add elements based on your data.
3. Export to Your BI Tool
Once your dashboard wireframe is ready, use the BI Tool Export feature to send it directly to Power BI or Tableau for further analysis and enhancements. You can also download the dashboard as a PDF, PNG, or JPEG, embed it on a platform, or invite your team to collaborate.
Note: This is a Pro template. You'll need a Pro subscription on Mokkup to use and customize this dashboard wireframe. Upgrade anytime to unlock full access.
Wastewater Collection Environmental Impact Dashboard Example
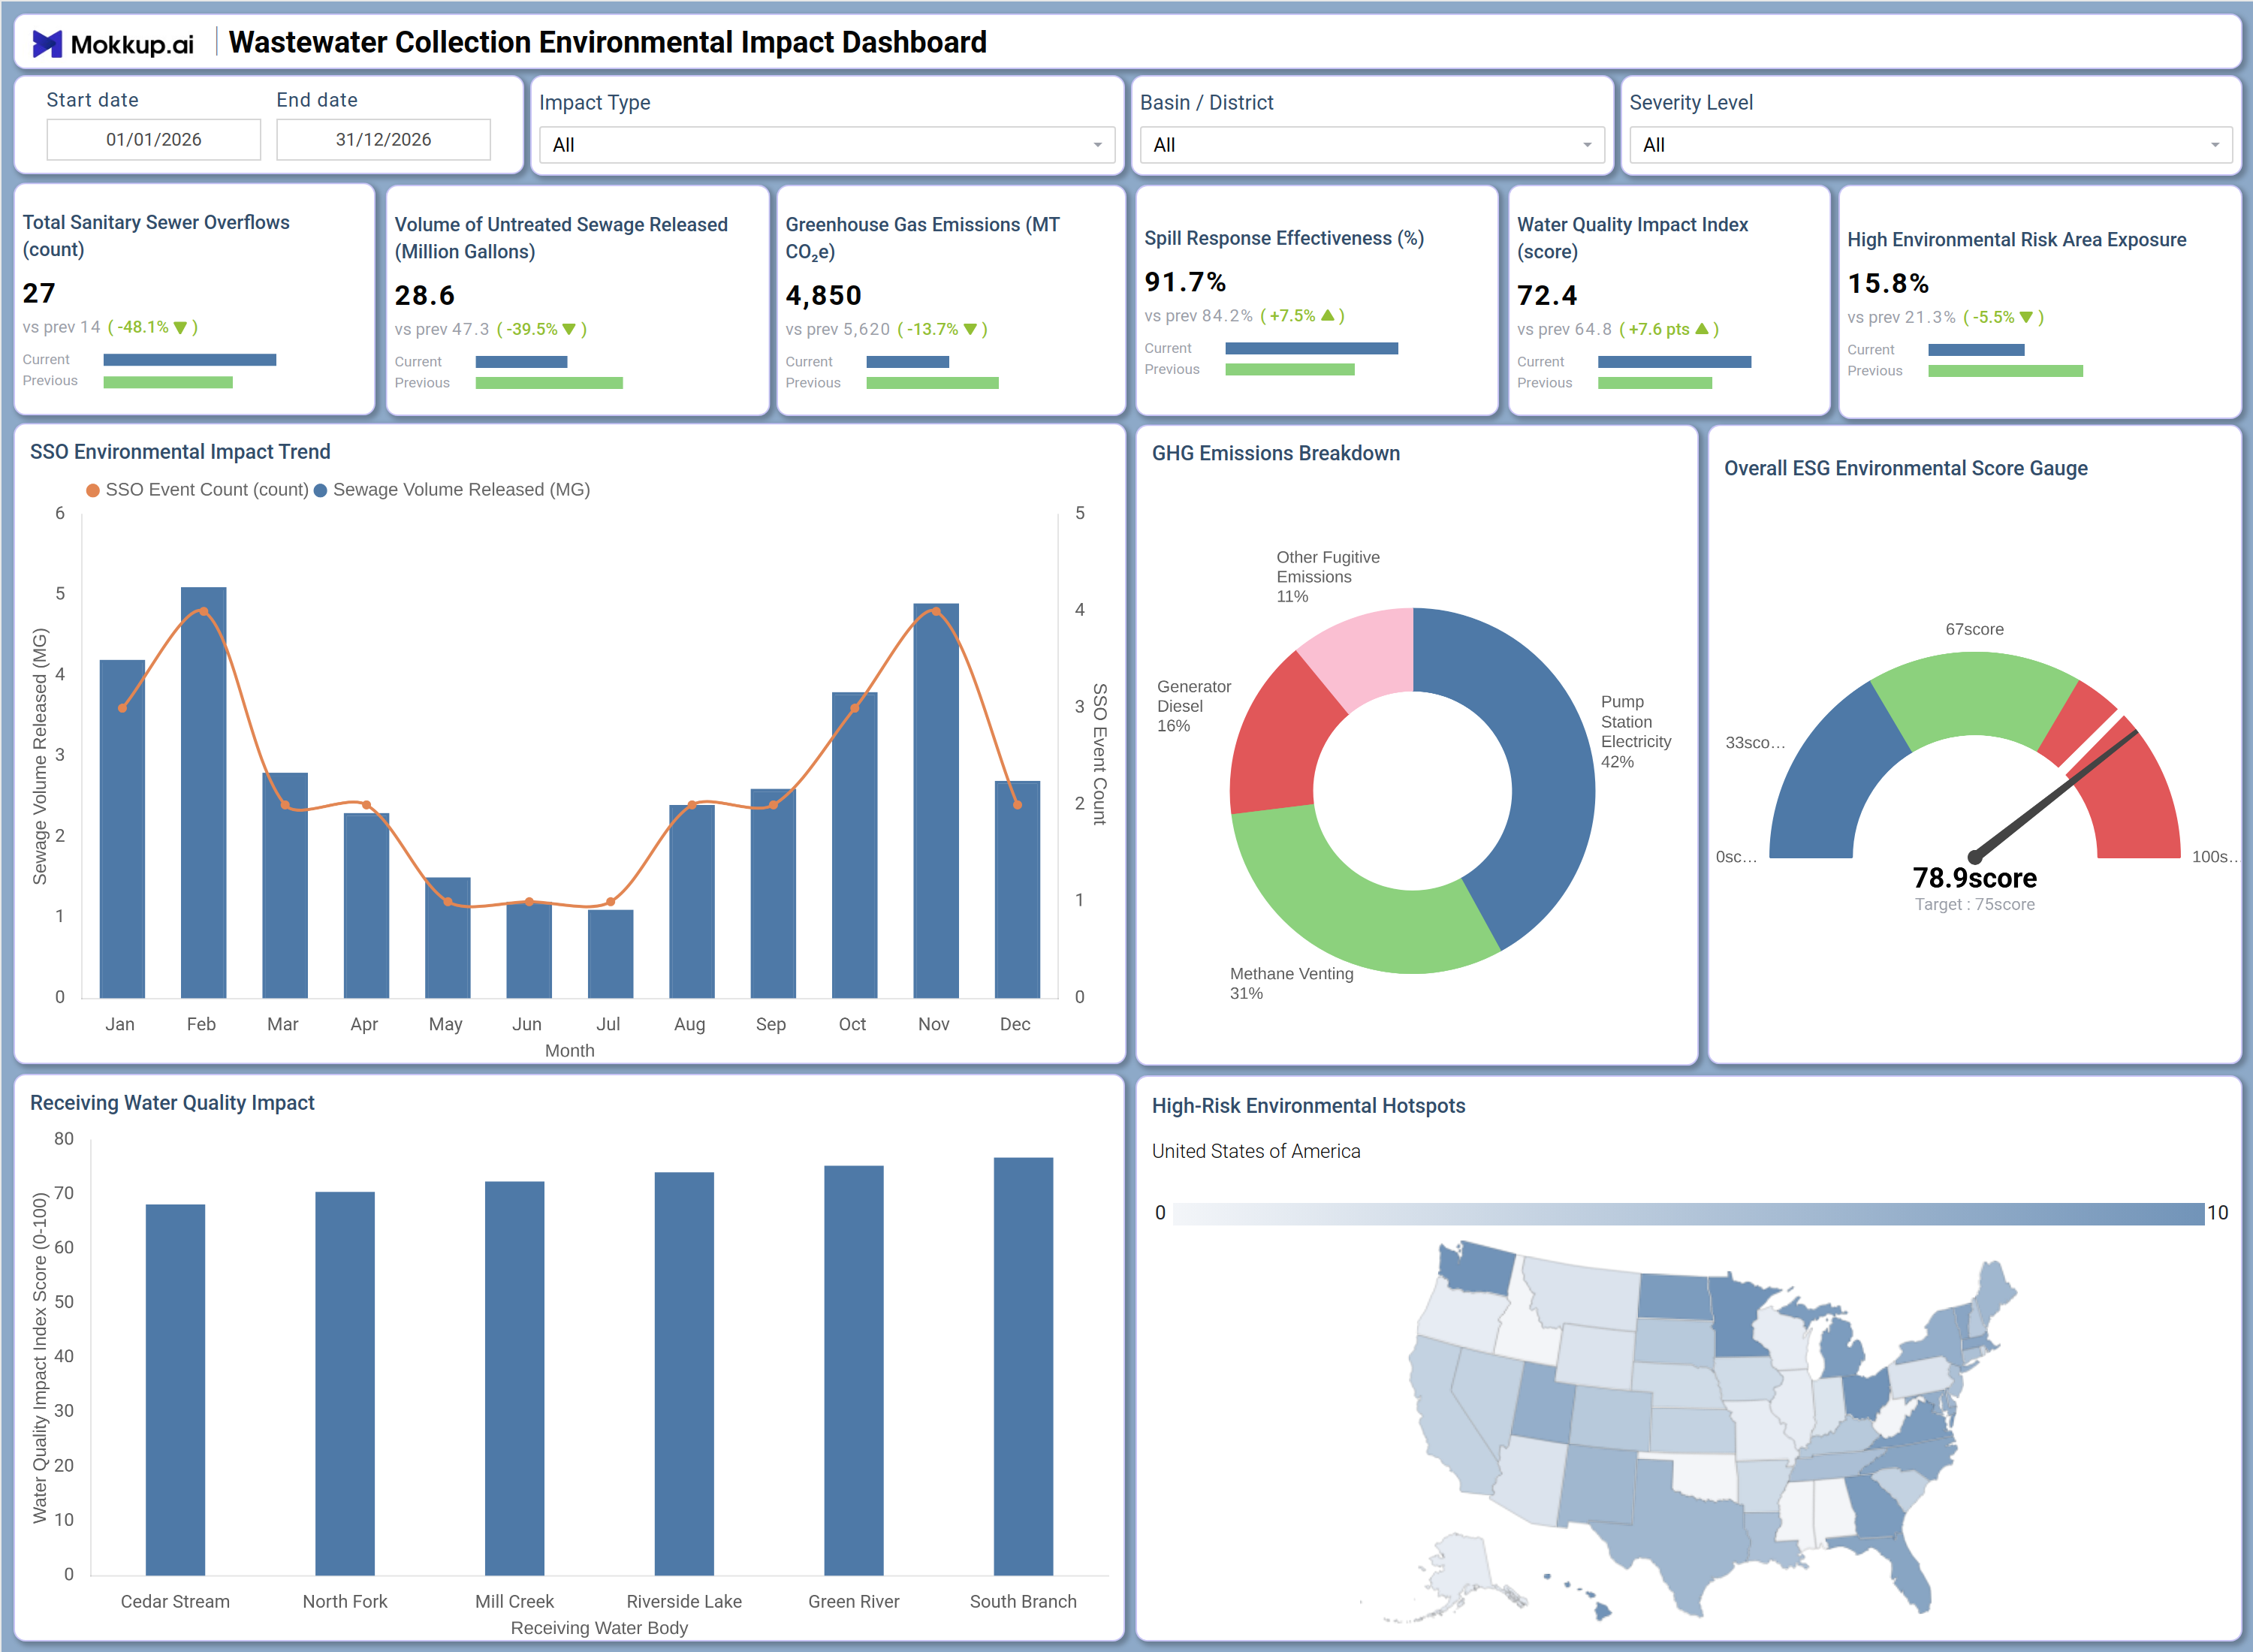
An environmental compliance officer opens this dashboard before a quarterly regulatory review to assess how the collection network performed across the year. Using the SSO Environmental Impact Trend, they can identify months where overflow counts spiked alongside elevated sewage volumes, then cross-reference those periods with spill response effectiveness scores to determine whether field response kept pace with incident volume. The GHG Emissions Breakdown supports greenhouse gas emissions wastewater management by showing which emission sources — pump station electricity, methane venting, generator diesel, or other fugitive emissions — account for the largest share of the total footprint, helping teams prioritize abatement actions. The Receiving Water Quality Impact bar chart allows planners to compare impact scores across specific water bodies, while the High-Risk Environmental Hotspots map surfaces which geographic areas carry concentrated environmental exposure, giving leadership the geographic context needed to allocate remediation resources efficiently.
How to Analyze Data in a Wastewater Collection Environmental Impact Dashboard
Here is how you can analyze data from this dashboard:
- Use the Basin / District filter to isolate overflow and emissions data for specific service zones and compare environmental performance across collection areas.
- Monitor the SSO Environmental Impact Trend combo chart to detect months where sewage volume released and SSO event counts rise together, signaling potential infrastructure strain.
- Review the GHG Emissions Breakdown donut chart to assess which emission source category dominates and apply greenhouse gas emissions wastewater management priorities accordingly.
- Track the Spill Response Effectiveness KPI over filtered time periods to measure whether incident response rates improve following crew deployment changes.
- Use the Receiving Water Quality Impact bar chart to identify which receiving water bodies — Cedar Stream, North Fork, Mill Creek, Roanoke Lake, Green River, or South Branch — carry the highest impact scores.
- Analyze the Overall ESG Environmental Score Gauge against the target line to determine whether the collection network is meeting sustainability benchmarks.
- Filter by Severity Level to focus the view on high-severity incidents and prioritize resource allocation in the most at-risk areas.
- Use the High-Risk Environmental Hotspots map to identify geographic concentrations of environmental exposure and align field inspection schedules to those regions.
Benefits of a Wastewater Collection Environmental Impact Dashboard
The following are the benefits of using this dashboard:
- Centralizes SSO counts, sewage volume, GHG emissions, and spill response metrics across collection basins into one structured template.
- Supports sanitary sewer overflow tracking software workflows by combining event count trends with volume data in a single combo chart.
- Reduces manual data compilation for environmental compliance reporting with pre-built KPI tiles covering all critical wastewater impact categories.
- Enables basin-level and district-level analysis of water quality impact index dashboard data to guide infrastructure and maintenance decisions.
- Provides a geographic hotspot map of high-risk areas across the United States for operational risk prioritization.
- Serves as an ESG environmental score monitoring tool, helping sustainability teams align collection system data with ESG score targets and reporting frameworks.
- Gives compliance managers and operations leads a shared view of emission breakdowns, spill response rates, and receiving water outcomes.
KPIs to Track in a Wastewater Collection Environmental Impact Dashboard
The following key KPIs can be tracked by using this dashboard:
- Total Sanitary Sewer Overflows (Count): Measures the number of untreated sewage release events across the collection network — a primary indicator tracked in any wastewater collection environmental impact dashboard for regulatory compliance.
- Volume of Untreated Sewage Released (Million Gallons): Quantifies the total sewage discharged without treatment, supporting untreated sewage spill response tracking by correlating volume with event frequency.
- Greenhouse Gas Emissions (MT CO2e): Tracks combined carbon dioxide equivalent emissions from collection system operations — central to greenhouse gas emissions, wastewater management, and ESG disclosures.
- Spill Response Effectiveness (%): Measures the percentage of overflow incidents addressed within defined response windows — a key operational metric for sanitary sewer overflow tracking software analysis.
- Water Quality Impact Index (Score): A composite score measuring environmental degradation to receiving water bodies — the core metric in any water quality impact index dashboard used by environmental compliance teams.
- High Environmental Risk Area Exposure (%): Measures the share of collection network assets located in high-risk environmental zones — this KPI feeds directly into the ESG environmental score monitoring tool used by sustainability teams for remediation planning and regulatory disclosure.
Frequently Asked Questions
1. What industries benefit most from the Wastewater Collection Environmental Impact Dashboard?
Municipal utility operators, wastewater authority compliance teams, and environmental consulting firms benefit most. It is also used by ESG reporting leads at water utilities and regional regulators who oversee collection system performance.
2. Can this dashboard track greenhouse gas emissions by source type?
Yes. The GHG Emissions Breakdown donut chart segments total emissions into pump station electricity, methane venting, generator diesel, and other fugitive emissions, giving teams a clear view of each source category.
3. Is this dashboard suitable for regulatory compliance reporting?
Yes. The dashboard tracks SSO event counts, untreated sewage volumes, spill response effectiveness, and water quality impact scores — the key metrics required for environmental compliance documentation and agency submissions.