What is a Solar Power Plant ESG Monitoring Dashboard?
A Solar Power Plant ESG Monitoring Dashboard is a digital system designed to track environmental, social, and governance (ESG) performance across solar power operations. It consolidates data related to energy generation, water usage, emissions avoided, safety incidents, policy adherence, and community impact into a single visual platform. By integrating solar farm ESG performance tracking, ESG compliance monitoring for renewables, and sustainability metrics for solar plants, the dashboard helps plant operators maintain transparency, optimize resource usage, and meet stakeholder expectations. The dashboard acts as a central tool for tracking safety trends, evaluating solar energy generation efficiency, and identifying areas in social and governance practices that require corrective or preventive actions.
How to Create a Solar Power Plant ESG Monitoring Dashboard
You don’t need to build your report from scratch—just start with a ready-to-use Solar power plant ESG monitoring dashboard template from Mokkup. Add in your data and export it however you like. Here’s how to do it:
1. Create or Log in to Your Mokkup Account
Start by signing up on Mokkup.ai using your email. If you already have an account, just log in, and you’ll be good to go.
2. Choose and Customize Your Dashboard Template
Find the Solar Power Plant ESG Monitoring Dashboard template in the Templates section. Use the drag-and-drop editor to adjust KPIs, edit filters, or add elements based on your data.
3. Export to Your BI Tool
Once your dashboard wireframe is ready, use the BI Tool Export feature to send it directly to Power BI or Tableau for further analysis and enhancements. You can also download the dashboard as a PDF, PNG, or JPEG, embed it on a platform, or invite your team to collaborate.
Note: This is a Pro template. You’ll need a Pro subscription on Mokkup to use and customize this dashboard wireframe. Upgrade anytime to unlock full access.
Solar Power Plant ESG Monitoring Dashboard Example
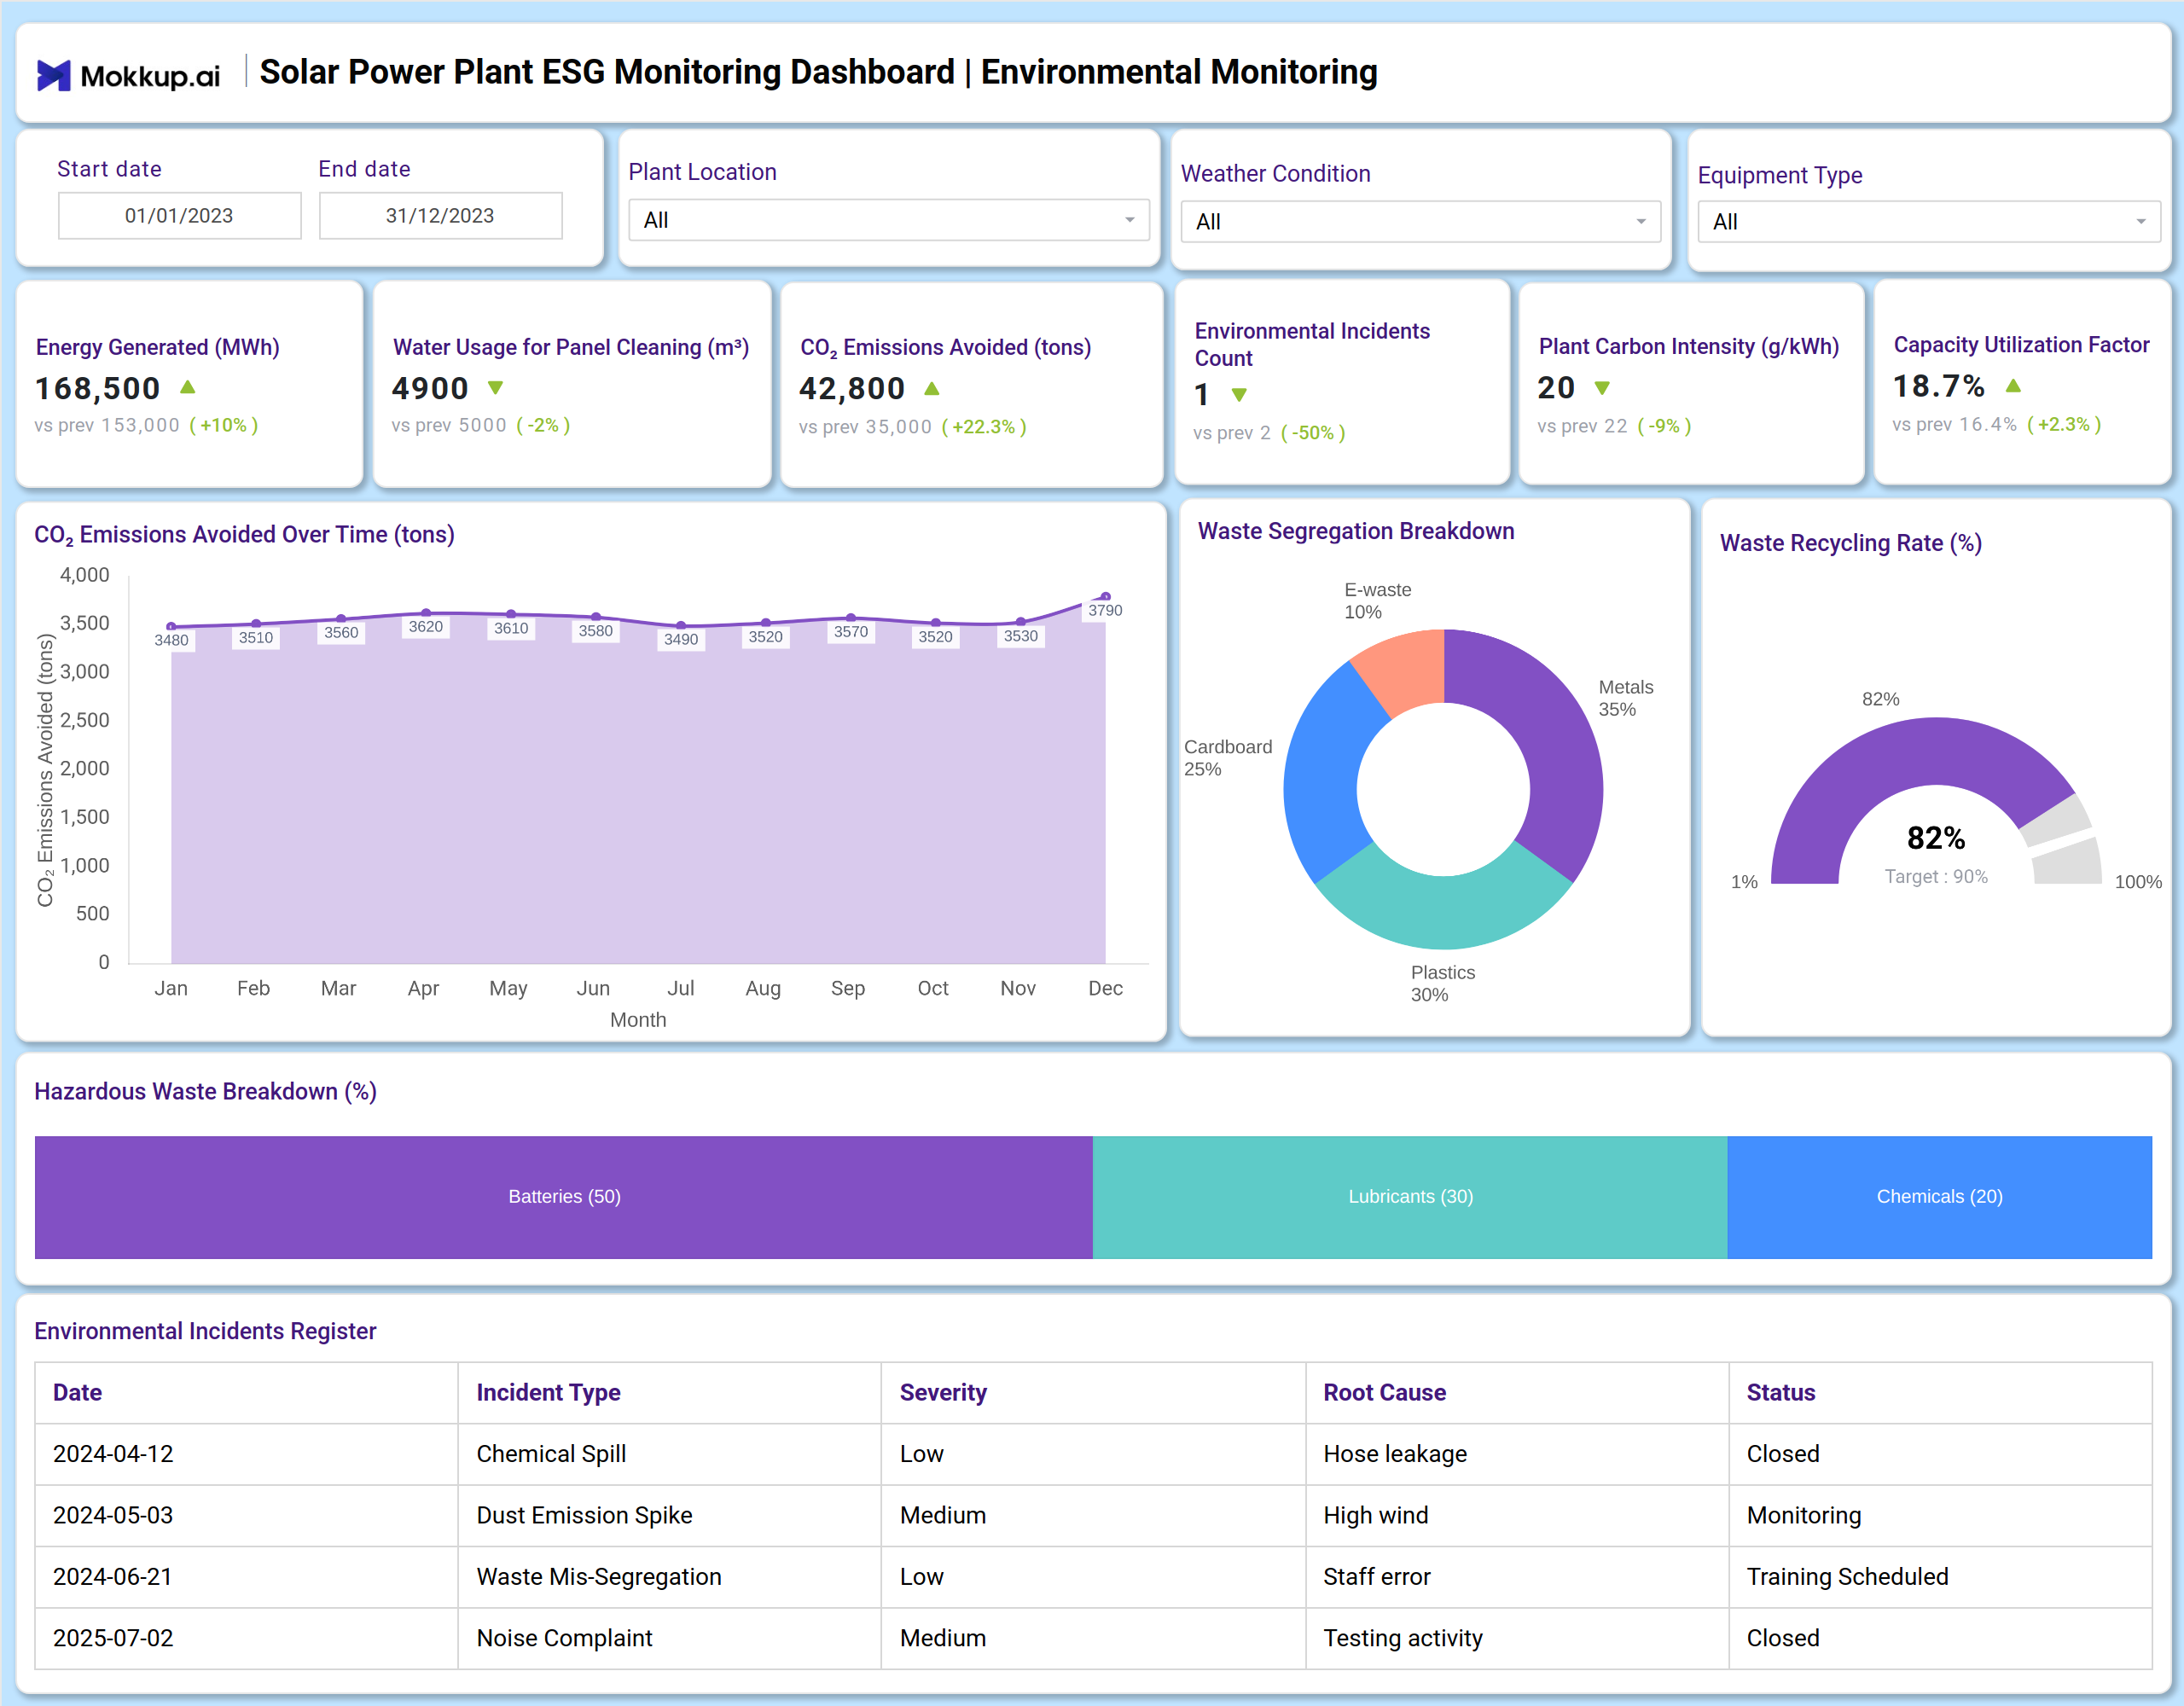
You can create a Solar Power Plant ESG Monitoring Dashboard that brings together environmental, social, and governance modules into a unified view. A typical dashboard includes the Environmental Monitoring section, where users can track energy generated, water usage, CO₂ emissions avoided, and environmental incidents. Visual charts help analyze waste segregation, monitor hazardous waste trends, and review an incident register for issues like chemical spills or dust emissions. The Social and Governance Monitoring dashboard builds on this by displaying safety incident counts, Lost-Time Injury Frequency Rates, PPE compliance by department, and policy review completion. A detailed table logs audit findings, their severity, and corrective actions, while a pie chart illustrates the breakdown of audit findings by category, supporting strong governance and social responsibility reporting. Together, these modules deliver crucial solar facility ESG insights that help operators ensure safe and efficient energy use, maintain community trust, and uphold strong governance standards.
How to Analyze Data in Solar Power Plant ESG Monitoring Dashboard
Here is how you can analyze data from this dashboard:
- Review trends in Safety Incidents and Lost-Time Injury Frequency Rate to assess the effectiveness of workplace safety programs.
- Monitor PPE Compliance by Department to identify areas needing improved safety protocol adherence.
- Track Policy Review Completion and Audit Compliance Score to gauge the strength of corporate governance frameworks.
- Analyze Local Community Employment percentages to measure the social impact and community integration of the plant.
- Assess the Energy Generated (MWh) and Capacity Utilization Factor to evaluate solar energy generation efficiency.
- Compare Water Usage for Panel Cleaning to identify opportunities for resource conservation.
- Evaluate CO₂ Emissions Avoided to quantify the plant's positive environmental contribution.
- Scrutinize the Environmental Incidents Register and Audit Findings to prioritize corrective actions based on severity and root cause.
Benefits of Solar Power Plant ESG Monitoring Dashboard
The following are the benefits of using this dashboard:
- Provides centralized visibility into overall ESG performance across environmental, social, and governance pillars.
- Supports transparent ESG compliance monitoring for renewables for internal and external reporting.
- Improves decision-making with clear insights into safety, compliance, and environmental impact.
- Enhances risk management through early identification of safety and audit-related issues.
- Increases operational efficiency through solar energy generation efficiency and resource usage tracking.
- Strengthens governance and social responsibility reporting with data on policies, audits, and community employment.
- Reduces manual reporting workload with consolidated data aggregation.
- Ensures preparedness for audits and stakeholder reviews with organized records of incidents and compliance.
KPIs to Track in Solar Power Plant ESG Monitoring Dashboard
The following key KPIs can be tracked by using this dashboard:
- Energy Generated (MWh): The total megawatt-hours of electricity produced by the solar plant.
- Water Usage for Panel Cleaning (m³): The volume of water consumed to maintain panel efficiency.
- CO₂ Emissions Avoided (tons): The estimated amount of carbon dioxide emissions prevented by generating clean energy.
- Plant Carbon Intensity (g/kWh): The carbon emissions per unit of electricity generated.
- Environmental Incidents Count: The number of reported events with a negative environmental impact.
- Waste Recycling Rate (%): The percentage of total waste that is recycled versus sent to landfill.
- Safety Incidents (count): The total number of reported safety-related events.
- Lost-Time Injury Frequency Rate: The number of lost-time injuries per million hours worked.
- Policy Review Completion (%): The percentage of company policies that have been reviewed within the scheduled cycle.
- Audit Compliance Score (%): An overall score reflecting adherence to standards during internal/external audits.
Frequently Asked Questions
1. What is the purpose of a solar ESG dashboard?
It helps monitor environmental impact, track social metrics like safety and community employment, and oversee governance aspects like policy reviews and audit compliance.
2. Can the dashboard support regulatory audits?
Yes. It consolidates key ESG data on safety, environmental incidents, and audit findings required for compliance reporting.
3. How does the dashboard improve ESG performance?
It provides insights into energy efficiency, safety performance, resource optimization, and governance effectiveness.
4. Does it track community and social metrics?
Yes. It monitors key social indicators like local employment rates and safety performance.
5. Who uses this dashboard?
Plant managers, ESG officers, health and safety managers, compliance teams, and community relations managers.