
What is a Wastewater Collection Customer Service Performance Dashboard?
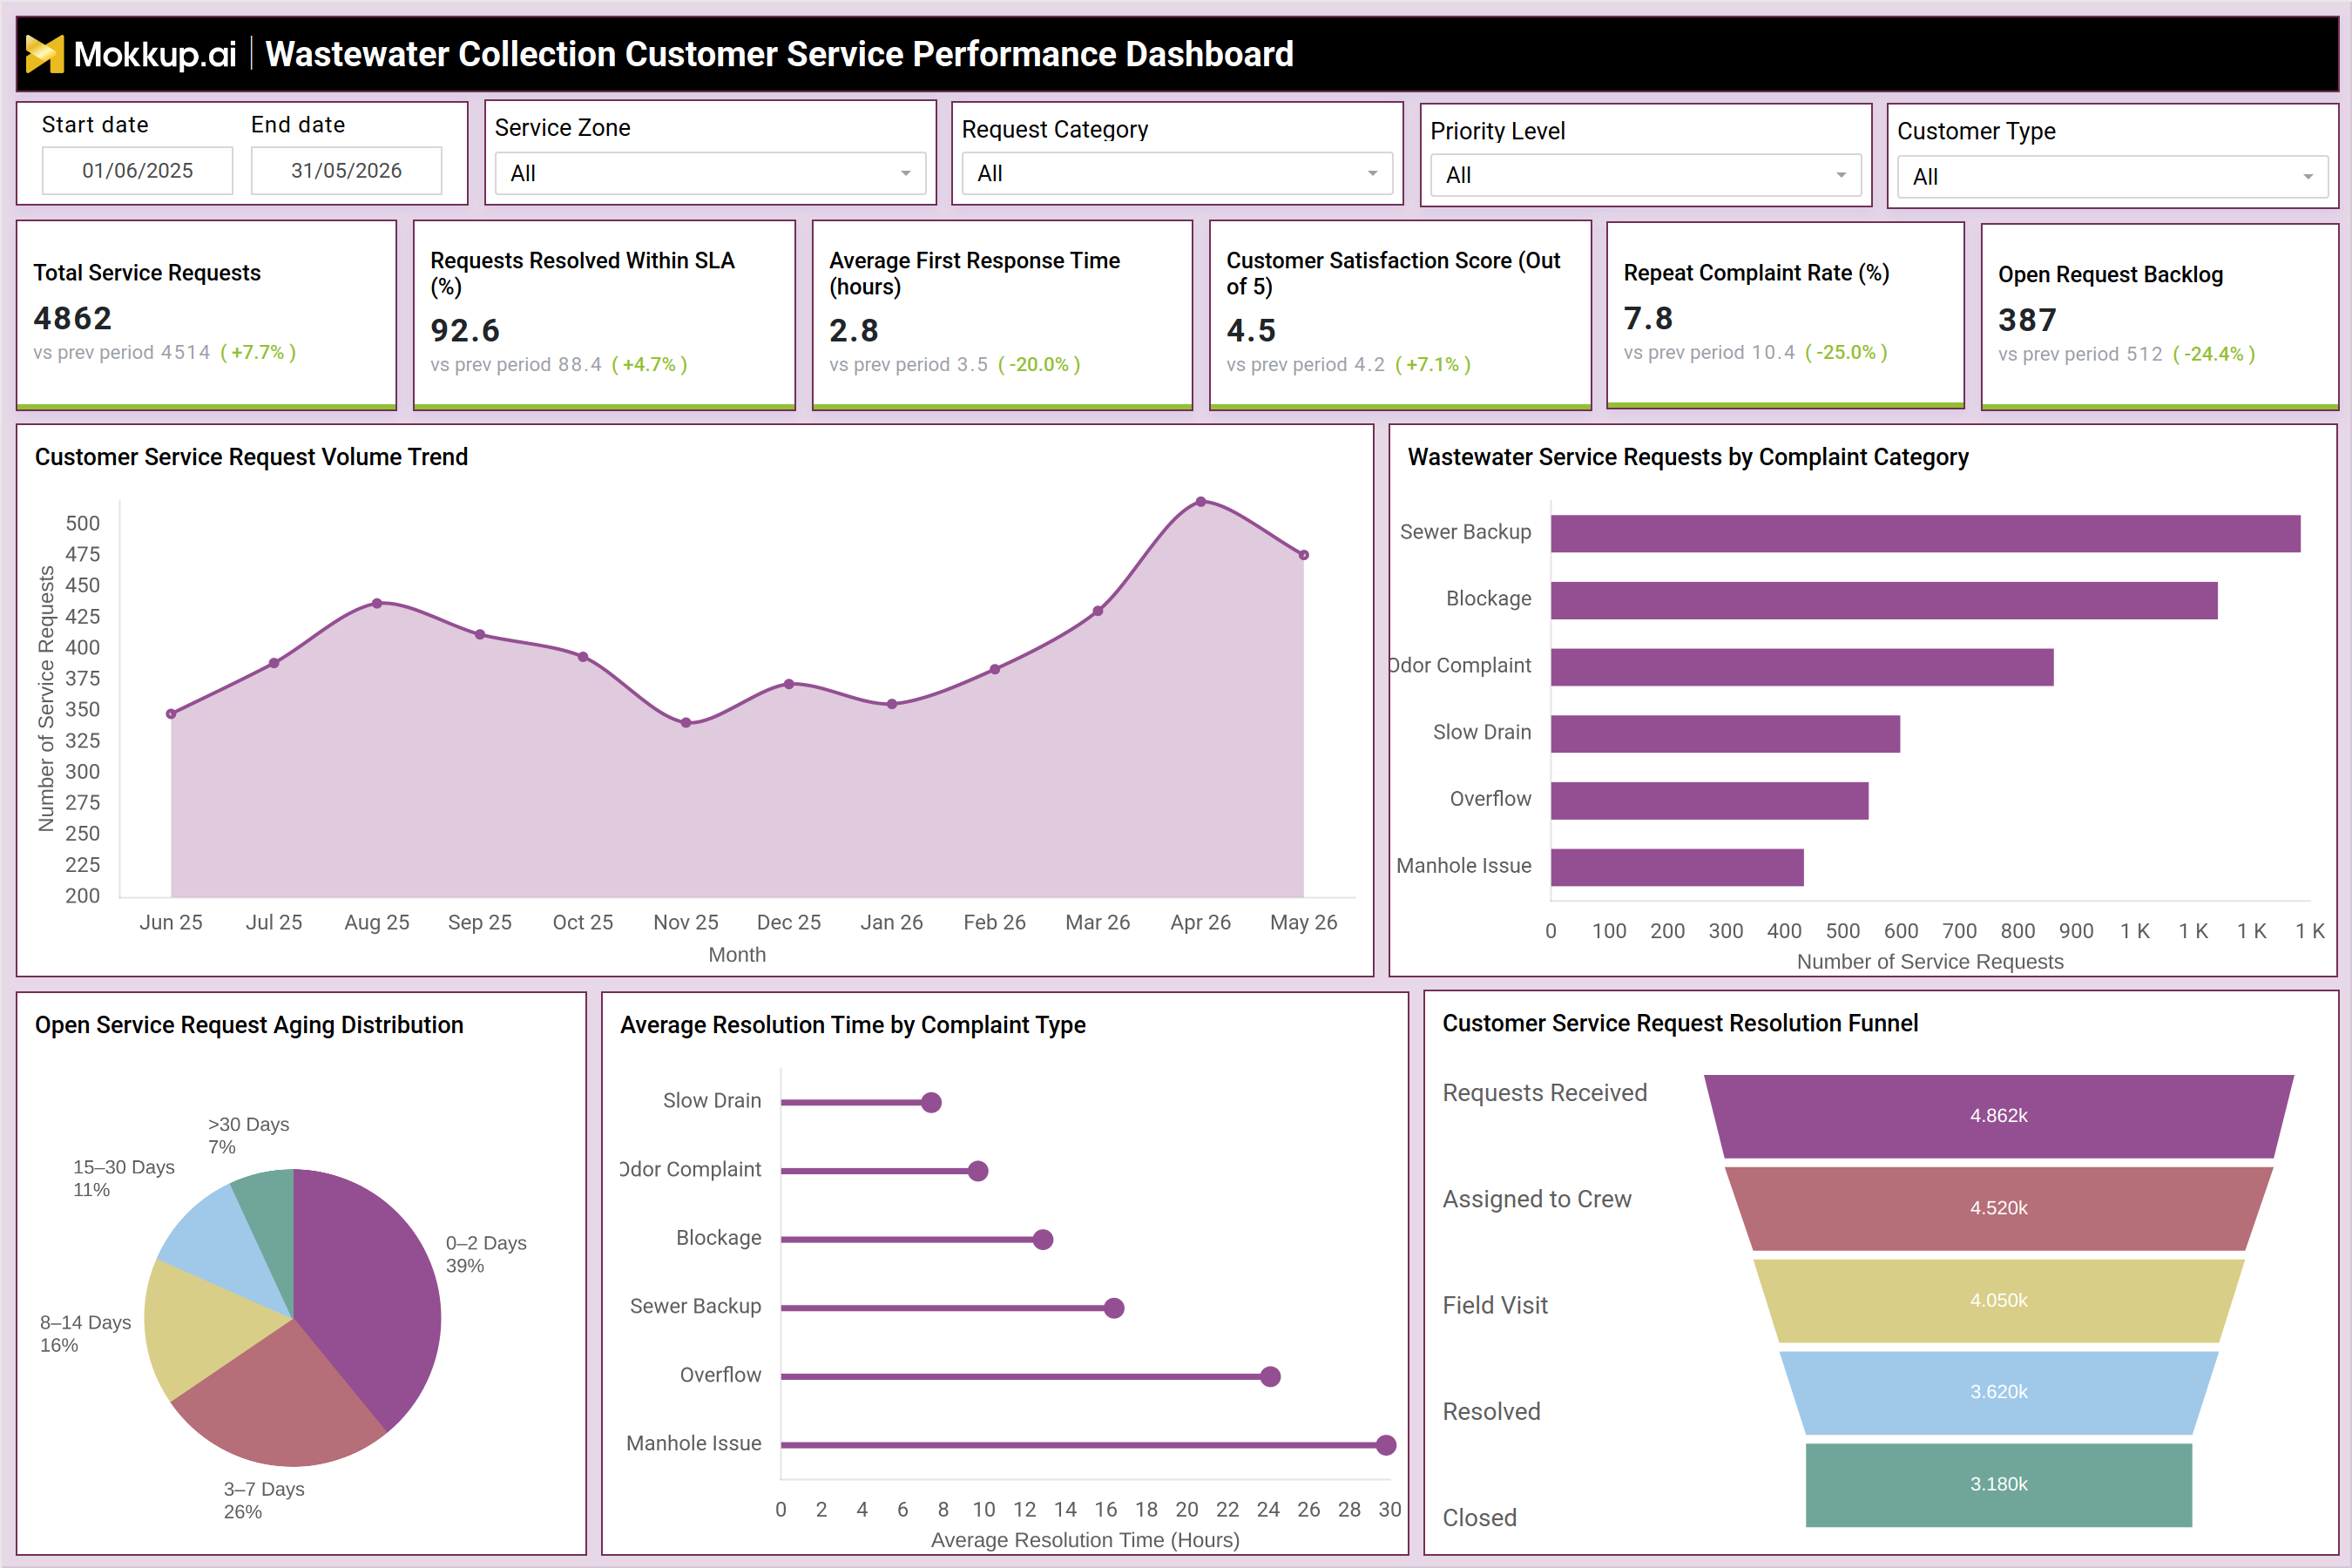
The Wastewater Collection Customer Service Performance Dashboard is an analytics template designed for municipal utilities and wastewater service operators who need to track complaint intake, resolution efficiency, and customer satisfaction in a single view. It covers the full customer service lifecycle from logging a service request to closing it and provides visibility into SLA compliance, first response time, and repeat complaint rates. Unlike generic service desk reports, this customer satisfaction score wastewater service template is built around the specific complaint categories and workflows that define wastewater collection: sewer backup incidents, drainage blockages, odor complaints, slow drain issues, overflows, and manhole problems. Operations managers and customer service leads can use it to compare performance across periods, identify recurring issues by complaint type, and spot where requests are getting stuck before they affect public confidence in service delivery.
How to Create a Wastewater Collection Customer Service Performance Dashboard
You don't need to build your report from scratch; just start with a ready-to-use dashboard template from Mokkup. Add in your data and export it however you like. Here's how to do it:
1. Create or Log in to Your Mokkup Account
Start by signing up on Mokkup.ai using your email. If you already have an account, just log in, and you'll be good to go.
2. Choose and Customize Your Dashboard Template
Find the Wastewater Collection Customer Service Performance Dashboard template in the Templates section. Use the drag-and-drop editor to adjust KPIs, edit filters, or add elements based on your data.
3. Export to Your BI Tool
Once your dashboard wireframe is ready, use the BI Tool Export feature to send it directly to Power BI or Tableau for further analysis and enhancements. You can also download the dashboard as a PDF, PNG, or JPEG, embed it on a platform, or invite your team to collaborate.
Note: This is a Pro template. You'll need a Pro subscription on Mokkup to use and customize this dashboard wireframe. Upgrade anytime to unlock full access.
Wastewater Collection Customer Service Performance Dashboard Example
A customer service supervisor at a municipal wastewater utility opens this dashboard to assess how the team performed against service commitments during the current period. The overview immediately surfaces whether total service volumes are up or down versus the prior period, and whether the share of requests resolved within SLA is holding above target. Filters for service zone, customer type, and priority level let the supervisor narrow the view within seconds — focusing on high-priority residential complaints or specific geographic zones before any formal reporting begins. The complaint category chart shows which issue types generate the most demand, while the average resolution time chart reveals which categories take the longest to close.
This combination supports wastewater complaint resolution time analysis that helps operations leads decide where to deploy additional crew and where to investigate structural causes. The resolution funnel shows exactly where service requests drop between crew assignment, field visit, resolution, and closure, making it straightforward to diagnose whether the gap is in field execution or case administration. The aging distribution shows how long open requests have been waiting. If the share of cases aged beyond seven days rises, that signals a resourcing gap or a classification bottleneck. The wastewater collection customer service performance dashboard integrates all of these views so teams can act on specific operational gaps rather than reacting to aggregate complaint trends.
How to Analyze Data in a Wastewater Collection Customer Service Performance Dashboard
Here is how you can analyze data from this dashboard:
- Filter by Service Zone to compare complaint volumes and SLA compliance across geographic areas
- Use the Customer Service Request Volume Trend line chart to detect seasonal spikes or month-over-month shifts in demand
- Rank complaint types by frequency using the Wastewater Service Requests by Complaint Category horizontal bar chart
- Conduct wastewater complaint resolution time analysis with the Average Resolution Time by Complaint Type chart to pinpoint categories that miss resolution targets
- Assess backlog health using the Open Service Request Aging Distribution donut chart to identify cases aged beyond acceptable thresholds
- Track the Customer Service Request Resolution Funnel to measure where service requests drop between intake and closure
- Segment by Customer Type and Priority Level to verify that high-priority complaints receive proportionally faster response
- Monitor Repeat Complaint Rate trends to assess whether resolution quality is improving across service periods
Benefits of a Wastewater Collection Customer Service Performance Dashboard
The following are the benefits of using this dashboard:
- Provides a unified sewer service request tracking dashboard covering intake, crew assignment, field visit, resolution, and closure
- Reduces manual reporting by consolidating complaint volume, SLA compliance, and satisfaction metrics in one template
- Enables period-over-period comparison across all six KPI tiles with directional change indicators
- Identifies high-frequency complaint categories so operations leads can align crew deployment to actual service demand
- Supports SLA accountability with municipal wastewater customer service KPI dashboard reporting built into the template
- Surfaces aging backlog trends early, before they escalate into repeat complaints or formal service escalations
- Gives customer service teams clear visual evidence to explain service performance to utility management
KPIs to Track in a Wastewater Collection Customer Service Performance Dashboard
The following key KPIs can be tracked by using this dashboard:
- Total Service Requests - measures the overall volume of customer complaints and service requests logged in the selected period
- Requests Resolved Within SLA (%) - tracks the share of requests resolved within the committed timeframe; core to service request aging distribution wastewater utility benchmarking
- Average First Response Time (hours) - measures how quickly the service team acknowledges and initiates action on a new complaint
- Customer Satisfaction Score (Out of 5) - captures customer-rated satisfaction following resolution; primary indicator in any wastewater customer service analytics template
- Repeat Complaint Rate (%) - identifies the proportion of customers who re-reported the same issue, indicating unresolved root causes
- Open Request Backlog - tracks the count of pending service requests; used alongside the aging distribution to assess queue health and crew capacity
Frequently Asked Questions
1. What complaint categories are tracked in the Wastewater Collection Customer Service Performance Dashboard?
The dashboard tracks six complaint types: Sewer Backup, Blockage, Odor Complaint, Slow Drain, Overflow, and Manhole Issue. Each is shown with total request volume and average resolution time.
2. How does the resolution funnel work in this dashboard?
The funnel displays five stages: Requests Received, Assigned to Crew, Field Visit, Resolved, and Closed. It highlights where service requests drop off between stages so managers can identify and address processing gaps.
3. Can this dashboard be filtered by service zone or customer type?
Yes. The dashboard includes filters for Service Zone, Request Category, Priority Level, and Customer Type, allowing teams to drill into specific segments for targeted operational analysis.