
What is a Natural Gas Distribution Customer Service and SLA Performance Dashboard?
A natural gas customer service dashboard is a business intelligence solution designed to monitor, analyze, and improve customer service operations in gas distribution utilities. It tracks key service metrics such as complaint volumes, resolution times, SLA compliance, and customer satisfaction. This gas distribution SLA performance dashboard helps utilities ensure service commitments are met while identifying operational inefficiencies.
The dashboard integrates data from customer support systems, billing platforms, and operational logs to provide a unified view of service performance. Using a natural gas SLA monitoring dashboard, organizations can track service levels, identify bottlenecks, and improve response efficiency. It is critical for maintaining regulatory compliance, improving customer experience, and optimizing service delivery in gas utilities.
How to Create a Natural Gas Distribution Customer Service and SLA Performance Dashboard
You don’t need to build your report from scratch, just start with a ready-to-use Natural Gas Distribution Customer Service and SLA Performance dashboard template from Mokkup. Add in your data and export it however you like. Here’s how to do it:
1. Create or Log in to Your Mokkup Account
Start by signing up on Mokkup.ai using your email. If you already have an account, just log in, and you’ll be good to go.
2. Choose and Customize Your Dashboard Template
Find the Natural Gas Distribution Customer Service and SLA Performance Dashboard template in the Templates section. Use the drag-and-drop editor to adjust KPIs, edit filters, or add elements based on your data.
3. Export to Your BI Tool
Once your dashboard wireframe is ready, use the BI Tool Export feature to send it directly to Power BI or Tableau for further analysis and enhancements. You can also download the dashboard as a PDF, PNG, or JPEG, embed it on a platform, or invite your team to collaborate.
Note: This is a Pro template. You’ll need a Pro subscription on Mokkup to use and customize this dashboard wireframe. Upgrade anytime to unlock full access.
Natural Gas Distribution Customer Service and SLA Performance Dashboard Example
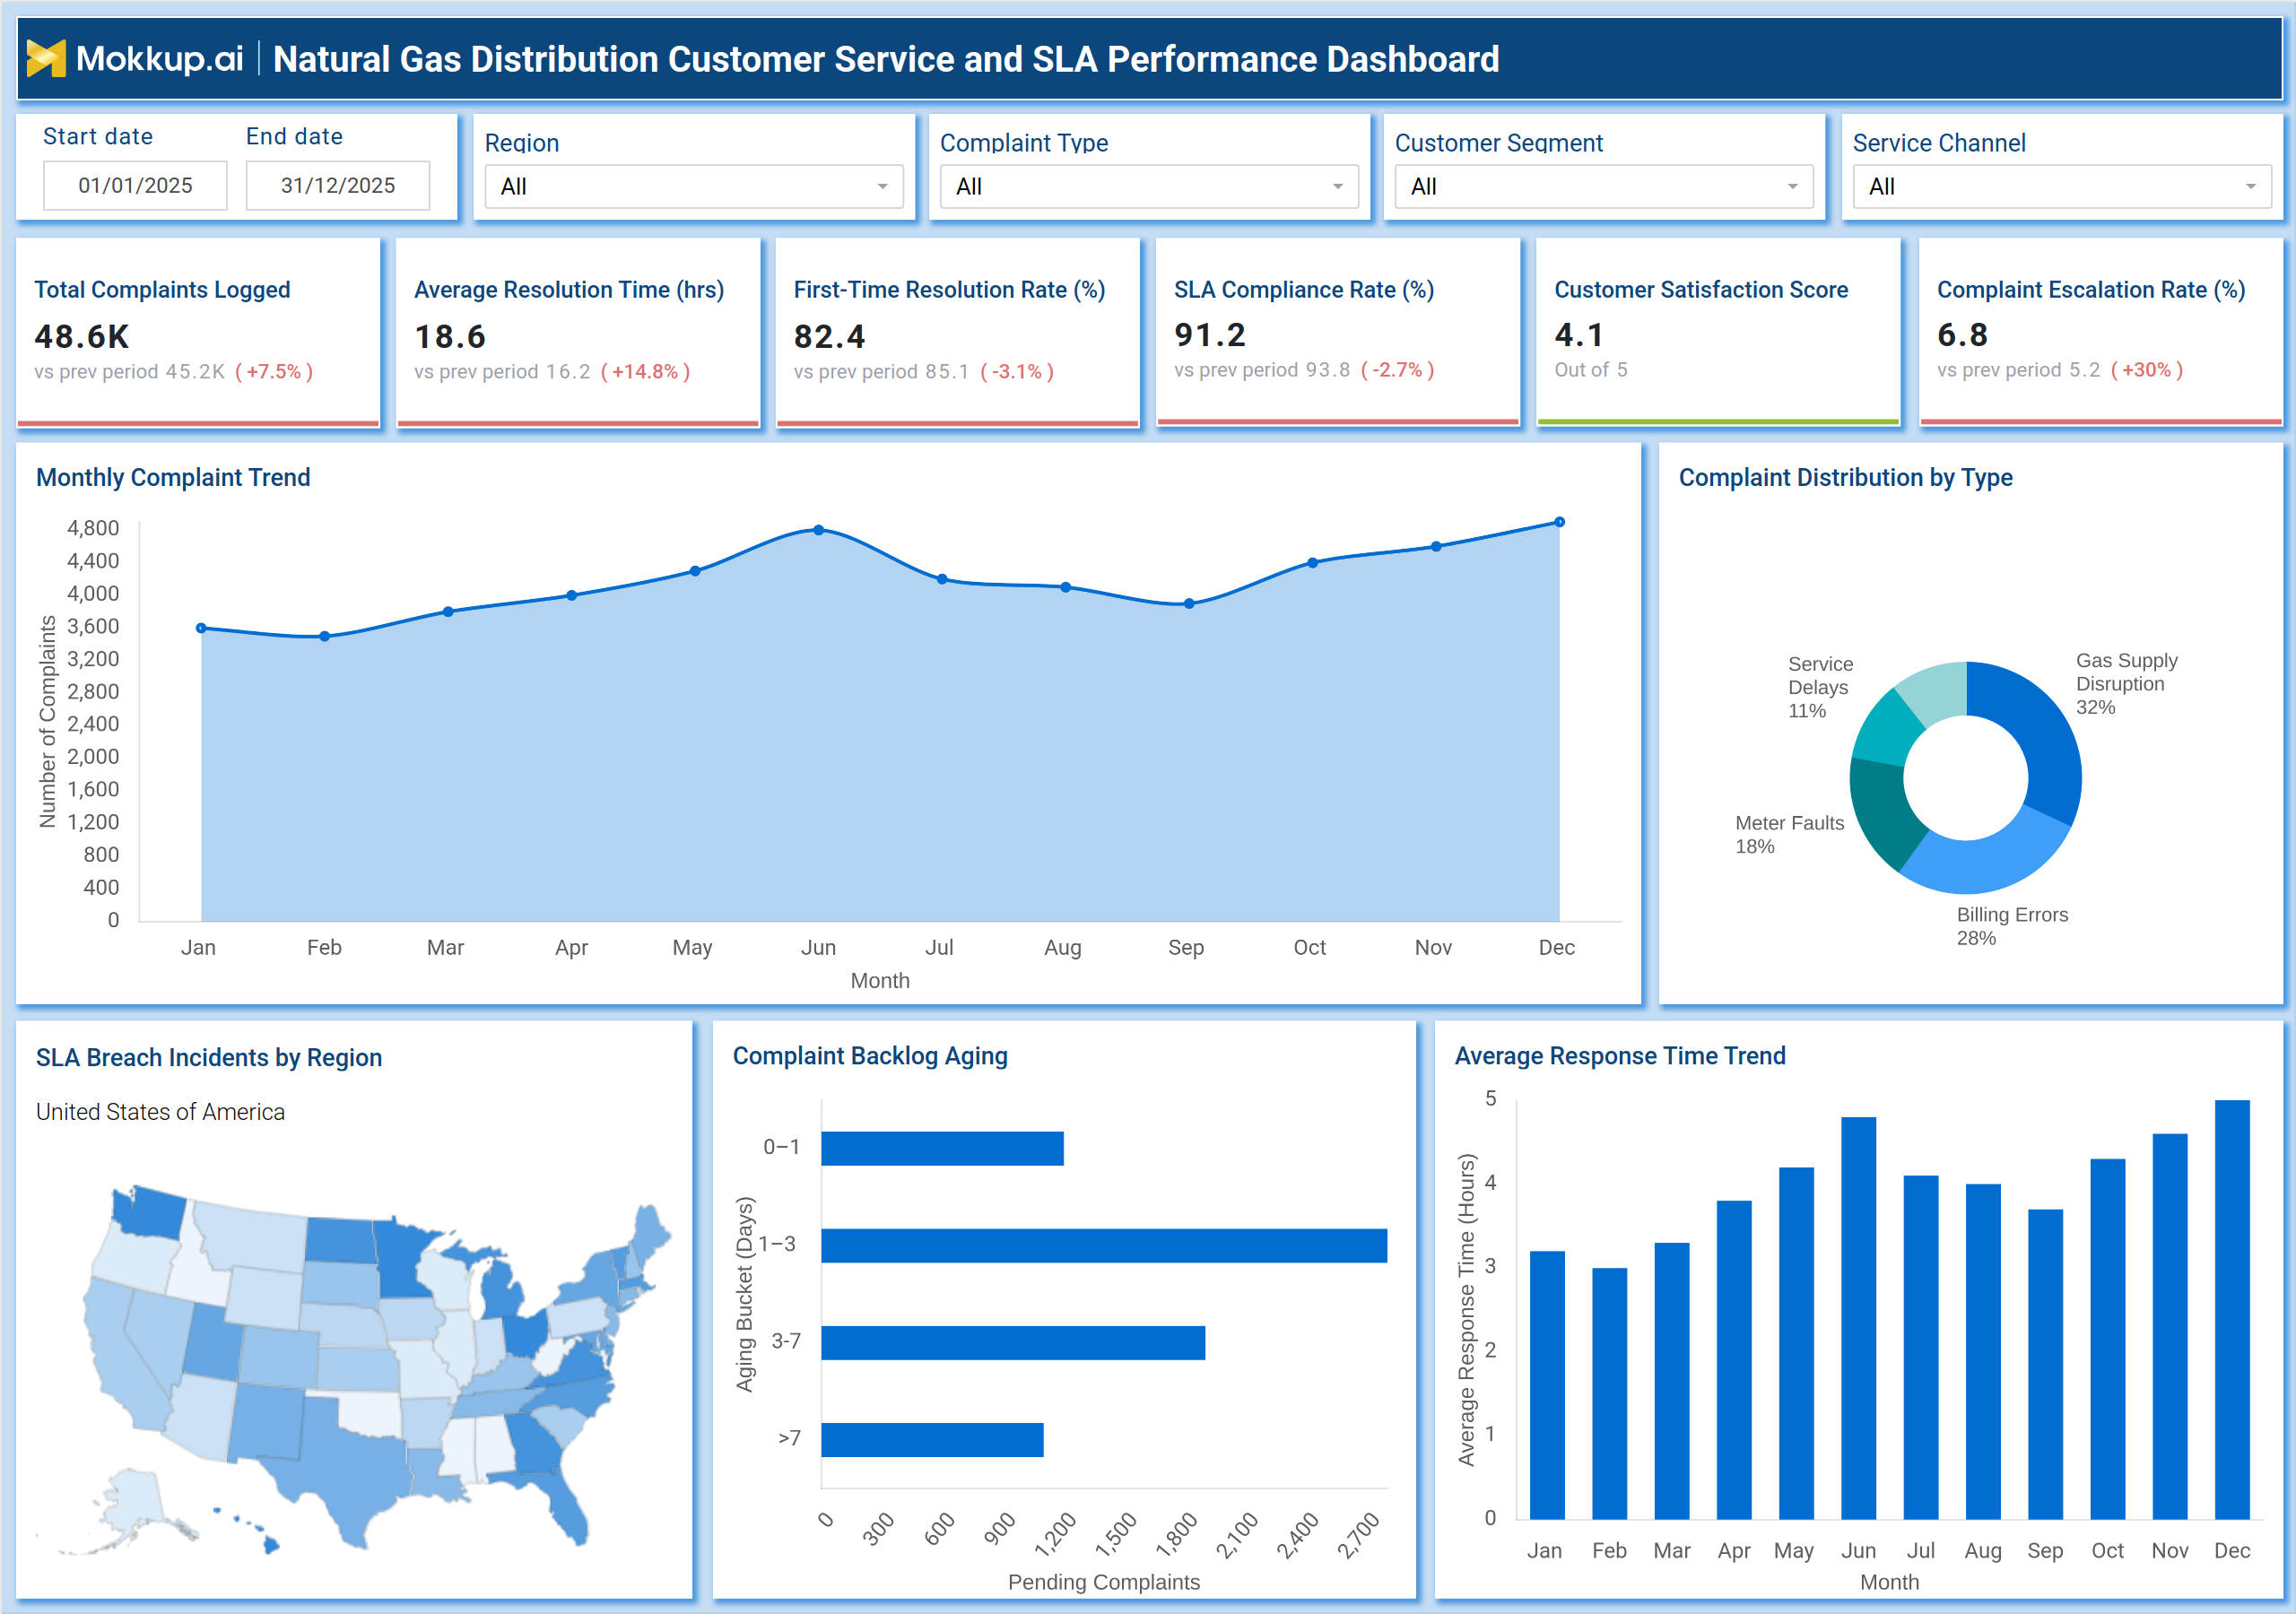
A typical gas utility service performance dashboard provides a structured view of customer service metrics across regions, complaint types, and service channels. For example, the dashboard highlights total complaints logged (48.6K), average resolution time (18.6 hours), and SLA compliance rate (91.2%). These KPIs indicate service efficiency and adherence to defined service standards. The dashboard also visualizes complaint trends over time, showing monthly fluctuations and peak periods. A complaint distribution chart categorizes issues such as gas supply disruptions, billing errors, and meter faults, helping identify high-impact problem areas. Regional SLA breach maps highlight areas with frequent service failures, enabling targeted interventions.
Operational insights are further enhanced with backlog aging analysis, showing pending complaints across time buckets, and response time trends, which track how quickly customer issues are addressed. This gas distribution customer experience dashboard ensures that service teams can proactively manage workloads and improve service outcomes.
How to Analyze Data in Natural Gas Distribution Customer Service and SLA Performance Dashboard
Here is how you can analyze data from this dashboard:
- Complaint Volume Analysis: Track total complaints logged to identify demand patterns and service pressure points.
- Resolution Time Monitoring: Analyze average resolution time trends to detect delays in issue handling.
- First-Time Resolution Evaluation: Monitor first-time resolution rate to assess service effectiveness.
- SLA Compliance Tracking: Evaluate SLA compliance rate to ensure contractual and regulatory adherence.
- Customer Satisfaction Review: Review customer satisfaction score trends to measure service quality.
- Complaint Type Analysis: Identify complaint distribution by type to prioritize operational improvements.
- Regional SLA Breach Analysis: Analyze SLA breach incidents by region to detect geographic inefficiencies.
- Backlog Aging Monitoring: Monitor complaint backlog aging to prevent delays and escalation risks.
- Response Time Tracking: Track response time trends to ensure timely customer engagement.
- Escalation Root Cause Analysis: Correlate escalation rates with resolution delays to identify underlying issues.
Benefits of Natural Gas Distribution Customer Service and SLA Performance Dashboard
The following are the benefits of using this dashboard:
- Service Visibility: Improves visibility across all customer service touchpoints.
- SLA Compliance Improvement: Enhances tracking and reduces regulatory risks.
- Faster Resolution: Enables quicker complaint handling through actionable insights.
- Reduced Escalations: Identifies delays early to minimize escalation rates.
- Data-Driven Operations: Supports informed decision-making for service teams.
- Customer Satisfaction Growth: Improves customer experience and retention.
- Inefficiency Identification: Highlights regional and operational performance gaps.
- Resource Optimization: Helps allocate support resources effectively.
- Accountability Strengthening: Improves service performance monitoring.
- Proactive Management: Enables forward-looking service optimization using analytics.
KPIs to Track in Natural Gas Distribution Customer Service and SLA Performance Dashboard
The following key KPIs can be tracked by using this dashboard:
- Total Complaints Logged: Measures total customer issues reported, indicating service demand and operational load
- Average Resolution Time (hrs): Tracks the time taken to resolve complaints, reflecting efficiency of service teams
- First-Time Resolution Rate (%): Indicates the percentage of issues resolved in the first interaction, showing service effectiveness
- SLA Compliance Rate (%): Measures adherence to predefined service-level agreements, critical for regulatory and contractual performance
- Customer Satisfaction Score (CSAT): Captures customer feedback on service quality, typically on a rating scale
- Complaint Escalation Rate (%): Tracks the percentage of issues escalated due to delays or poor resolution
- Monthly Complaint Trend: Analyzes complaint volume patterns over time to identify peak periods
- Complaint Distribution by Type: Categorizes complaints (e.g., supply issues, billing errors) to identify root causes
- SLA Breach Incidents by Region: Highlights regions with frequent SLA violations for targeted improvements
- Complaint Backlog Aging: Tracks pending complaints across aging buckets to manage delays
- Average Response Time Trend: Measures how quickly service teams respond to customer issues
Frequently Asked Questions
Q1. Why is a natural gas customer service dashboard important?
It helps utilities monitor service performance, ensure SLA compliance, and improve customer satisfaction using data insights.
Q2. How does a gas distribution SLA performance dashboard improve operations?
It identifies delays, tracks compliance, and highlights inefficiencies, enabling faster resolution and better service management.
Q3. What data sources are required for this dashboard?
Customer support systems, billing platforms, CRM tools, and operational service logs are typically integrated.