What is an Irrigation Network Expansion & Modernization Dashboard?
An Irrigation Network Expansion & Modernization Dashboard is a centralized analytics platform used to monitor irrigation infrastructure expansion projects, modernization initiatives, capital investments, and operational improvement programs. It helps irrigation authorities, water distribution agencies, and infrastructure management teams track expansion progress, modernization efficiency, budget utilization, and water distribution improvements across irrigation networks. This dashboard combines project monitoring KPIs, infrastructure upgrade analytics, budget tracking, modernization progress, and operational performance into a single management view. An irrigation network expansion and modernization dashboard helps organizations improve irrigation coverage, optimize infrastructure investments, and monitor modernization outcomes across operational zones.
The dashboard also functions as an irrigation infrastructure modernization analytics dashboard by helping teams evaluate project completion rates, commissioning performance, water loss reduction initiatives, and regional infrastructure expansion. It provides operational visibility into irrigation capacity development and modernization effectiveness. In addition, the solution acts as an irrigation network expansion performance monitoring dashboard by tracking planned versus actual spending, project delivery timelines, and operational asset commissioning activities. This helps utilities improve project execution efficiency and maintain infrastructure modernization targets.
How to Create an Irrigation Network Expansion & Modernization Dashboard
You don't need to build your report from scratch, just start with a ready-to-use dashboard template from Mokkup. Add in your data and export it however you like. Here's how to do it:
1. Create or Log in to Your Mokkup Account
Start by signing up on Mokkup.ai using your email. If you already have an account, just log in, and you'll be good to go.
2. Choose and Customize Your Dashboard Template
Find the Irrigation Network Expansion & Modernization Dashboard template in the Templates section. Use the drag-and-drop editor to adjust KPIs, edit filters, or add elements based on your data.
3. Export to Your BI Tool
Once your dashboard wireframe is ready, use the BI Tool Export feature to send it directly to Power BI or Tableau for further analysis and enhancements. You can also download the dashboard as a PDF, PNG, or JPEG, embed it on a platform, or invite your team to collaborate.
Note: This is a Pro template. You'll need a Pro subscription on Mokkup to use and customize this dashboard wireframe. Upgrade anytime to unlock full access.
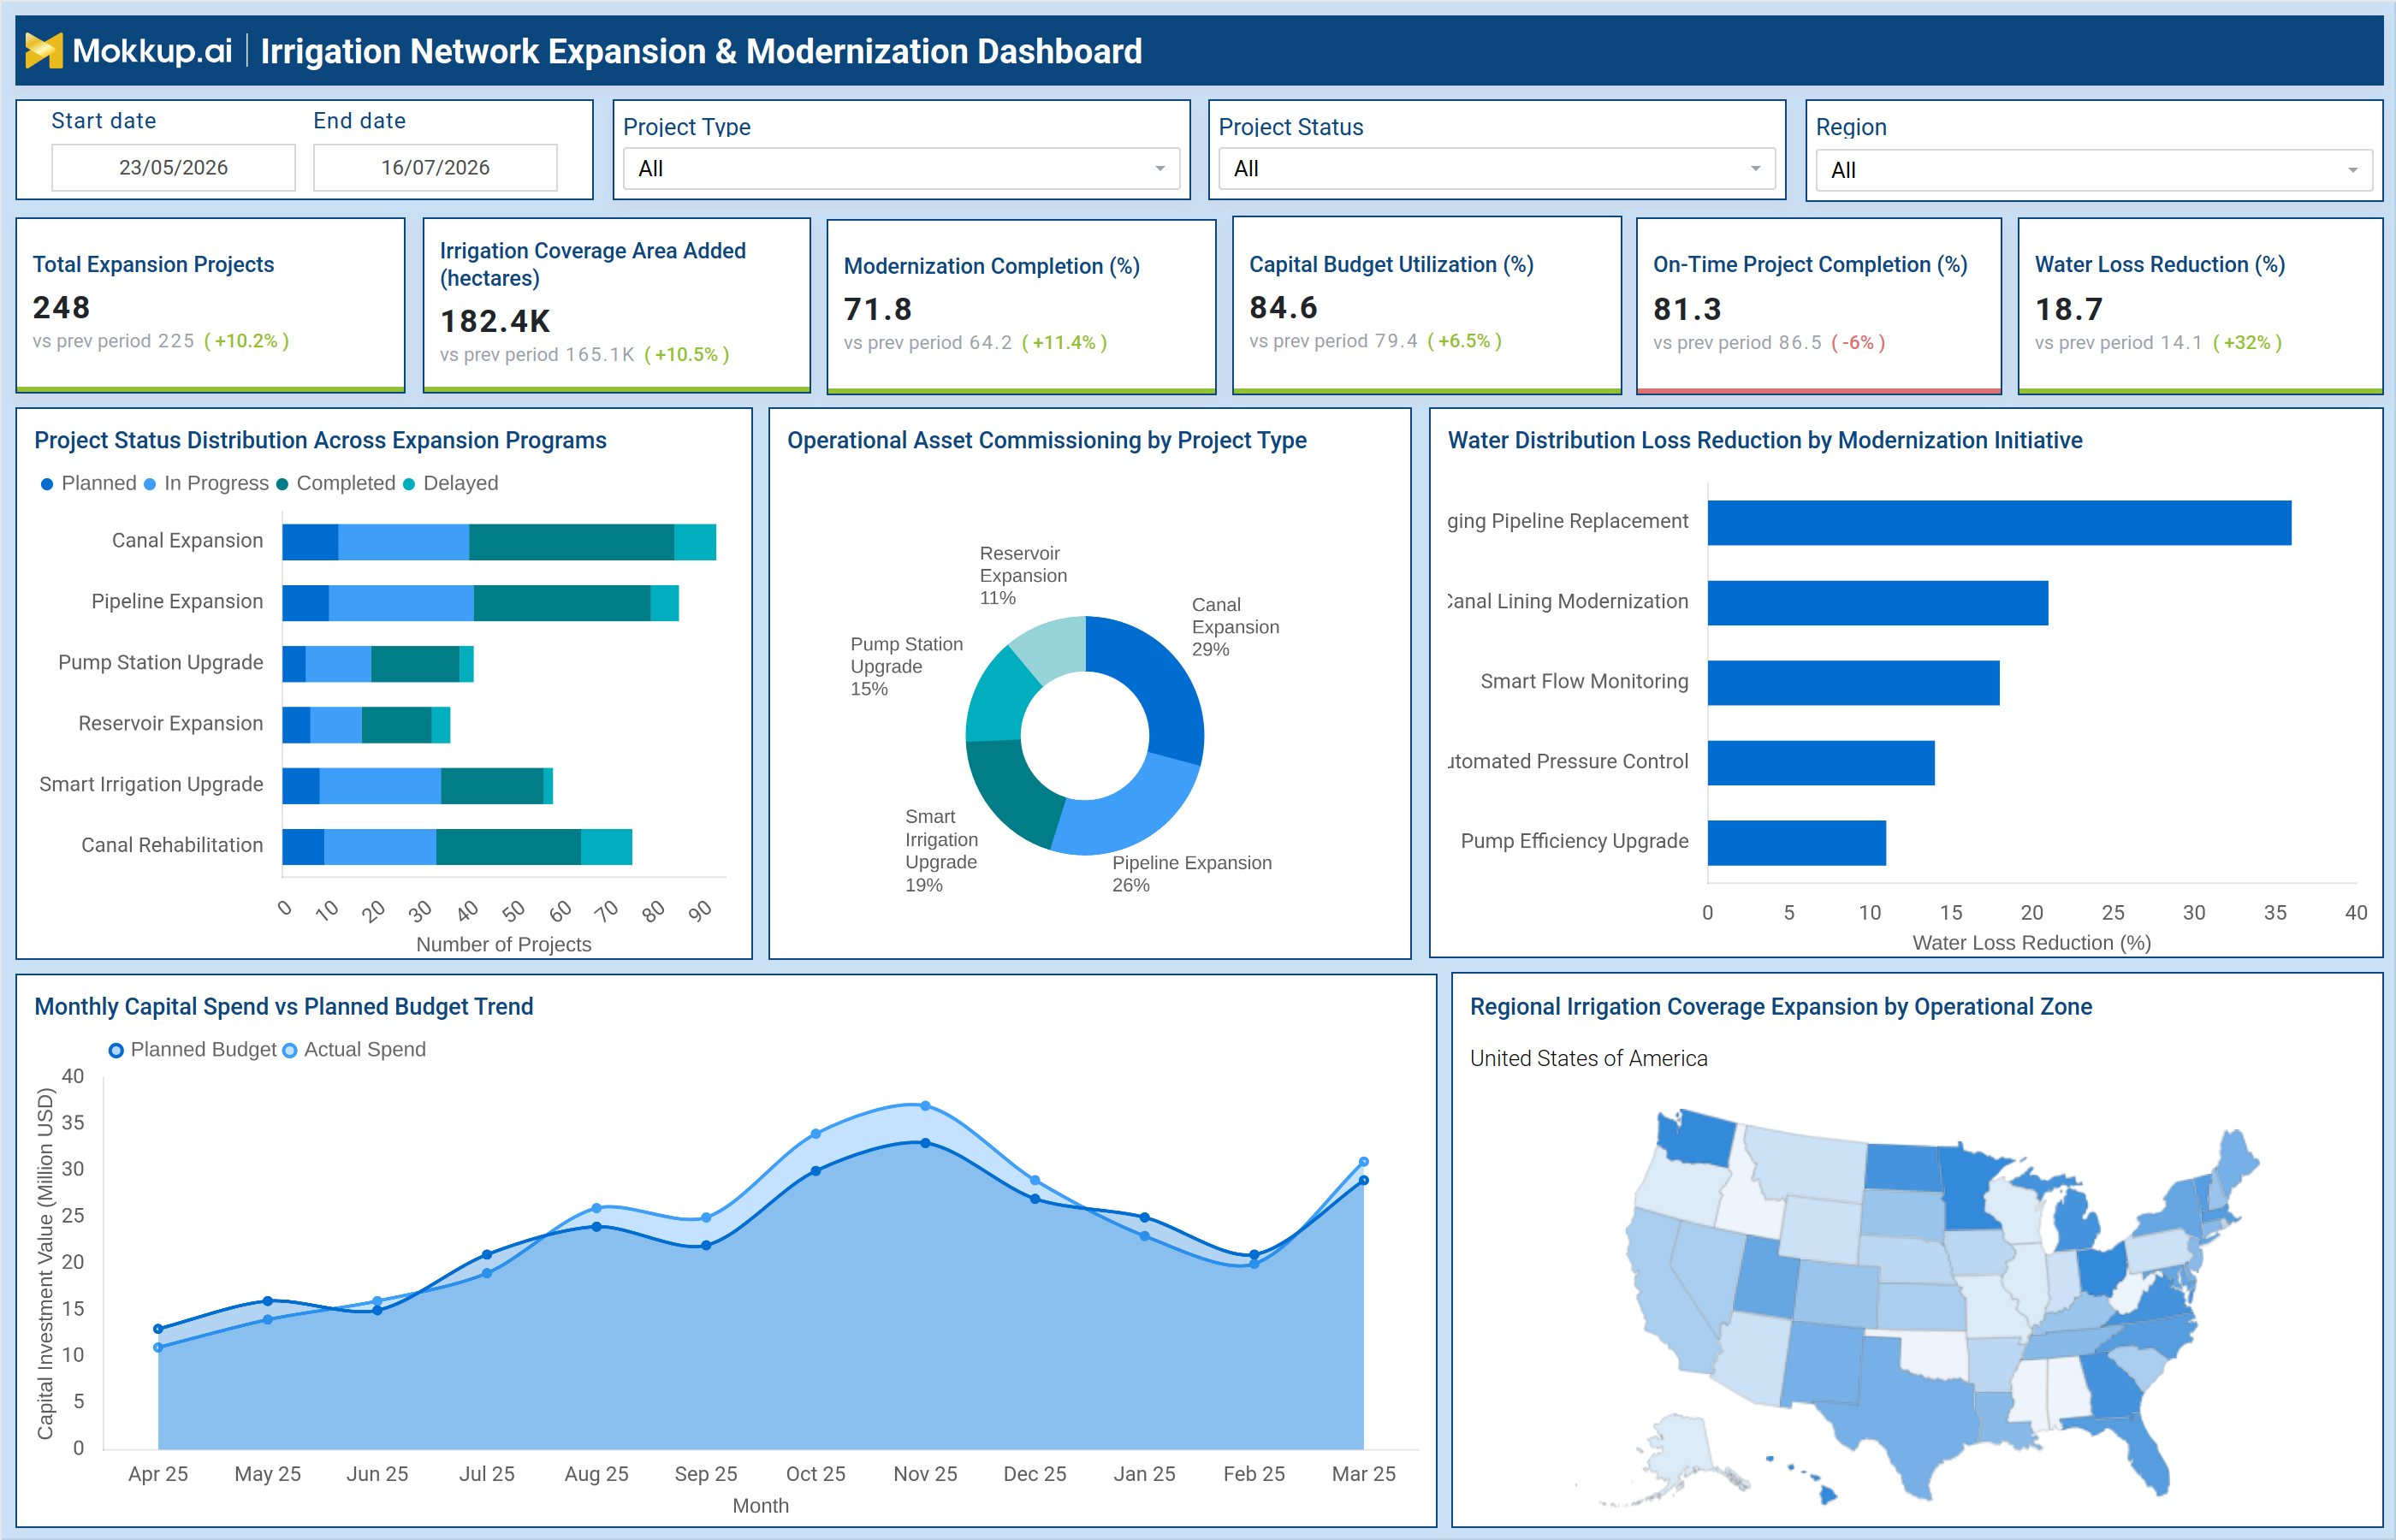
Irrigation Network Expansion & Modernization Dashboard Example
A typical smart irrigation network modernization KPI dashboard includes KPI cards for total expansion projects, irrigation coverage area added, modernization completion percentage, capital budget utilization, on-time project completion, and water loss reduction percentage. In the provided dashboard example, management teams can monitor infrastructure growth and modernization progress across multiple irrigation programs. The dashboard includes project status distribution visuals showing planned, in-progress, completed, and delayed projects across initiatives such as canal expansion, pipeline expansion, pump station upgrades, reservoir expansion, and smart irrigation upgrades.
This helps project teams identify delays and prioritize execution activities. The irrigation distribution infrastructure upgrade analytics dashboard also tracks operational asset commissioning by project type, helping organizations evaluate infrastructure activation across modernization programs. Water loss reduction analytics further measure the operational impact of modernization initiatives such as aging pipeline replacement, canal lining modernization, smart flow monitoring, automated pressure control, and pump efficiency upgrades. The dashboard additionally supports irrigation network capacity expansion monitoring requirements by comparing monthly planned budgets against actual capital spending trends. Regional irrigation coverage maps help utilities identify areas receiving infrastructure expansion investments and modernization support.
How to Analyze Data in Irrigation Network Expansion & Modernization Dashboard
Here is how you can analyze data from this dashboard:
- Monitor Total Expansion Projects: Track the number of active and completed expansion projects to evaluate infrastructure growth progress and strategic development efforts.
- Track Irrigation Coverage Area Added: Measure the increase in irrigated land area to assess the impact of expansion initiatives on service reach and water accessibility.
- Analyze Modernization Completion Rates: Monitor the completion status of modernization projects to evaluate execution efficiency and ensure the timely delivery of infrastructure upgrades.
- Compare Capital Budget Utilization Against Project Progress: Assess how effectively capital budgets are being used relative to project milestones and overall implementation progress.
- Monitor On-Time Project Completion Trends: Track project delivery timelines to identify delays, improve scheduling accuracy, and enhance project management performance.
- Analyze Water Loss Reduction Percentages: Measure reductions in water losses achieved through modernization initiatives to evaluate their effectiveness and operational benefits.
- Review Project Status Distribution: Analyze projects by status, such as planning, in progress, completed, or delayed, to gain visibility into expansion program performance.
- Track Operational Asset Commissioning by Project Type: Monitor the deployment and activation of new infrastructure assets to ensure successful project outcomes and operational readiness.
- Compare Planned Versus Actual Capital Spending Trends: Evaluate budget performance by comparing forecasted and actual expenditures to improve financial planning and project governance.
- Identify Delayed Projects Requiring Intervention: Detect projects that are behind schedule so that corrective actions can be taken to minimize risks and maintain delivery targets.
- Analyze Regional Irrigation Coverage Expansion Performance: Compare expansion outcomes across different regions to identify areas of success and opportunities for further investment.
- Evaluate Infrastructure Modernization Initiatives: Assess the effectiveness of modernization programs in reducing operational losses, improving efficiency, and enhancing infrastructure performance.
Benefits of Irrigation Network Expansion & Modernization Dashboard
The following are the benefits of using this dashboard:
- Improves Visibility into Infrastructure Projects: Provides a centralized view of irrigation expansion and modernization initiatives, enabling stakeholders to track project progress more effectively.
- Enhances Modernization Program Monitoring: Tracks the status, performance, and outcomes of modernization efforts to ensure projects achieve their intended objectives.
- Supports Efficient Capital Investment Planning: Helps prioritize funding and allocate resources effectively by providing insights into project costs, budgets, and expected benefits.
- Reduces Water Distribution Losses: Supports modernization initiatives that improve infrastructure efficiency and minimize water losses across irrigation networks.
- Improves Irrigation Coverage Expansion Management: Monitors the growth of irrigated areas to ensure expansion projects deliver the desired increase in service coverage.
- Helps Monitor Infrastructure Upgrade Performance: Evaluates the effectiveness of infrastructure improvements in enhancing operational efficiency, reliability, and service delivery.
- Improves Project Execution and Delivery Tracking: Provides visibility into project timelines, milestones, and completion rates to support timely and successful project delivery.
- Supports Data-Driven Modernization Planning: Delivers actionable insights that help organizations plan and prioritize future modernization and expansion initiatives.
- Enhances Operational Asset Commissioning Visibility: Tracks the deployment and activation of new infrastructure assets to ensure smooth transitions from project completion to operations.
- Optimizes Budget Utilization Across Projects: Compares planned and actual spending to improve financial oversight and maximize the value of capital investments.
- Improves Regional Infrastructure Planning: Analyzes expansion and modernization performance across regions to support balanced infrastructure development and resource allocation.
- Enables Proactive Project Risk Management: Identifies delays, budget variances, and performance issues early, allowing teams to take corrective action before risks escalate.
KPIs to Track in Irrigation Network Expansion & Modernization Dashboard
The following key KPIs can be tracked by using this dashboard:
- Total Expansion Projects: Measures the number of active irrigation expansion initiatives.
- Irrigation Coverage Area Added (hectares): Tracks additional irrigation coverage created through expansion programs.
- Modernization Completion (%): Measures percentage completion of modernization projects.
- Capital Budget Utilization (%): Tracks usage of allocated modernization and expansion budgets.
- On-Time Project Completion (%): Measures percentage of projects completed within planned schedules.
- Water Loss Reduction (%): Tracks reduction in water distribution losses after modernization initiatives.
Frequently Asked Questions
1. What is the purpose of an irrigation network modernization dashboard?
The dashboard helps organizations monitor infrastructure expansion, modernization progress, budget utilization, and operational improvements across irrigation networks.
2. Who uses this dashboard?
Irrigation authorities, water utilities, infrastructure planners, engineering teams, and project management offices use this dashboard for modernization monitoring and project analytics.
3. Why is irrigation modernization important?
Modernization improves water distribution efficiency, reduces operational losses, enhances irrigation coverage, and supports sustainable water management.