
What is a Waste Management Dashboard?
A Waste Management Dashboard is a centralized reporting tool that tracks waste collection, diversion, disposal, and landfill usage across regions or sectors. It allows operations teams to monitor performance in real time and identify inefficiencies in the waste lifecycle. Organizations utilize this dashboard to track waste generation trends, assess recycling performance, and monitor diversion rates, while ensuring compliance with environmental standards. A waste management dashboard wireframe helps teams standardize reporting, reduce manual tracking, and monitor waste workflows across residential, commercial, and industrial areas. This makes it a reliable solution for teams looking to adopt the best dashboard for waste management operations.
How to Create a Waste Management Dashboard
You don’t need to build your report from scratch—just start with a ready-to-use dashboard template from Mokkup. Add in your data and export it however you like. Here’s how to do it:
1. Create or Log in to Your Mokkup Account
Start by signing up on Mokkup.ai using your email. If you already have an account, just log in, and you’ll be good to go.
2. Choose and Customize Your Dashboard Template
Find the Waste Management Dashboard template in the Templates section. Use the drag-and-drop editor to adjust KPIs, edit filters, or add elements based on your data.
3. Export to Your BI Tool
Once your dashboard wireframe is ready, use the BI Tool Export feature to send it directly to Power BI or Tableau for further analysis and enhancements. You can also download the dashboard as a PDF, PNG, or JPEG, embed it on a platform, or invite your team to collaborate.
Note: This is a Pro template. You’ll need a Pro subscription on Mokkup to use and customize this dashboard wireframe. Upgrade anytime to unlock full access.
Waste Management Dashboard Example
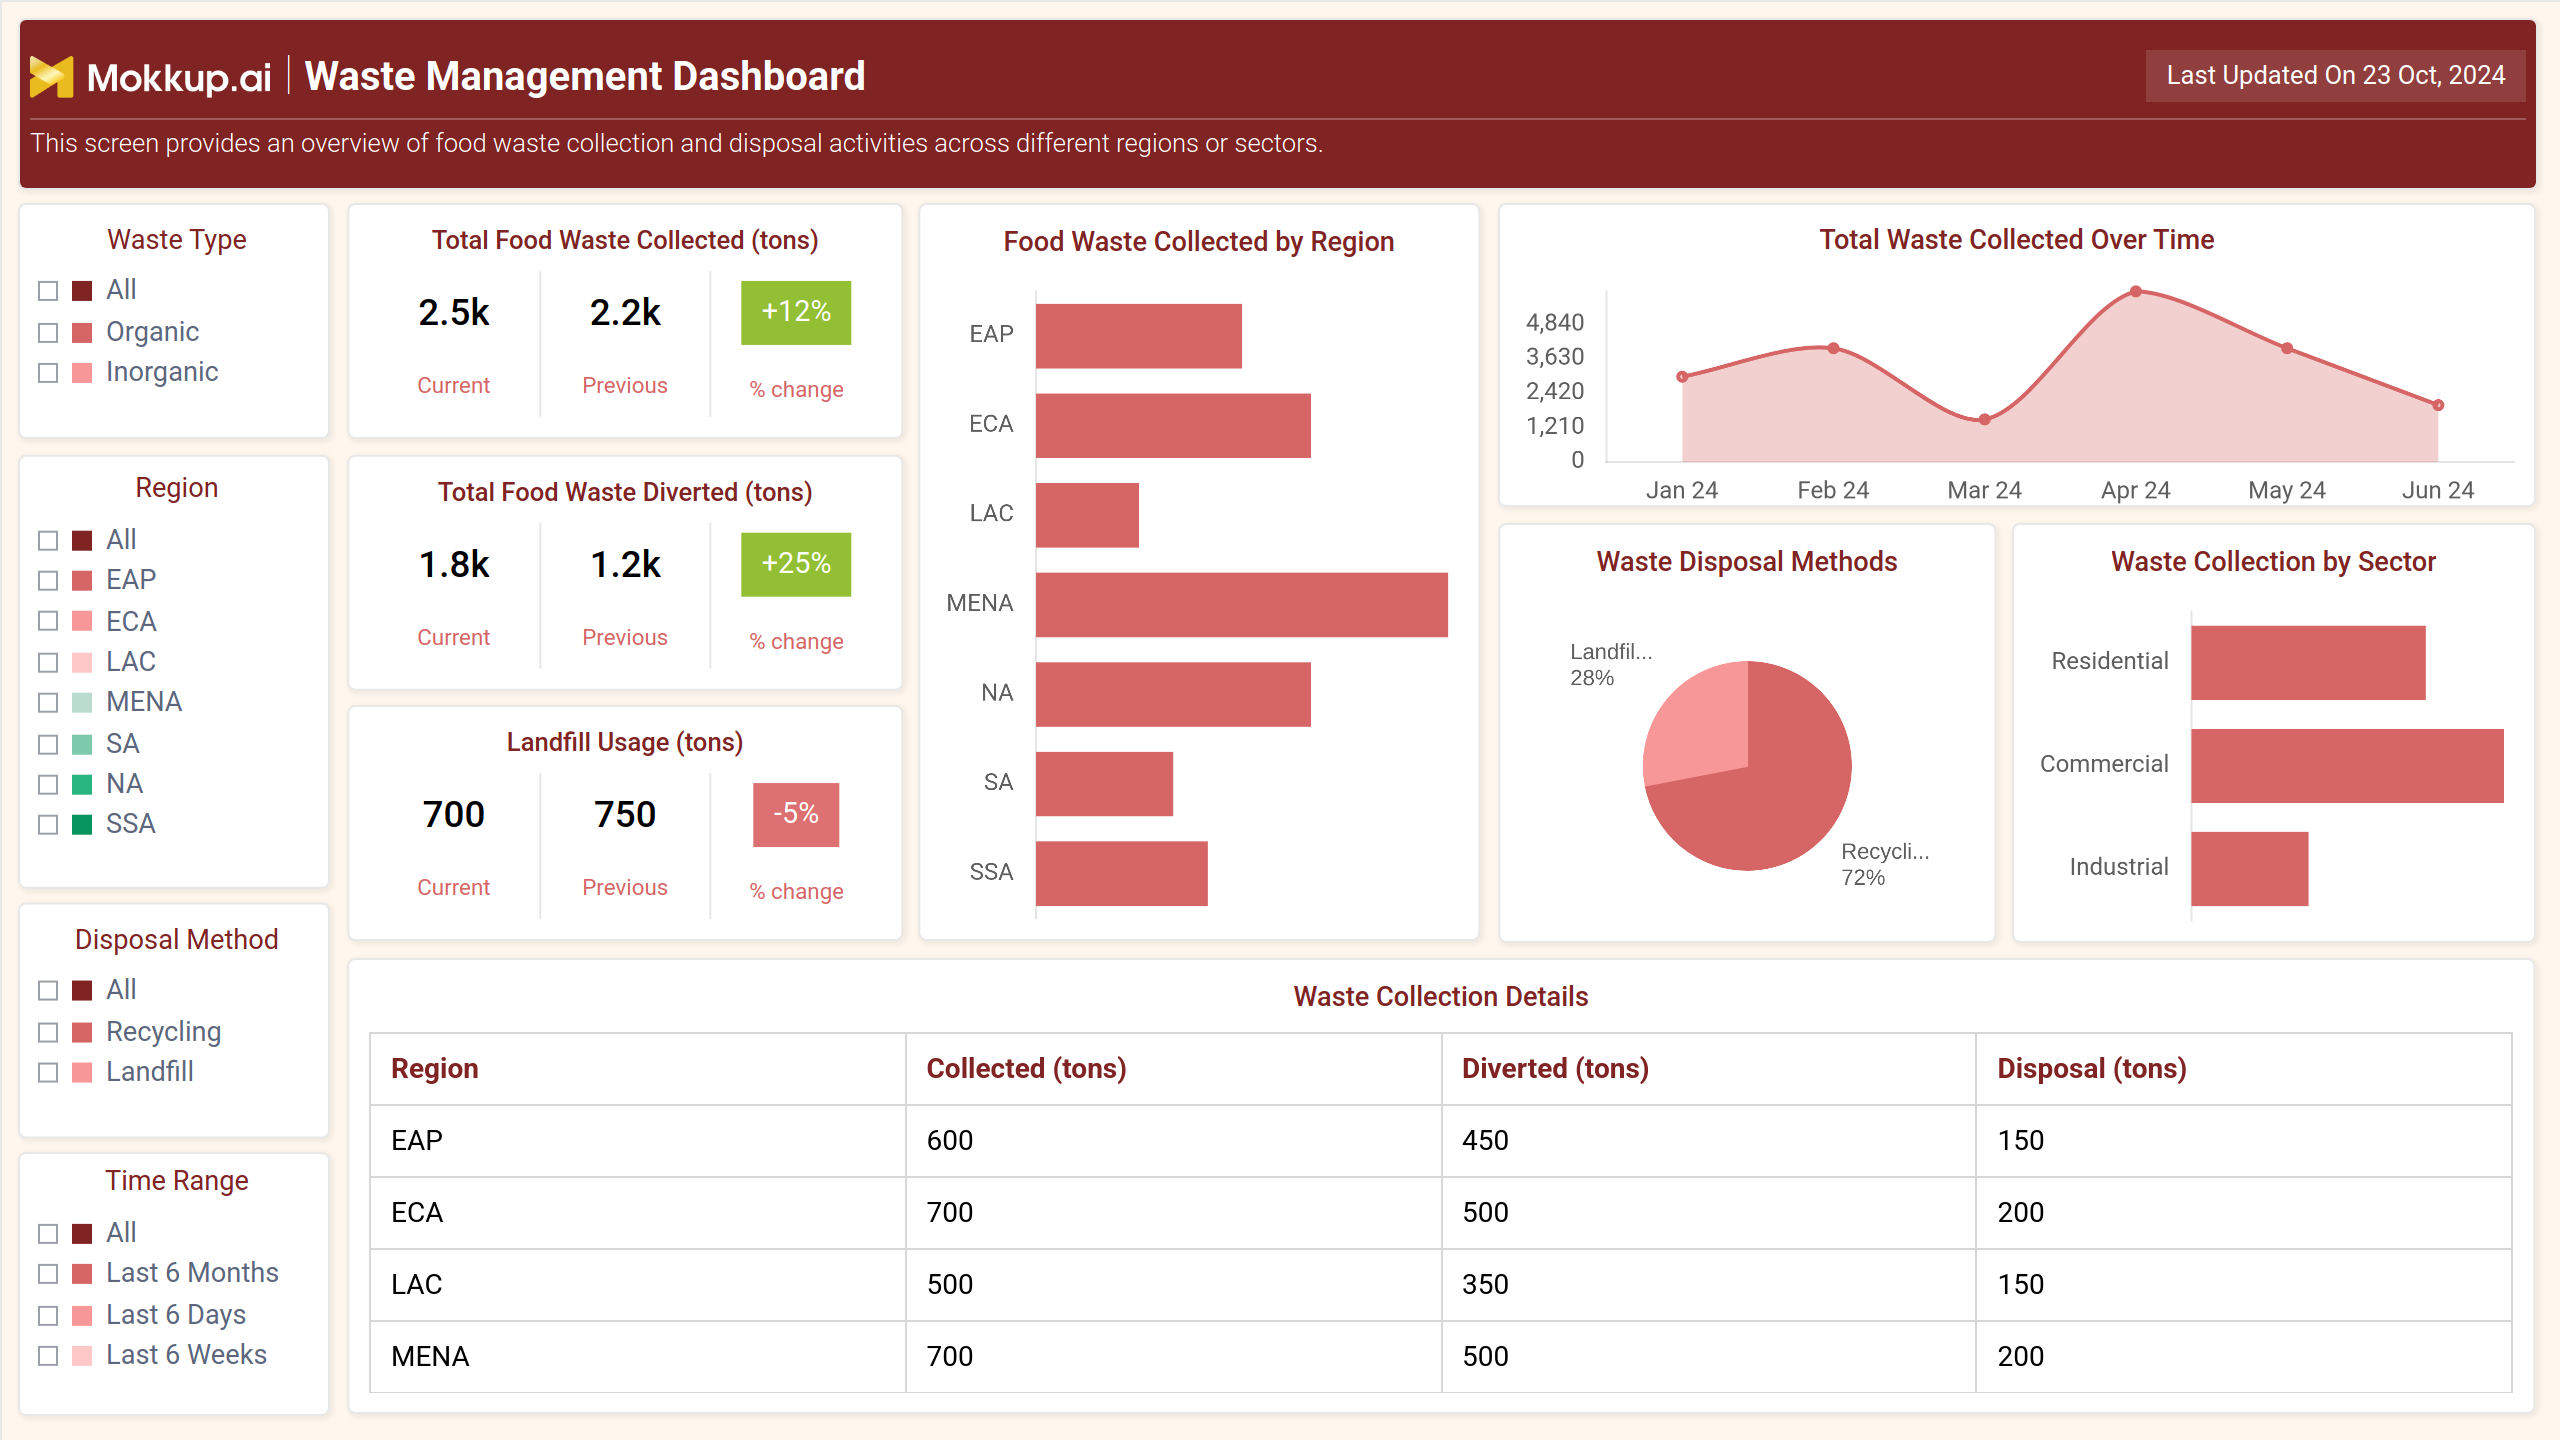
A Waste Management Dashboard example typically includes charts and metrics that simplify waste operations data. Based on the reference dashboard, the design consists of bar charts, pie charts, trend lines, and region-wise tables for quick comparison. Key KPIs such as Total Food Waste Collected, Food Waste Collected by Region, Total Waste Collected Over Time, Waste Disposal Methods, and Waste Collection Details help operations teams review collection volumes and landfill activity.
The dashboard utilizes bar charts to compare food waste collection by region and waste collected by sector, as well as line charts to track waste accumulation over time. Additionally, it features pie charts to display disposal method distribution and data tables to break down collected, diverted, and disposed tonnage for each region. This waste operations dashboard for collection teams is suitable for government departments, facility managers, and waste operations teams who need a consistent way to track landfill usage and waste volume trends.
How to Analyze Data in Waste Management Dashboards
You can use this dashboard to track landfill usage and waste volume trends. Here is how:
- Review total food waste collected to identify rising waste generation or improved collection coverage.
- Compare food waste collected by region using bar charts to detect high- and low-performing areas.
- Track waste collected over time to understand seasonality or operational delays.
- Use landfill usage and diversion metrics to measure progress toward sustainability targets.
- Analyze waste disposal methods to evaluate the benefits of recycling versus landfill dependence.
- Examine collection details by region to assess workload distribution and operational efficiency.
- Monitor sector-wise waste generation to identify which segments, residential, commercial, or industrial, need operational adjustments.
Benefits of Waste Management Dashboards
- Provides a real-time view of waste collection and landfill activity.
- Reduces operational blind spots by consolidating regional and sector-wise data.
- Helps teams compare historical waste trends for better planning.
- Improves decision-making for diversion and recycling programs.
- Supports compliance reporting for environmental and waste regulations.
- Streamlines operations for collection teams by giving them actionable KPIs.
- Enhances transparency between departments, contractors, and municipal teams.
- Identifies cost-saving opportunities through waste volume optimization.
KPIs to Track in Waste Management Dashboards
- Total Food Waste Collected: Measures the total volume of waste collected across all regions during a given period.
- Food Waste Collected by Region: Compares regional performance using bar charts to highlight collection strengths or gaps.
- Total Waste Collected Over Time: Tracks monthly collection trends using a line chart to reveal seasonal patterns or fluctuations.
- Total Food Waste Diverted: Shows how much waste has been diverted from landfills through recycling programs.
- Landfill Usage: Helps track landfill dependency and detect increasing disposal trends.
- Waste Disposal Methods: Displays the split between landfill and recycling using pie charts to measure sustainability impact.
- Waste Collection Details: Provides a table view of collected, diverted, and disposed waste for operational accuracy.
- Waste Collection by Sector: Helps identify waste generation patterns across residential, commercial, and industrial segments.
Frequently Asked Questions
Q1. How to create a waste control dashboard?
To create a waste control dashboard, identify key metrics such as total waste collected, landfill usage, and diversion rates. Use a BI tool or dashboard template to visualize data through charts, tables, and trend lines. Ensure real-time data integration for accurate monitoring.
Q2.What metrics should be tracked in waste management dashboards?
Essential metrics include total food and water waste collected, landfill usage, waste diversion, compost produced, energy generated from waste, and cost savings from prevention. Tracking these KPIs helps assess both operational efficiency and sustainability progress.
Q3. Best dashboard templates for environmental data visualization?
The Waste Management Dashboard template from Mokkup provides a comprehensive solution for environmental data visualization. It tracks total waste collected, diverted, and prevented, monitors compost production and energy generation, and visualizes cost savings and progress toward reduction targets.
Q4. How to monitor waste reduction KPIs effectively?
To monitor KPIs effectively, set clear targets for waste reduction, compost production, and cost savings. Use gauge charts to track progress, scatter plots for correlation analysis, and regional breakdowns to identify trends.
Q5. What features are essential in waste tracking software?
Key features include seamless integration with BI tools such as Power BI and Tableau, customizable KPI tracking, sector-wise and region-wise reporting, and sustainability insights like compost production and energy generation. The user-friendly dashboard interface enables quick data-driven decision-making, while connectivity with existing data sources ensures efficient monitoring and analysis.