
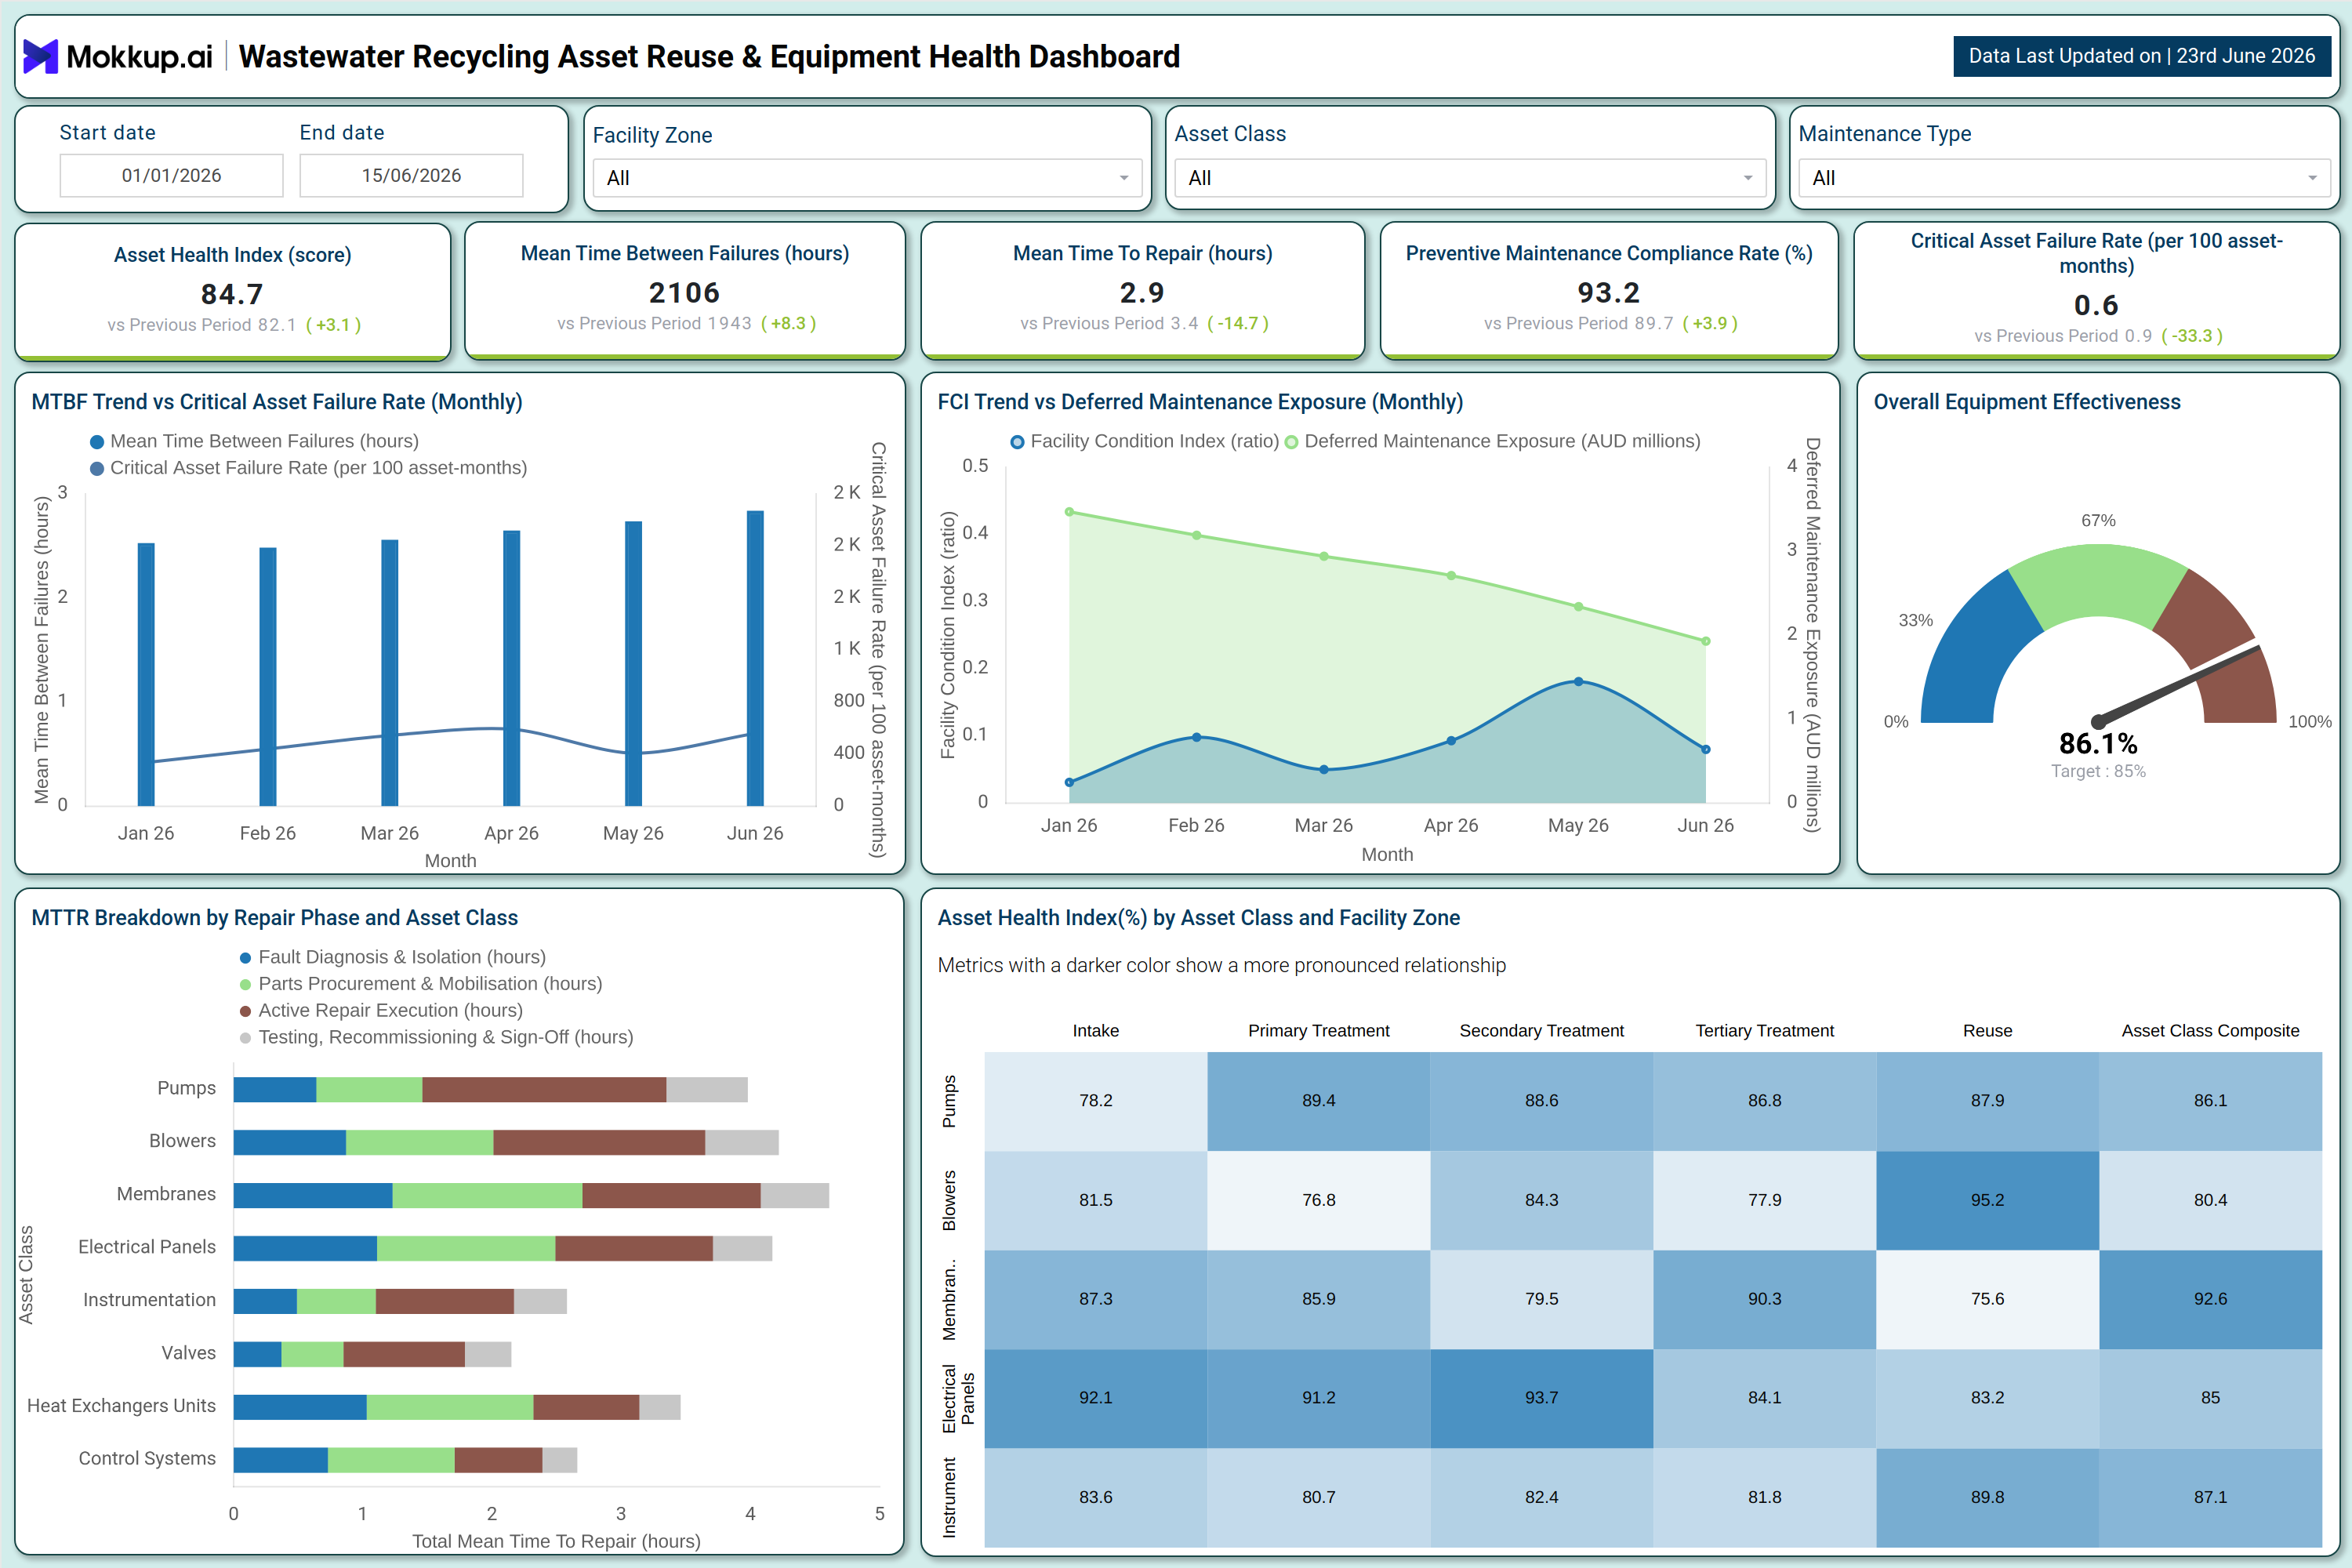
What is a Wastewater Recycling Asset Reuse & Equipment Health Dashboard?
A Wastewater Recycling Asset Reuse & Equipment Health Dashboard is a centralized monitoring tool that gives operations and maintenance teams a structured view of equipment performance across a wastewater treatment facility. It consolidates key maintenance metrics, including asset health scores, failure rates, repair turnaround times, and preventive maintenance compliance into a single interface that operations managers can act on without digging through disparate reports.
By organizing data across facility zones such as Primary Treatment, Secondary Treatment, Tertiary Treatment, and Reuse, teams can compare asset conditions at the zone level and identify where degradation is occurring before it escalates into unplanned downtime. The dashboard also tracks the Facility Condition Index alongside deferred maintenance exposure, giving asset managers a financially grounded view of infrastructure risk. For utilities and industrial wastewater operators focused on wastewater equipment health monitoring, this dashboard replaces manual tracking with a consistent, visual framework that supports faster decisions and better maintenance planning.
How to Create a Wastewater Recycling Asset Reuse & Equipment Health Dashboard
You don't need to build your report from scratch; just start with a ready-to-use dashboard template from Mokkup. Add in your data and export it however you like. Here's how to do it:
1. Create or Log in to Your Mokkup Account
Start by signing up on Mokkup.ai using your email. If you already have an account, just log in, and you'll be good to go.
2. Choose and Customize Your Dashboard Template
Find the Wastewater Recycling Asset Reuse & Equipment Health Dashboard template in the Templates section. Use the drag-and-drop editor to adjust KPIs, edit filters, or add elements based on your data.
3. Export to Your BI Tool
Once your dashboard wireframe is ready, use the BI Tool Export feature to send it directly to Power BI or Tableau for further analysis and enhancements. You can also download the dashboard as a PDF, PNG, or JPEG, embed it on a platform, or invite your team to collaborate.
Note: This is a Pro template. You'll need a Pro subscription on Mokkup to use and customize this dashboard wireframe. Upgrade anytime to unlock full access.
Wastewater Recycling Asset Reuse & Equipment Health Dashboard Example
Maintenance teams at wastewater treatment facilities typically start their day by checking the Asset Health Index across all zones. When the score for a specific zone drops below acceptable thresholds, they can drill down by asset class, comparing pumps, blowers, membranes, valves, and heat exchangers to isolate which equipment is pulling the zone composite score down. This asset class breakdown by facility zone makes it possible to prioritize inspection and repair resources rather than applying a blanket response across the entire facility. From there, reliability engineers use the MTBF Trend vs Critical Asset Failure Rate chart to understand whether equipment reliability is improving or worsening month over month.
If the critical asset failure rate is climbing while the mean time between failures is shrinking, that signals a systemic issue in a specific asset class or zone that warrants a deeper root cause investigation. Pairing this trend data with the preventive maintenance compliance rate helps teams determine whether failures are linked to missed maintenance windows or genuine end-of-life degradation. Operations leaders use this view to build business cases for capital investment in asset reuse and equipment replacement cycles.
How to Analyze Data in a Wastewater Recycling Asset Reuse & Equipment Health Dashboard
Here is how you can analyze data from such MTBF, MTTR tracking water utility dashboard:
- Filter by Facility Zone to isolate performance issues within Primary, Secondary, Tertiary Treatment, or Reuse zones
- Use the Asset Health Index heatmap to compare zone-level and asset-class-level scores side by side
- Monitor the MTBF trend line monthly to detect early signs of deteriorating equipment reliability
- Cross-reference Preventive Maintenance Compliance Rate against Critical Asset Failure Rate to assess the impact of maintenance adherence
- Review the FCI vs Deferred Maintenance Exposure chart to quantify the financial risk of maintenance backlogs in wastewater asset lifecycle management
- Break down MTTR by repair phase and asset class to pinpoint which steps in the repair process are creating the most delay
- Track Overall Equipment Effectiveness as a composite signal for facility-wide operational readiness
- Apply the Maintenance Type filter to separate corrective, preventive, and predictive maintenance data for more targeted analysis
Benefits of a Wastewater Recycling Asset Reuse & Equipment Health Dashboard
The following are the benefits of using this Asset Health Index Wastewater Treatment dashboard:
- Reduces unplanned downtime by surfacing deteriorating asset health scores before failures occur
- Supports wastewater facility asset management by consolidating zone and asset-class data in one view
- Improves maintenance resource allocation by identifying which asset classes have the highest repair time
- Strengthens preventive maintenance programs by tracking compliance rates against failure outcomes
- Provides a financial risk view through deferred maintenance exposure trends
- Enables faster root cause analysis using the MTTR phase breakdown by asset class
- Helps justify capital investment decisions with FCI trend data for equipment health tracking in water utilities
- Supports regulatory readiness by maintaining a continuous record of equipment performance metrics
KPIs to Track in a Wastewater Recycling Asset Reuse & Equipment Health Dashboard
The following key KPIs can be tracked by using this Wastewater Equipment Health Monitoring dashboard:
- Asset Health Index (Score): A composite score reflecting the overall condition of assets across facility zones and asset classes; lower scores indicate equipment requiring immediate attention
- Mean Time Between Failures (MTBF, hours): The average time elapsed between equipment failures; higher values indicate better reliability in preventive maintenance tracking for water utilities
- Mean Time To Repair (MTTR, hours): The average time required to restore a failed asset to operational status; used to assess maintenance team efficiency and repair workflow bottlenecks
- Preventive Maintenance Compliance Rate (%): The percentage of scheduled preventive maintenance tasks completed on time; directly linked to reducing critical asset failure rates
- Critical Asset Failure Rate (per 100 asset-months): The frequency of failures among critical assets relative to fleet size and time; a key measure in wastewater equipment health monitoring
Frequently Asked Questions
1. What asset classes can be tracked in a Wastewater Recycling Asset Reuse & Equipment Health Dashboard?
The dashboard supports tracking across asset classes, including pumps, blowers, membranes, electrical panels, instrumentation, valves, heat exchangers, and control systems. Each class can be compared across facility zones using the Asset Health Index heatmap for targeted maintenance prioritization.
2. How does the dashboard support wastewater asset lifecycle management?
By combining the Facility Condition Index trend with deferred maintenance exposure data, the dashboard gives asset managers a view of where infrastructure risk is accumulating over time. This supports decisions around equipment reuse, replacement scheduling, and capital budget planning.
3. Can this dashboard be used across multiple facility zones?
Yes, the Facility Zone filter in this wastewater facility asset management dashboard allows users to isolate data for Primary Treatment, Secondary Treatment, Tertiary Treatment, and Reuse zones independently. The Asset Health Index heatmap also displays zone-by-asset-class breakdowns simultaneously for cross-zone comparison.